HAL Id: hal-00906443
https://hal.archives-ouvertes.fr/hal-00906443
Submitted on 8 Mar 2018
HAL is a multi-disciplinary open access
archive for the deposit and dissemination of sci-entific research documents, whether they are pub-lished or not. The documents may come from teaching and research institutions in France or
L’archive ouverte pluridisciplinaire HAL, est destinée au dépôt et à la diffusion de documents scientifiques de niveau recherche, publiés ou non, émanant des établissements d’enseignement et de recherche français ou étrangers, des laboratoires
Fluorescence and second-harmonic generation
correlative microscopy to probe space charge separation
and silver cluster stabilization during direct laser
writing in a tailored silver-containing glass
Gautier Papon, Yannick Petit, Nicolas Marquestaut, Arnaud Royon, Marc
Dussauze, Vincent Rodriguez, Thierry Cardinal, Lionel Canioni
To cite this version:
Gautier Papon, Yannick Petit, Nicolas Marquestaut, Arnaud Royon, Marc Dussauze, et al.. Fluores-cence and second-harmonic generation correlative microscopy to probe space charge separation and silver cluster stabilization during direct laser writing in a tailored silver-containing glass. Optical Materials Express, OSA pub, 2013, 3 (11), pp.1855-1861. �10.1364/OME.3.001855�. �hal-00906443�
Fluorescence and second-harmonic generation
correlative microscopy to probe space charge
separation and silver cluster stabilization during
direct laser writing in a tailored
silver-containing glass
G. Papon,1 Y. Petit,1,2,* N. Marquestaut,1 A. Royon,1 M. Dussauze,3
V. Rodriguez,3 T. Cardinal,2 and L. Canioni1
1Univ. Bordeaux, LOMA, UMR 5798, F-33400 Talence, France, and CNRS, LOMA, UMR 5798, F-33400 Talence, France
2CNRS, ICMCB, UPR 9048, F-33608 Pessac, France, and Univ. Bordeaux, ICMCB, UPR 9048, F-33400 Pessac, France
3Univ. Bordeaux, ISM, UMR 5255, F-33400 Talence, France and CNRS, ISM, UMR 5255, F-33400 Talence, France
* yannick.petit@u-bordeaux1.fr
Abstract: We report on fluorescence and second-harmonic generation
correlative microscopy of femtosecond direct laser-induced structures in a tailored silver-containing phosphate glass. We compare the spatial distributions of the related permanent electric field and silver clusters. The latter appear to be co-localized where the associated electric potential ensures favorable reduction-oxidation conditions for their formation and stabilization. Space charge separation is shown to occur prior the cluster formation. The associated electric field is a key parameter for silver clustering, thanks to electric field assisted silver ion motion. Future photonic structures combining 3D laser-structured fluorescence and nonlinear optical properties in such tailored glass will require an optimal control of the induced electric field distribution.
©2013 Optical Society of America
OCIS codes: (140.3390) Laser materials processing; (140.3450) Laser-induced chemistry;
(160.2540) Fluorescent and luminescent materials; (210.4810) Optical storage-recording materials; (230.4320) Nonlinear optical devices.
References and links
1. M. Masuda, K. Sugioka, Y. Cheng, N. Aoki, M. Kawachi, K. Shihoyama, K. Toyoda, H. Helvajian, and K. Midorikawa, “3-D microstructuring inside photosensitive glass by femtosecond laser excitation,” Appl. Phys., A Mater. Sci. Process. 76(5), 857–860 (2003).
2. Y. Bellouard, “On the bending strength of fused silica flexures fabricated by ultrafast lasers [Invited],” Opt. Mater. Express 1(5), 816–831 (2011).
3. R. R. Gattass and E. Mazur, “Femtosecond laser micromachining in transparent materials,” Nat. Photonics 2(4), 219–225 (2008).
4. J. Qiu, K. Miura, and K. Hirao, “Femtosecond laser-induced microfeatures in glasses and their applications,” J. Non-Cryst. Solids 354(12-13), 1100–1111 (2008).
5. A. Royon, Y. Petit, G. Papon, M. Richardson, and L. Canioni, “Femtosecond laser induced photochemistry in materials tailored with photosensitive agents,” Opt. Mater. Express 1(5), 866–882 (2011).
6. K. Bourhis, A. Royon, M. Bellec, J. Choi, A. Fargues, M. Treguer, J.-J. Videau, D. Talaga, M. Richardson, T. Cardinal, and L. Canioni, “Femtosecond laser structuring and optical properties of a silver-containing glass,” J. Non-Cryst. Solids 356(44-49), 2658–2665 (2010).
7. A. Royon, K. Bourhis, M. Bellec, G. Papon, B. Bousquet, Y. Deshayes, T. Cardinal, and L. Canioni, “Silver clusters embedded in glass as a perennial high capacity optical recording medium,” Adv. Mater. 22(46), 5282– 5286 (2010).
9. H. Takebe, P. G. Kazansky, P. S. Russell, and K. Morinaga, “Effect of poling conditions on second-harmonic generation in fused silica,” Opt. Lett. 21(7), 468–470 (1996).
10. P. G. Kazansky, P. St. J. Russel, and H. Takebe, “Glass fiber poling and applications,” J. Lightwave Technol.
15(8), 1484–1493 (1997).
11. M. Dussauze, T. Cremoux, G. Yang, F. Adamietz, T. Cardinal, V. Rodriguez, and E. Fargin, “Thermal poling of optical glasses: mechanisms and second order optical properties,” Int. J. Appl. Glass Science 3(4), 309–320 (2012).
12. J. Choi, M. Bellec, A. Royon, K. Bourhis, G. Papon, T. Cardinal, L. Canioni, and M. Richardson, “Three-dimensional direct femtosecond laser writing of second-order nonlinearities in glass,” Opt. Lett. 37(6), 1029– 1031 (2012).
13. G. Papon, N. Marquestaut, Y. Petit, A. Royon, M. Dussauze, V. Rodriguez, T. Cardinal, and L. Canioni, “Femtosecond direct laser poling of sub-micron, stable and efficient second-order optical properties in a tailored silver phosphate glass,” submitted to (2013).
14. M. Bellec, A. Royon, K. Bourhis, J. Choi, B. Bousquet, M. Treguer, T. Cardinal, J.-J. Videau, M. Richardson, and L. Canioni, “3D patterning at the nanoscale of fluorescent emitters in glass,” J. Phys. Chem. C 114(37), 15584–15588 (2010).
15. R. Ascázubi, C. Shneider, I. Wilke, R. Pino, and P. Dutta, “Enhanced terahertz emission from impurity compensated GaSb,” Phys. Rev. B 72(4), 045328 (2005).
1. Introduction
Femtosecond direct laser writing (DLW) in homogeneous glasses gives three-dimensional access to local material modifications at the micro-nanoscale, at the root of chemical [1], mechanical [2] as well as optical [3] contrasts. Such approach already demonstrated an extremely broadband range of fundamental mechanisms and original applications [4,5].
Fluorescence contrast has already largely been reported [6], providing suitable approach for perennial high-density 3D data storage [7]. On the other hand, nonlinear optical contrast has also been reported, in a smaller proportion, with third-harmonic generation (THG) [8] but also effective second-harmonic generation (SHG), even in an initially centro-symmetric material, thanks to local space charge separation. Such buried static electric field induced second-harmonic generation (EFISHG) has largely been reported under thermal poling leading to intense electric fields up to 109 V.m−1 [9–11], with a typical thickness of the poled
region ranging from 1 to few tens of microns. Such effective second-order nonlinearity originates from the coupling of the static electric field EDC with the third-order nonlinear
susceptibility χ(3) of the glass, to make (2) 3 (3).
eff
χ = EDC⋅ χ While thermal poling is restricted
to 2D material structuring, direct laser poling (DLP) gives promising 3D access to the local engineering of the buried electric field at the root of the EFISHG, with similar remnant electric field amplitude [12]. However, to our knowledge, no correlative studies of both fluorescence and nonlinear laser-induced responses originating from fs DLW were conducted in detail, in order to improve the understanding of the joint production processes of both of these optical responses.
In this article, we report on correlative microscopy studies of both fluorescence and effective second-order nonlinear responses that resulted from 3D fs laser irradiation in our tailored silver-containing phosphate glass. We depict original spatial distributions of SHG for different DLW conditions, enlarging recently published observations [12]. Then, fluorescence and SHG spatial distributions are compared, showing a clear anti-correlation of these patterns. The buried static electric field, originating from the space charge creation under DLP, is modelled, which offers experimental access to the local electric potential modification. The fluorescence pattern, originating from silver cluster production, is shown to remarkably match such modified electric potential distribution. Laser-induced space charge separation and fluorescent cluster creation are investigated, providing correlative information on both laser-induced buried electric field and associated electric potential modifications, respectively. The
EFISHG efficiency ( (2) 0.6 . 1 eff pm − χ V , typically corresponding to 8.10 .8 1 DC E V m− ) and
obtained with thermal poling. Such work provides a new interpretation of the sequence of mechanisms at play during fs DLW in our tailored glass.
2. Experimental method
2.1. Glass sample & DLW setup
Our tailored glass was a silver-zinc containing phosphate glass, with 5% of Ag2O, classically
prepared as reported elsewhere [6,13]. DLW was performed with a home-made nonlinear microscope as described elsewhere [5,7] (KGW:Yb oscillator, 5W, 10 MHz, 470 fs at 1030 nm, T-Pulse 500, Amplitude Systemes; a Mitutoyo objective APO PLAN IR, 100 × , NA 0.7; a high-precision 3D translation stage XMS-50 stages, Micro-Contrôle, 50 nm resolution). DLW was performed in the bulk at typically 160 microns below the surface, at fixed positions or by linearly moving the glass sample at controlled speed.
2.2. Correlative fluorescence and nonlinear SHG imaging setup
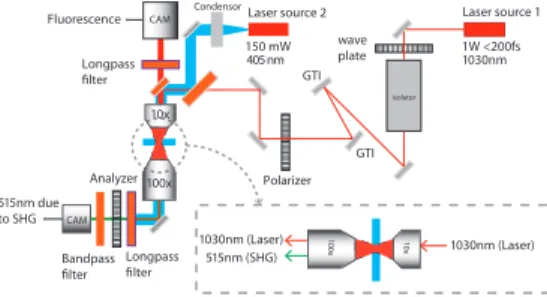
Another home-made nonlinear microscope was developed to perform the correlative study of both silver cluster fluorescence and EFISHG [13]. For the SHG, it included a femtosecond laser (KGW:Yb oscillator, 1W, 50 MHz, typically 200 fs at 1030 nm, T-Pulse 20, Amplitude Systemes), a wave plate and Faraday rotator to control laser irradiance, a Gires-Tournois interferometer (GTI) mirror pair to partially compensate the setup group velocity dispersion, a half-wave plate to control the incident polarization orientation, a loosely focusing objective to provide broad-field illumination and to prevent longitudinal polarization at the focus (Olympus, 10 × , NA 0.25). For the fluorescence, the excitation was performed with a 405 nm laser diode (100 mW). Both SHG and fluorescence signals were alternatively or simultaneously collected with a sharp collecting objective (Olympus, 100 × , NA 0.8) by imaging the illuminated laser-induced emitting structures onto a Peltier-cooled high-sensitivity 2D CCD camera (Hamamatsu C4742-95) mounted with a band-pass filter centered at 515 nm (20 nm bandwidth FWHM) and a long-pass filter (above 450 nm) for both SHG or fluorescence signals, as seen in Fig. 1. Such approach ensured that SHG and fluorescence are exactly collected in the same focal plane, preventing any chromatic artifact in the recorded spatial distributions of each property.
1030nm isolator wave plate GTI CAM Bandpass filter Longpass filter 1W <200fs 515nm due to SHG 10x 100x 10 x 100x 1030nm (Laser) 1030nm (Laser) 515nm (SHG) Laser source 1 GTI Polarizer Analyzer Laser source 2 150 mW 405 nm Longpass filter Condensor CAM Fluorescence
Fig. 1. Correlative microscopy setup for silver cluster fluorescence and EFISHG response.
3. Results and discussion
3.1. Topologies of laser-induced fluorescence and SHG patterns
For DLW performed at fixed position under TEM00 Gaussian-shaped laser beam, we observed
the creation of a fluorescent hollow pipe made of silver clusters, seen as a single fluorescent ring from the top (Fig. 2(a)), as previously reported [5,6,14]. SHG imaging also showed nonlinear patterns with cylindrical revolution symmetry, but with a significantly distinct spatial distribution since it was composed of a double-ring SHG structure (Figs. 2(b)-2(c)). Indeed, Fig. 2(b) demonstrates the EFISHG nature of the nonlinear four wave mixing process, thanks to polarization dependence analysis as reported elsewhere [12,13]. For an unpolarized
incident probe beam, we observed the complete SHG emission pattern with its radial distribution and its intrinsic cylindrical revolution symmetry. Finally, EFISHG spatial distribution remarkably differed from that reported in Choi et al. [12], where only one SHG ring was observed. Further research will explain if this comes from different DLW conditions (1.5 MHz versus MHz repetition rates), or from our better-spatially resolved imaging setup.
Fig. 2. DLW of an individual point with fixed sample (4.53 J.cm−2, 103 pulses), observed in the
plane perpendicular to light propagation: (a) single-ring fluorescence pattern; (b) and (c) double-ring EFISHG pattern, giving new insight with respect to previously reported EFISHG observation [12], for either horizontal linearly polarized or unpolarized incident fs near infrared (NIR) probe beam, respectively.
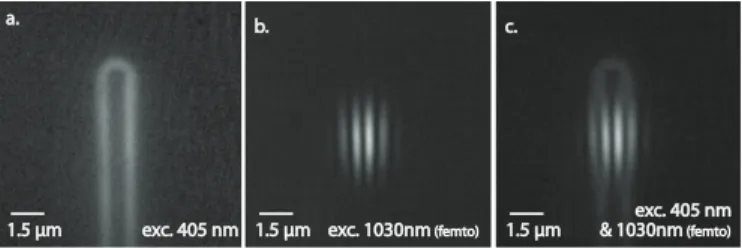
For DLW performed with linear sample translation of the sample under TEM00
Gaussian-shaped laser beam, we observed linear structures along the laser irradiation. Such linear structures differ from that obtained under fixed DLW position, but also differ between fluorescence and SHG signals. The single-ring fluorescent hollow pipe structure changes into a double-wall structure whose thickness corresponds to the nonlinear confocal parameter during the DLW process. This is in agreement with the fact that the edges of the writing beam create fluorescent clusters, while its center erases such objects and related fluorescent properties [14]. Correlatively, the double-ring EFISHG pattern under fixed DLW position turned into a four-line structure (Fig. 3(b)), also showing the typical 9:1 ratio dependence with polarization as detailed elsewhere (with an efficiency of 0.6 pm.V−1 and an exceptional
stability as long as thermal constraints remain below glass transition temperature) [13]. Note that Fig. 3(a) shows the whole linear fluorescent structure thanks to the spatially broad excitation of the fluorescent clusters. Figure 3(b) only partially shows the nonlinear structure since the SHG response is convolved with the incident laser irradiance profile. Simultaneously observed fluorescent and nonlinear structures showed correlated but distinct spatial distributions (Fig. 3(c)).
a.
1.5 μm exc. 405 nm 1.5 μm exc. 1030nm (femto)
b. c.
1.5 μm & 1030nm exc. 405 nm (femto)
Fig. 3. DLW of a single linear structure with sample translation (5.15 J.cm−2, 180 μm.s−1),
observed in the plane perpendicular to light propagation: (a) double-line fluorescence pattern; (b) four-line EFISHG pattern; and (c) both fluorescence & EFISHG spatially correlated patterns. Only the edges of the writing beam create structures, turning single/double rings at fixed DLW position into double-line/four-line structures under sample translation.
3.2. Spatial correlation between fluorescence and SHG laser-induced patterns
Detailed analysis of the spatial correlation between laser-induced fluorescence and SHG patterns was led on linear structures obtained under sample translation, since it allows an easier discussion. However, results can directly be extended to DLW at fixed positions (Fig. 2).
30 25 20 15 10 5 0 Intensity (a.u.) -4 -3 -2 -1 0 1 2 3 4 Width (µm) SHG lines Fluo lines a. -2 -1 0 1 2
Electric field amplitude (a.u.)
-4 -3 -2 -1 0 1 2 3 4 Tranverse profile (µm) -2 -1 0 1
Electric potential (a.u.)
b. Electric field Electric potential 12 10 8 6 4 2 0
Fluorescence intensity (a.u.)
-4 -3 -2 -1 0 1 2 3 4 Tranverse profile (µm) -2 -1 0 1
Electric potential (a.u.)
c.
Electric potential Fluorescence
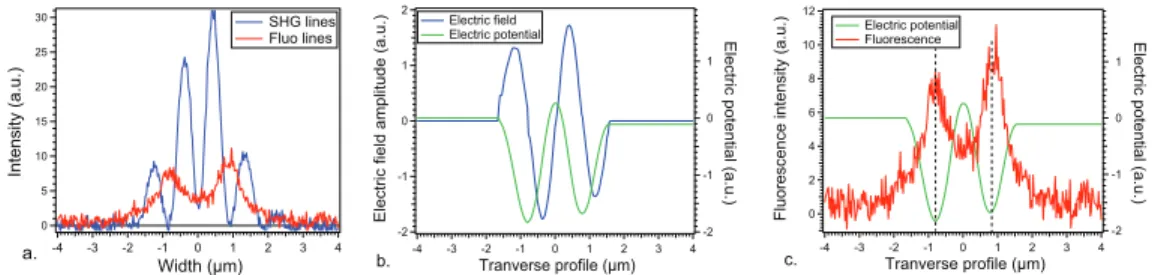
Fig. 4. Transverse spatial distributions: (a) fluorescence and EFISHG profiles, showing distinct but correlated topologies; (b) modeled buried static electric field from the EFISHG profiles, and associated electric potential modification; (c) spatial overlapping of fluorescence and electric potential profiles, demonstrating the co-localization of silver cluster stabilization and local reduction-oxidation condition modifications.
EFISHG and fluorescence signals were obtained by numerically integrating the associated images along the vertical direction, i.e. the translation direction. This provided smoothed horizontal cuts perpendicular to the translation direction. Figure 4(a) shows both the transverse spatial distribution of EFISHG and fluorescence signals. Note that the maxima of the fluorescence pattern were located exactly at the position of the zero EFISHG signal, showing clear anti-correlation between buried electric field and silver cluster spatial distributions. The modeling of EFISHG signal, by considering several imaging planes and solving the associated Poisson equation [13], led to the optimized spatial distribution of the electric field, as depicted in Fig. 4(b), where we also reported the spatial distribution of the associated electric potential VDC since EDC = −∇VDC. The absolute orientation of the
electric field and the related sign of electric potential are fixed under the hypothesis that most of the charge displacement is related to negatively charged species, namely mostly electrons being freed during DLW. Figure 4(c) repeats such electric potential spatial distribution, in direct relation with the local space charge separation distribution, and overlaps that of the fluorescent silver cluster, which provided here an excellent correlation.
3.3. Distinct EFISHG and fluorescence build-up processes versus DLW conditions
We performed fs DLW of linear structures with sample translations at eight different speeds (from 20 up to 300 μm.s−1) and four distinct fluencies (3.52, 3.99, 4.53 and 5.15 J.cm−2 while
the damage threshold was typically 5.55 J.cm−2 in our experimental conditions), typically
corresponding to the overlapped irradiation of 106 down to 0.66 × 10⁵ pulses. The EFISHG
signal starts to appear for a writing fluence above 3.5 J.cm−2, and is almost independently
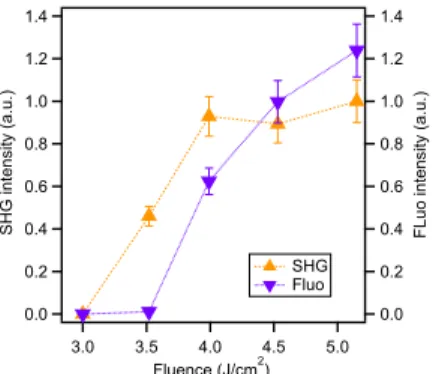
from to the writing speed and associated pulse number. Above this fluence, the EFISHG amplitude is very constant, depicted by a plateau region that corresponds to the local saturation of the buried electric field amplitude and related electric potential modifications (Fig. 5). On the contrary, the fluorescence signal amplitude depends both on the fluence and the writing speed. It starts to appear above a writing fluence of 4 J.cm−2, and does not reach a
plateau within the range of the experimental writing parameters. By comparing the growth of EFISHG and fluorescence amplitudes, we can conclude on a very distinct scheme of formation for space charge separation (probed by EFISHG) and silver clusters (probed by fluorescence).
1.4 1.4 1.2 1.2 1.0 1.0 0.8 0.8 0.6 0.6 0.4 0.4 0.2 0.2 0.0 0.0 SHG intensity (a.u.) 5.0 4.5 4.0 3.5 3.0 Fluence (J/cm2) SHG Fluo
FLuo intensity (a.u.)
Fig. 5. Correlative EFISHG and fluorescence relative intensities versus DLW incident fluence
for 1.1 × 10⁵ laser pulses (speed of 180 μm.s−1). EFISHG shows a threshold behavior between
3 and 3.5 J/cm2, a very steep increase followed by a plateau above 4 J/cm2 corresponding to the
saturation of the buried static electric field. Compared EFISHG and fluorescence signals show different build-up behaviors: EFISHG appears prior the fluorescence, demonstrating that the net space charge separation is not the consequence of the silver cluster existence, but rather the cause of the reduction/oxidation stabilization of such chemical species.
3.4. Breakthrough interpretation of DLW mechanisms for EFISHG & cluster fluorescence These observations provide a remarkable breakthrough in the understanding of the writing processes in these glasses. We previously thought that the DLW-induced production of silver clusters, associated to silver ion Ag+ and silver metal Ag0 diffusion, was leading to the
creation of a net space charge separation at the root of the EFISHG response [12]. Now, we provide the following interpretation: (i) the EFISHG signal appears for moderate irradiance conditions, even if the induced temperature increase does not significantly activate chemical species mobility, which corresponds thus to non-thermally driven diffusion; (ii) the EFISHG signal appears before any visible fluorescence, demonstrating the creation of a net space charge separation without cluster production (due to the initial absence of significant ion mobility); (iii) the net space charge separation thus results mainly from the entropic diffusion of free hot electrons followed by their subsequent trapping, resulting in electron migration and in the creation of a buried static electric field EDC, and in a modification of the spatial distribution of the associated electric potential VDC ; (iv) once it has reached its saturation amplitude, the spatial distribution of given favorable electric potential values are at the root of the subsequent localized chemical stabilization and growth of the silver clusters in such glassy matrix. Therefore, the silver cluster formation is thermally activated but mostly driven by the buried electric field and the chemical stabilization is associated to the local electric potential decrease, corresponding to more favorable oxido-reduction conditions in our tailored glass. Thanks to electron charge conservation, excluding any charge compensation at this stage, the electron diffusion should lead to a decrease of electronic density in the center of the irradiated structures. This might help to fix the sign of the electric potential modification and thus to fix the absolute orientation of the associated static electric field, as in Fig. 4. Further work is needed to confirm our interpretation, with chemical micro-probing to measure the final silver species distributions, as well as correlative time-resolved in situ experiments to probe both fluorescence and EFISHG build-up.
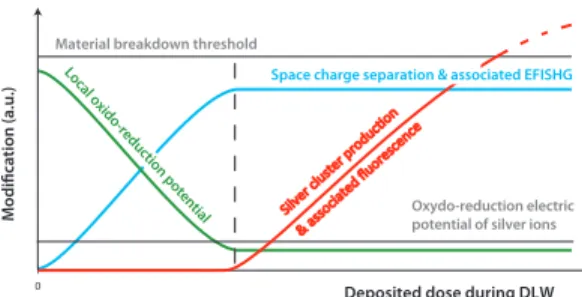
Figure 6 provides a sketch of the build-up behavior of both the space charge separation at the root of the EFISHG, its associated electric potential modification and the subsequent fluorescence, all these mechanisms and phenomena occurring below optical damage threshold.
Deposited dose during DLW 0
Oxydo-reduction electric potential of silver ions Material breakdown threshold
Modification (a.u.) Silver cluster produc Ɵon
Space charge separation & associated EFISHG
Local oxido-reduction potential
& associated fluorescence
Fig. 6. Sketch of build-up mechanisms, consisting first in a net space charge separation with a saturation plateau, subsequently followed by the growth and stabilization of silver fluorescent clusters with no visible saturation plateau here. We depict the electric field driven growth of silver clusters, and their reduction/oxidation stabilization with the associated electric potential.
4. Conclusion & perspectives
In this article, we have reported on the first detailed study of correlative microscopy for both silver cluster fluorescence and electric field induced second-harmonic generation that resulted from fs DLW. We have observed original topologies, namely single-ring fluorescent pattern and double-ring nonlinear SHG pattern for DLW under fixed position. DLW under sample translation led to distinct spatial distributions as double-line fluorescent pattern and surprisingly to a four-line nonlinear SHG pattern. Fluorescent silver cluster spatial distribution has been found to be anti-correlated with the buried static electric field but to properly match the associated laser-induced electric potential modulations. Fluorescent silver clusters appeared to be chemically stabilized under favorable reduction/oxidation laser-induced conditions: the local electric potential decrease leads to a locally more reductive behavior of our tailored glass.
The correlated study of the build-up behavior of both EFISHG and fluorescence has brought a significantly new interpretation on fluorescent silver cluster formation. EFISHG quickly reaches a plateau regime where the static electric field saturation behaves as the key parameter to subsequently launch the fluorescence signal production. Space charge separation appears thus first, and then permits the electric field assisted silver cluster growth and the electric potential stabilization under more reductive conditions. These new interpretations and understanding can be related to transient space charge separation in semiconductors under illumination [15], and should be considered for optimal buried electric engineering, in order to further fabricate linear fluorescent but also nonlinear 3D laser-induced functionalities.
Acknowledgments
This work was supported by the French Agency of National Research [Grant FELINS 2010 ANR BLAN 946 03], the French Aquitaine region [Grant FELINS REGION], and the group of scientific interest AMA GIS-LasINOF.