Direct laser writing of a new type of optical waveguides
and components in silver containing glasses
Thèse en cotutelle
Doctorat en physique
Alain Abou Khalil
Université Laval
Québec, Canada
Philosophiæ doctor (Ph. D.)
et
Université de Bordeaux
Talence, France
Direct Laser Writing of a new type of optical
waveguides and components in silver containing
glasses
Thèse en cotutelle
Département de Physique, génie physique et d’optique
Alain Abou Khalil
Sous la direction de :
Réal Vallée, directeur de recherche
Résumé
L'inscription laser directe est un domaine de recherche en croissance depuis ces deux dernières décennies, fournissant un moyen efficace et robuste pour inscrire directement des structures en trois dimensions (3D) dans des matériaux transparents tels que des verres en utilisant des impulsions laser femtosecondes. Cette technique présente de nombreux avantages par rapport à la technique de lithographie, qui se limite à la structuration en deux dimensions (2D) et implique de nombreuses étapes de fabrication. Cela rend la technique d’inscription laser directe bien adaptée aux nouveaux procédés de fabrication. Généralement, l’inscription laser dans les verres induit des changements physiques tels qu'un changement permanent de l'indice de réfraction localisé. Ces modifications ont été classées en trois types distincts:(type I, type II et type III). Dans ce travail, nous présentons un nouveau type de changement d'indice de réfraction, appelé type A qui est basé sur la création d’agrégats d'argent photo-induits. En effet, dans des verres dans lesquels sont incorporés des ions argent Ag+, lors de leur synthèse, l’inscription laser directe induit la création d’agrégats d’argent fluorescents Agmx+ au voisinage du voxel d’interaction. Ces agrégats modifient localement les propriétés optiques comme la fluorescence, la non-linéarité et la réponse plasmonique du verre. Ainsi, différents guides d'ondes, un séparateur de faisceau 50-50, ainsi que des coupleurs optiques ont été inscrits en se basant sur ce nouveau type A et complétement caractérisés. D'autre part, une étude comparative entre les deux types de guides d'ondes (type A et type I) est présentée, tout en montrant qu’en ajustant les paramètres laser, il est possible de déclencher soit le type I soit le type A. Enfin, en se basant sur des guides d’ondes de type A inscrits proche de la surface du verre, un capteur d'indice de réfraction hautement sensible a été inscrit dans une lame de verre de 1 cm de long. Ce capteur miniaturisé peut présenter deux fenêtres de détection d’indice, ce qui constitue une première mondiale. Les propriétés des guides d'ondes inscrits dans ces verres massifs ont été transposées à des fibres en forme de ruban, du même matériau contenant de l'argent. Les résultats obtenus dans ce travail de thèse ouvrent la voie à la fabrication de circuits intégrés en 3D et de capteurs à fibre basés sur des propriétés optiques originales inaccessibles avec des guides d’onde de type I standard.
Abstract
Direct Laser Writing (DLW) has been an exponentially growing research field during the last two decades, by providing an efficient and robust way to directly fabricate three dimensional (3D) structures in transparent materials such as glasses using femtosecond laser pulses. It exhibits many advantages over the lithography technique, which is mostly limited to two dimensional (2D) structuring and involves many fabrication steps. This competitive aspect makes the DLW technique suitable for future technological transfer to advanced industrial manufacturing. Generally, DLW in glasses induces physical changes such as permanent local refractive index modifications that have been classified under three distinct types: (Type I, Type II & Type III). In silver containing glasses with embedded silver ions Ag+, DLW induces the creation of fluorescent silver clusters Agmx+ at the vicinity of the interaction voxel. In this work, we present a new type of refractive index change, called type A occurring in the low pulse energy regime that is based on the creation of the photo-induced silver clusters allowing the creation of new linear and nonlinear optical waveguides in silver containing glasses. Various waveguides, a 50-50 Y beam splitter, as well as optical couplers, were written based on type A modification inside bulk glasses and further characterized. In addition, a comparitive study between type A and type I waveguides is presented, showing that finely tuning the laser parameters allows the creation of either type A or type I modifications inside silver containing glasses. Finally, based on type A near-surface waveguides, a highly sensitive refractive index sensor is created in a 1 cm glass chip, which could exhibit a pioneer demonstration of double sensing refractive ranges. The waveguiding properties observed and reported in the bulk of such silver containing glasses were transposed to ribbon shaped fibers of the same material. Those results pave the way towards the fabrication of 3D integrated circuits and fiber sensors with original fluorescent, nonlinear and plasmonic properties that are not accessible using the standard type I modification.
Table of contents
Résumé ... iii
Abstract ... iv
Table of contents ... v
List of tables ... vii
List of figures ... viii
List of Abbreviations ... xix
Acknowledgment ... xx
General Introduction ... 1
Chapter I General background on glass and laser-matter interaction ... 5
I.1. Introduction ... 5
I.2. Glass ... 6
I.2.1. Glass history ... 6
I.2.2. Definition of glass ... 6
I.2.3. Glass formation ...10
I.2.4. Glass making ...13
I.2.5. Introduction to fiber optics ...14
I.3. The laser ... 15
I.3.1. Definition of laser ...16
I.3.2. Gaussian beam ...19
I.3.3. Laser-material interaction ...22
I.3.4. Effects of laser parameters ...27
I.4. Conclusion ... 34
Chapter II Direct laser writing of a new type of waveguide in silver containing glasses ... 35
II.1. Introduction ... 35
II.2. Principle of DLW and ∆n classification ... 36
II.2.1. Type I modification origins ...38
II.3. State of the art: ... 39
II.3.1. Waveguides ...39
II.3.2. Depressed cladding waveguides ...45
II.3.3. Couplers: ...47
II.3.4. Beam splitters ...52
II.3.5. Waveguide Bragg grating (WBG) ...53
II.3.6. Waveguide lasers ...55
II.3.7. Photonic lantern ...56
II.3.8. Study of phosphate glasses ...57
II.4. Silver containing zinc phosphate glasses ... 59
II.4.1. Optical properties ...60
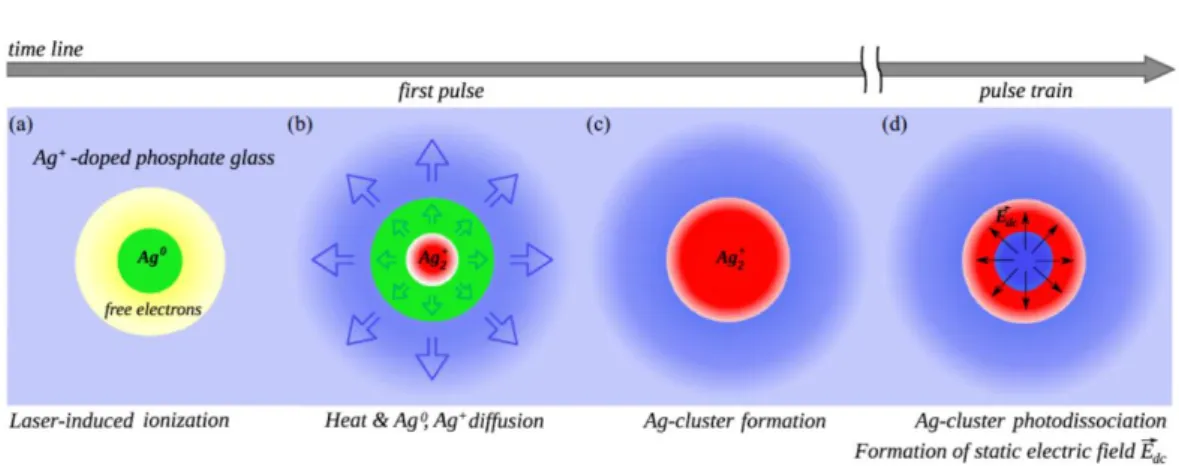
II.4.2. Laser-silver containing glasses interaction ...62
II.4.3. Writing window in silver containing glasses ...67
II.4.4. Review of previous works on silver containing glasses ...68
II.5. Experimental setup: Glass and laser used ... 70
II.5.1. Glass synthesis and fiber drawing ...70
II.5.2. Silver containing zinc phosphate glass fibers ...71
II.5.3. Laser setup: ...75
II.5.4. Mode profile setup: ...76
II.5.5. Confocal Microscope: ...77
II.6. Results ... 80
II.6.1. Structures’ morphology ...80
II.6.2. ∆n vs laser parameters ...82
II.6.3. Waveguiding ...91
II.6.4. Optical components ... 106
II.6.5. Waveguides in Ribbon Fibers ... 111
II.7. Conclusion ... 114
Chapter III Comparative study between the type A and the type I refractive index changes ... 115
III.1. Introduction ... 115
III.2. Type I modification in phosphate – zinc phosphate glasses ... 117
III.3. Experimental methods ... 117
III.3.1. Glasses ... 117
III.3.2. Laser setup ... 118
III.4. Results ... 119
III.4.1. Type I modification in silver containing and non-containing zinc phosphate glasses ... 119
III.4.2. Structure morphology ... 126
III.4.3. Refractive index and mode profiles ... 128
III.4.4. Flipping ∆n ... 131
III.4.5. Advantages of type A ... 137
III.5. Conclusion ... 139
Chapter IV Direct laser writing of rising near-surface waveguides in silver containing glasses with no additional processing ... 140
IV.1. Introduction ... 140
IV.2. Evanescent wave theory ... 142
IV.3. Evanescent wave based sensors ... 144
IV.3.1. Refractive index sensors ... 144
IV.4. Experimental methods ... 156
IV.4.1. Glass ... 156
IV.4.2. Laser setup ... 156
IV.5. Results ... 156
IV.5.1. Writing near surface waveguides ... 156
IV.5.2. RI sensor ... 166 IV.6. Conclusion ... 172 General Conclusion ... 173 Perspectives ... 175 Appendix ... 181 References ... 191
List of tables
Table II-1: Table summarizing the theoretical molar composition and the properties of the different zinc phosphate glasses used in this work. Taken from [135]. --- 59 Table II-2: Different silver (Ag) species identified following DLW in silver containing glasses as reported in [139]. --- 63 Table III-1: Table summarizing the different laser parameters for both lasers used in this chapter. --- 119 Table III-2: Table summarizing the comparison between type I and type A modification --- 138
List of figures
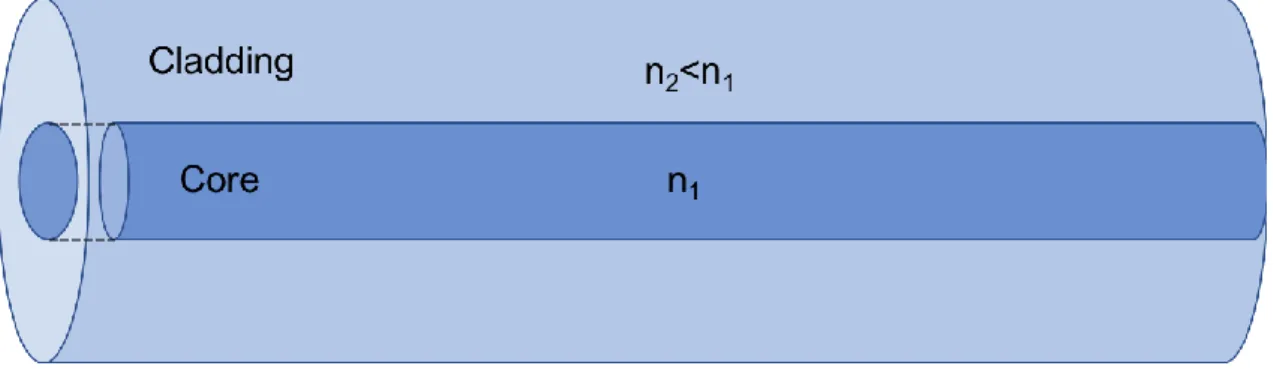
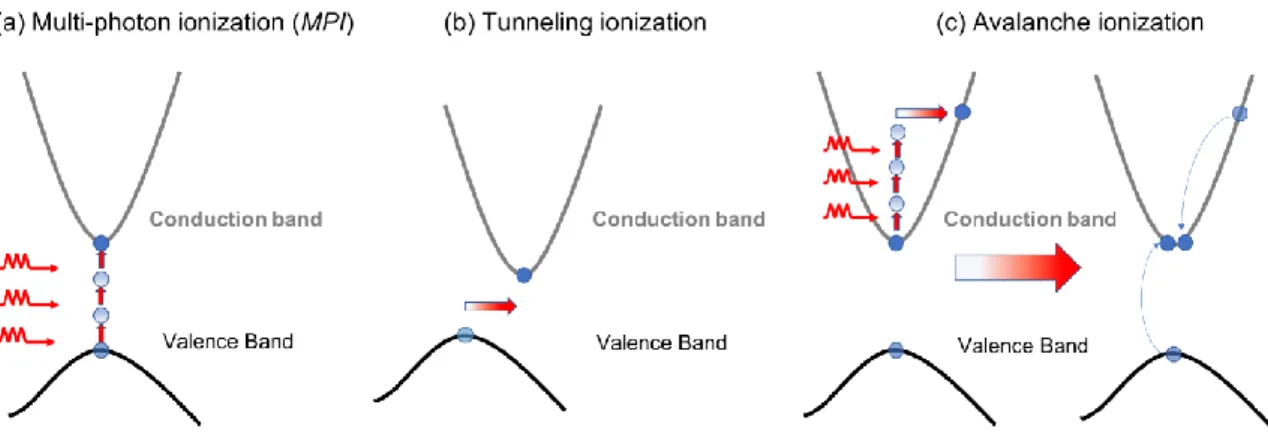
Figure I.1: The atomic arrangement of a A2O3 lattice of a (a) crystal (b) glass. The crystal exhibits atomic order compared to the disorder exhibited by the glass compound [5]. ... 7 Figure I.2: Volume variation as a function of the temperature while cooling a liquid to form a crystal or a glass. Adapted from [1]. ... 8 Figure I.3 The configurational entropy as a function of the temperature of the cooling process of an equilibrium liquid. The glass transition freezes the entropy and avoids a thermodynamic catastrophe. This is known as the Kauzmann paradox. Taken from [1] ... 9 Figure I.4 Possible Differential Scanning Calorimetry (DSC) curve of a cooled liquid. Tg is the glass transition temperature, Tx the temperature of formation of the first crystal, and Tc the crystallisation temperature. The DSC curve taken from [11]. ..10 Figure I.5 : Schematic presentation of an incident light on a glass sample. Io is the incident light, IR the reflected light, IA the light absorbed, IT the transmitted light and IS the scattered light. ...12 Figure I.6:Absorption spectrum of a Silica glass in the visible and near infrared region. A high transmission is shown in the visible range. ...13 Figure I.7: Schematic representation of the melting-quenching process...14 Figure I.8: Schematic presentation of a cylindrical optic fiber with inner core and outer cladding ...15 Figure I.9: Schematic presentation of a pulsed laser oscillator. ...17 Figure I.10: Schematic presentation of a laser beam (input beam) amplified using an external amplifier. Taken from [29]. ...18 Figure I.11: Intensity profile distribution of a Gaussian beam as function of r. ...20 Figure I.12: Schematic presentation of a propagating Gaussian beam. ...21 Figure I.13: Schematic presentation of the multi-photon absorption process. In this case, an electron in the valence band absorbs 3 photons to pass to the conduction band. ...22 Figure I.14: Schematic presentation of the photo-ionization processes during laser-glass interaction. (a) Multi-photon ionization (MPI): An electron absorbs two or more photons to be promoted in the conduction band (b) Tunneling ionization where the electron passes through a barrier to be promoted the conduction band (c) Avalanche ionization where an electron in the conduction band absorbs two or more photons, then collides and promotes an electron from valence band to the conduction band. Inspired from [34, 35]. ...23
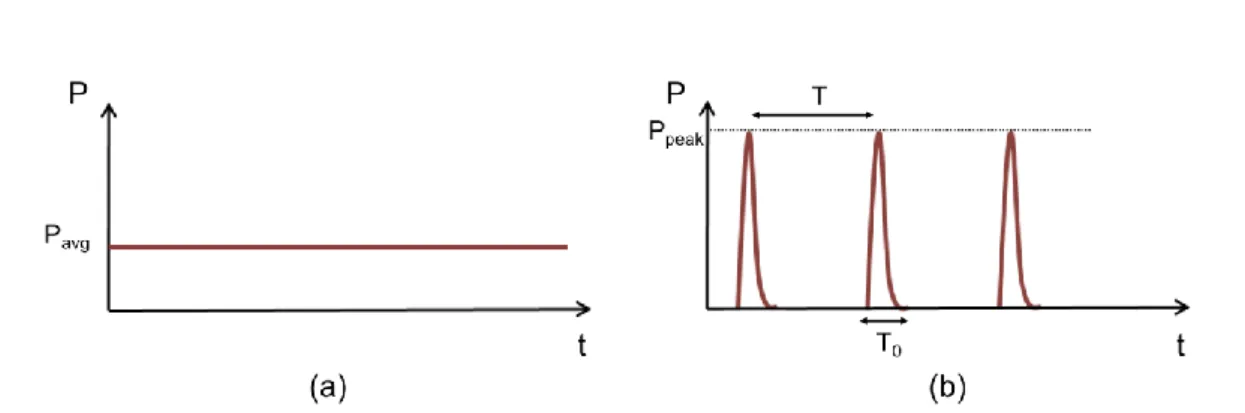
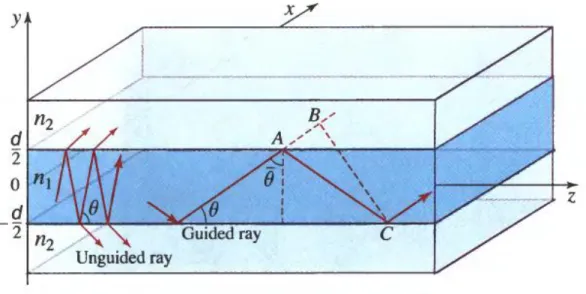
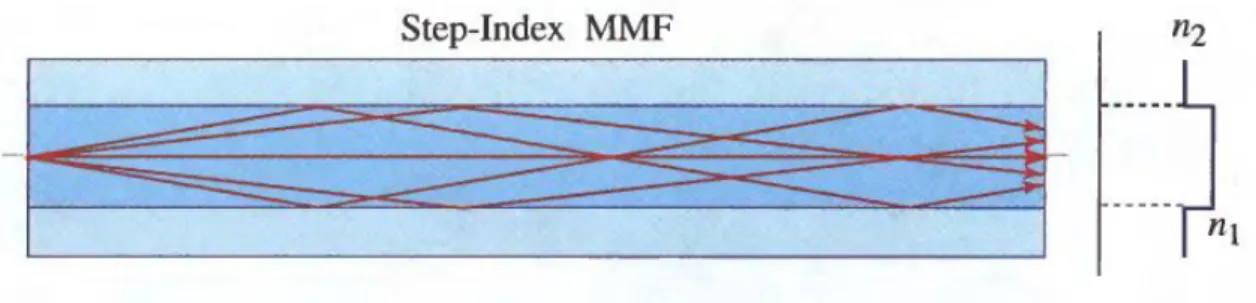
Figure I.15: (a) Scanning electron microscopy image of a track damage obtained by focusing femtosecond pulses inside fused silica (b) Numerical simulation electron density (c) Computed intensity counterplots. The comparison between experiment and simulations shows a good match of the morphology. Figure taken from [43]. .25 Figure I.16: Timeline of physical phenomena involved during laser-matter interaction. Inspired from [33]. ...26 Figure I.17: Schematic presentation of the temporal evolution of the power of a (a) continuous laser (b) pulsed laser. ...28 Figure I.18: Numerical simulations of the heat accumulation process inside glass following laser irradiation for different repetition rates, 100kHz, 500kHz and 1MHz. A heat accumulation process starts taking place at the 500kHz repetition rate [48]. ...30 Figure I.19: Comparison between athermal and thermal regimes. For the athermal regime, low repetition rate laser, the pulses are well spaced in time so that the temperature does not have time to build up in the material. However for the thermal regime, high repetition rate laser, the pulses are close in time and the temperature builds ups. ...31 Figure I.20: Modification threshold dependence as a function of the numerical aperture of the microscope objective used in borosilicate glass [54]. ...33 Figure II.1: Schematic presentation of the Direct Laser Writing (DLW) process. ....36 Figure II.2: Map of the modification thresholds in fused silica for the four regions/three types of modification as a function of the pulse energy and the numerical aperture. Adapted from [64]. ...37 Figure II.3: The refractive index changes/modification classified as function of the irradiance. Pictures for every type of modification, waveguides, nanogratings and voids. ...38 Figure II.4: Schematic of guided and unguided rays in a planar dielectric waveguide. The rays exhibiting a propagation angle 𝜃 lower than 𝑐 = 𝑐𝑜𝑠 − 1(𝑛2𝑛1) are only guided. Taken from [99]. ...41 Figure II.5: Graphical solution of (II-2) to determine propagation angles 𝜃 of the mode of a planar dielectric waveguide. (a)The right side (RHS) and left side (LHS) of the equation are plotted as a function of sin𝜃. The intersection points marked by filled circles determines the propagation angles 𝜃. On the other hand, each intersection of the tan function (LHS) corresponds to a mode. In this example, the waveguide can support up to 9 modes. Taken from [99]. (b) RHS (orange dashed line) and LHS (black full line) of (II-2) is plotted for a planar waveguide exhibiting a single mode aspect with ∆n=2x10⁻³, dimensions of 5µm at a wavelength of 630nm. ...43 Figure II.6: Schematic presentation of the way light rays propagate inside a multimode step-index optical fiber. Taken from [99]. ...44 Figure II.7: The acceptance angle 𝜃a of an optical fiber. The rays within the acceptance cone are guided inside the fiber by total internal reflection. The numerical aperture is given by: NA=sin𝜃𝑎. Taken from [99]. ...45
Figure II.8: (a) Top View phase contrast image of a type I waveguide written in silver containing zinc phosphate glass under white light illumination (b) Optical Path Difference (OPD) profile associated to the waveguide. A negative OPD is observed. ...46 Figure II.9: Tranverse view of a depressed cladding waveguide (DCW) (a) composed of 54 DCW distributed over 2 rings (b) composed of 212 DCW distributed over 4 rings. Taken from [101] ...47 Figure II.10: Schematic presentation of two close waveguides interacting along a distance “L” and separated by a distance “d”. The power is coupled between them. ...48 Figure II.11: Horizontal (squares) and Vertical (triangles) polarization transmission of laser written directional couplers as a function of the interaction length. First, the effect of the polarization is so slight, however when increasing the interaction distance, a bigger shift occurs indicating that the coupling effect could be altered based on the injected light polarization. Taken from [108]. ...50 Figure II.12: Schematic presentation of the first demonstration of a directional coupler presented by Strelstov et al [109]. ...51 Figure II.13: Schematic presentation of a 50-50 directional coupler. The light is injected in one branch and 50% of the power is coupled into the other branch. Taken from [110]. ...51 Figure II.14: (a) Schematic presentation of the 3D coupler (b) Mode profiles of the output indicating that the light is coupled in the three branches with a ratio of 43%:28%:29%. Taken from [111]. ...52 Figure II.15: (a) Schematic design of the 1 to 8 beam splitter with 7-Y junctions (b) Side view output of the far-field modes [113] ...53 Figure II.16: (a) Schematic presentation of the laser writing of the 1x3 beam splitter (b) Side view output visualization of the divided modes [114]. ...53 Figure II.17: Schematic presentation of the PointbyPoint (PbP) process of writing a Waveguide Bragg Grating (WBG) as well as a bright field image of the top view of the WBG. Taken from [101] ...54 Figure II.18: (a) Top view of the Waveguide Bragg Grating (WBG). The waveguide is indicated by the black lines (b) Reflection spectrum of the written WBG (upper curve) compared to the transmission of a normal waveguide (lower curve). Taken from [115]...55 Figure II.19: Sketch of a photonic lantern (PL) starting by a multimode rectangular waveguide separating into several single mode waveguides. Taken from [125]. ...56 Figure II.20: Side view bright field photos of the (a) 4x4 single mode waveguides (b) rectangular multimode waveguide. Output mode images of (c) the 4x4 single mode waveguides following the injection in the rectangular multimode waveguide (d) rectangular waveguide mode following the injection of light in the 4x4 single mode array waveguides. Taken from [125]. ...57
Figure II.21: Absorption coefficient as a function of the wavelength for zinc phosphate glass and silver containing zinc phosphate glasses with different silver concentrations. The silver containing glasses exhibit a higher absorption band and are shifted to higher wavelengths compared to non-containing zinc phosphate glass. Adapted from [11]. ...61 Figure II.22: Absorption as a function of the wavelength for the PZnAg2 sample from UV to IR. A good transparency window is observed between 380 nm and 2700 nm. ...61 Figure II.23: Schematic presentation of the formation of silver clusters in silver containing glasses following laser irradiation. ...62 Figure II.24: Absorption (black) of the photo-induced silver clusters following laser irradiation exhibiting two main absorption bands around 290 and 345 nm. Fluorescence emission (orange) under blue light excitation at 405 nm. ...63 Figure II.25: (a) Sketch of the morphology of the structures following static direct laser writing (DLW) (b) confocal fluorescence images under UV excitation (exc=405nm) of top view (xy) plane, ring shape (c) side view (xz) plane, two fluorescent lines in a pipe shape [136]. Schematic presentation of the writing process for (d) top view (xy) plane, photodissociation of the clusters in the middle (e) side view (xz) plane. ...64 Figure II.26: Scheme of the formation of silver clusters during laser-glass interaction in silver containing glasses. Taken from [140]. ...66 Figure II.27: (a) Fluorescence pattern of a written line under 405 nm excitation; (b) four-line of electric field induced second harmonic generation (EFISHG) under 1030 nm femtosecond laser excitation (c) superposition of the fluorescence and EFISHG correlated patterns under 405 nm and 1030 nm excitation. Taken from [143]...67 Figure II.28: Fluorescence intensity as a function of the laser irradiance and number of pulses for different laser repetition rates (a) 10MHz (b) 1MHz (c) 100kHz (d) 10kHz. Taken from [11]. ...68 Figure II.29: Top view under white light illumination for different lines written using a 250 kHz laser emitting at 1030 nm with a fixed pulse energy of 0.26 µJ for three different speeds from the left to the right: 10 mm/s-5 mm/s-1 mm/s. To be compared with figure 4 in [148]. ...70 Figure II.30: Zinc phosphate glass under UV excitation (a) non-containing (PZG-4N) and silver containing (PZG-2N2A) preforms. PZG-2N2A only exhibiting fluorescence emission; (b) fibers and a leftover of a preform. Taken from [149]. .72 Figure II.31: Comparison between bulk glass and fiber fluorescence emission properties (exc=245nm). A good match is found indicating that the drawing process preserved the glass properties. Taken from [149]. ...73 Figure II.32: (a) Thermal drawing of ribbon fibers. Preform, bottom-neck preform and drawn fibers under UV excitation (exc=245nm). (b) Sketch, longitudinal and side view of the drawn ribbon fiber. A flat surface with a rectangular side view is obtained. Taken from [149]. ...74 Figure II.33: Top view of the ribbon fiber (a) under white illumination before DLW (b) under UV excitation (exc=405 nm) following DLW. The fluorescence of the
written structures could be observed. (b) Fluorescence intensity broad band emission of the structures under UV excitation (exc=405 nm). (c) Fluorescence of the written cartography and the corresponding differential transmission spectra. A higher absorption band is observed for a higher laser irradiance. Taken from [149]. ...75 Figure II.34: Schematic of the laser setup used for direct laser writing. ...76 Figure II.35: Sketch of the SID4Bio wavefront sensor working principle. The incident beam is diffracted by the modified Hartmann Mask into four replicas making an interferogram on the sensor (CCD Camera) [155]. ...78 Figure II.36: Sketch of the light delayed by a refractive index object (n2) with a specific thickness “e” different than the surrounding medium (n1) leading to the construction of the phase image. The optical thickness i.e. optical path difference could be obtained [155]. ...78 Figure II.37: The SID4Bio installed on a transmission microscope. The light is diffracted by the grating creating the interferogram on the CCD camera giving an output of an intensity and phase image [155]. ...79 Figure II.38: (a) Schematic of the morphology of the structures following perpendicular translation to the laser beam propagation inside silver containing zinc phosphate glasses. Fluorescence confocal images of the (b.i) top view (xy) plane, and (c.i) side view (xz) plane. Schematic presentation of the writing process with (b.ii) top view and (c.ii) side view. ...81 Figure II.39: (a) Fluorescence image (ex=480nm, em=550nm) of the written cartography. Writing irradiances are presented along the vertical axis while the number of pulses appears along the horizontal axis (b) Blowup of the phase image under white light illumination of the B2 structure (c) positive refractive index change (∆n) determined from the phase image of B2. ...83 Figure II.40: (a) Phase image under white light illumination showing one line of phase shift; (b) Line profile obtained from the phase image revealing only one positive peak of optical path different in that case for the structures instead of two peaks; (c) left column: experimental silver cluster spatial distribution for a progressive scale of irradiances; right column: simulated distribution of the silver clusters. For (i) and (v) low laser irradiance is used and a full disk of fluorescence is observed, which is not the case for higher irradiances. Taken from [140] ...84 Figure II.41: Refractive index change variation (∆n) as a function of the number of pulses and laser irradiance. ∆n increases as a function of the laser parameters. Laser repetition rate 9.8 MHz. ...85 Figure II.42: Variation of the length of the structure along z as a function of the laser parameters, laser irradiance and writing speed. The dimensions increase as a function of the laser irradiance. Laser repetition rate 9.8 MHz. The shades correspond to the standard deviation of the values. ...86 Figure II.43: Top view phase image of different lines separated by 1 µm in the z plane. The seventh line becomes blurry indicating that the optical system is limited to around 6 µm in depth. ...87
Figure II.44: Refractive index change (∆n) as a function of the number of pulses for two methods: (orange) using the compensation method (black) fixed method where the depth of the structure higher than 6 µm is considered as 6 µm. Both methods converge more or less to the same values. The black shades correspond to the standard deviation of the values. ...88 Figure II.45: (a) High Resolution Scanning Electron Microscopy (HRSEM) image of the top view of a ring shape structure formed by silver clusters; (b) Line profile extracted from the HRSEM photo indicating a bump on the edges; (c) Atomic Force Microscopy (AFM) profile indicating no bumps on the sides. The bumps observed in the HRSEM are due to a change in the chemical composition and not to topological changes. Taken from [136]. ...89 Figure II.46: (a) fluorescence; (b) HRSEM, top view of the photo-induced structures. The fluorescence spatial distribution is correlated to the HRSEM indicating that the silver clusters are responsible for the change in the chemical composition. The scale bar is 1 µm. Taken from [136]. ...90 Figure II.47:(a) Silver clusters differential absorption spectrum as a function of the wavelength showing two main absorption bands near 290 nm and 350 nm; (b) Refractive index change (∆n) determined from the spectrum shown in (a) based on a Kramers-Kronig analysis, considering the filling factor of the silver clusters’ spatial distribution. DLW parameters: 7TW/cm2 – 40 µm/s. ...91 Figure II.48: (a) Schematic of the direct laser writing process and the laser injection; (b) Picture of the bulk sample under UV excitation (ex=405nm) highlighting the fluorescence of the waveguide (indicated by the white arrow); (c) fluorescence image of the side view of the waveguide under UV excitation (ex=405nm); (d) near-field guided mode profile following laser injection [149]. ..92 Figure II.49: Cross section view of fluorescence under UV side-excitation (exc=405nm) of (a) WG1, (e) WG2. Superimposed near field mode profile and fluorescence features for (b) WG1, (f) WG2. Near field mode profile for a high order propagating mode of (c) WG1, (g) WG2. Simulated mode profile using LUMERICAL for (d) WG1, (h) WG2. DLW parameters for WG1: 8 TW/cm2 – 10µm/s. For WG2: 8TW/cm2 – 20µm/s. ...94 Figure II.50: Near field mode profile following laser injection at 1.55 µm (a) fundamental mode, (b) higher order mode. The waveguide presented a multimode aspect. DLW parameters: 8TW/cm2 – 10 µm/s. ...95 Figure II.51: (a) Fluorescence confocal image of the side view of the waveguide. (b) Normalized horizontal fluorescence profile averaged along the y axis. (c) Normalized vertical fluorescence profile averaged along the z axis. ...96 Figure II.52: (a) Phase image of the top view of the waveguide under white illumination (b) Refractive index change (∆n) profile obtained from the phase image. DLW paramters: 9TW/cm2 – 60 µm/s. ...97 Figure II.53: Refractive index change (∆n) profile for different laser passages for an irradiance of 7 TW/cm2 and a speed of writing of (a) 50 µm/s, (b) 30 µm/s, (c) 20 µm/s. A negative ∆n dip appears for lower writing speeds and for many laser passages. ...98
Figure II.54: Superposition of the silver cluster fluorescence spatial distribution (black), normalized topology after chemical etching (red) and silver ions concentration distribution (blue). Taken from [141]. ...99 Figure II.55: The variation of the refractive index of the non-containing and silver containing zinc phosphate glasses as function of the silver concentration incorporated in the glass matrix. The higher the concentration of silver the higher the refractive index of the glass is (from bottom to top). Data from [135]. ... 100 Figure II.56: (a) Experimental: (a.i) Near field mode profile after injecting a 630 nm laser, (a.ii) normalized horizontal mode profile intensity averaged along the z axis, and (a.iii) normalized vertical mode profile intensity averaged along the y axis. (b) Simulations: (b.i) simulated mode profile (to compare with Figure II.56.a.i), (b.ii) normalized horizontal intensity mode profile averaged along the z axis (to compare with Figure II.56.a.ii), and (b.iii) normalized vertical mode profile intensity averaged along the y axis. ... 101 Figure II.57: Schematic model of the simulated waveguides using Lumerical Mode solutions software. The waveguides are simulated as two parallel ellipsoids with thickness “e”, with a length “z” and separated by a distance “d”. The color scale corresponds to the refractive index change. In this case, the glass refractive index change is 1.6 while the waveguide is 1.608 corresponding to a refractive index change (∆n) of 8x10⁻³. ... 102 Figure II.58: Spatial superposition of the measured refractive index profile (∆n) (black), simulated near-field mode profile (blue) and experimental near-field mode profile (red). A good match is observed between the simulated and experimental modes and the ∆n distribution... 103 Figure II.59: Variation of the minimum ∆n required to trigger the multimode aspect as a function of the thickness of the structures. Blue vertical line indicates the thickness measured by confocal microscope and used during simulations (~500nm) while the red line indicates the HRSEM measurement (~100nm) performed earlier in our group [139]. ... 104 Figure II.60: Fundamental near-field mode profile of a (a) multimode (MM) waveguide, (b) single mode (SM) waveguide. (c) Near-field mode profiles of the MM and SM waveguides. DLW parameters for SM: 9TW/cm2 – 60µm/s, for MM: 10.5TW/cm2 – 20µm/s. ... 106 Figure II.61: (a) Sketch of the Y-beam splitter dividing the input light into two equal outputs (top view), (b) top view fluorescence image of the Y-junction (ex=480nm, em=550nm), (c) output modes of the beam splitter (d) normalized intensity profile of the output modes indicating an almost equal splitting of light between both outputs. DLW parameters: 9TW/cm2 – 60µm/s. ... 107 Figure II.62: Sketch of the S-bend ... 108 Figure II.63: Normalized transmission of the S-bend waveguides as a function of the radius curvature Rc and the separation distance ∆h. Reversed injection data corresponds to backward injection in the S-bend waveguides. DLW parameters: 9.3TW/cm2 – 40µm/s. ... 109 Figure II.64: Sketch of the coupler consisting of straight and S-bend waveguides. ... 109
Figure II.65: Simulated and experimental normalized coupled power as a function of the separation distance between the two waveguides. DLW parameters: 9.3TW/cm2 – 40µm/s ... 110 Figure II.66: (a) Near-field mode profiles of the output of the coupler; (b) normalized intensity of the mode profiles indicating the creation of a 50-50 coupler. DLW parameters: 10.8 TW/cm2 – 40µm/s. ... 111 Figure II.67: (a) Cross-section view of the ribbon fiber with the guided mode in the middle; (b) blowup of the near-field mode profile; (c) horizontal mode profile; (d) vertical mode profile. The mode profile is similar to the mode profile in bulk glasses as shown in Figure II.56. DLW parameters: 10TW/cm2 – 25µm/s. ... 112 Figure III.1: Schematic presentation of the laser setup used for writing type I waveguides. ... 119 Figure III.2: Optical Path Difference (OPD) of the waveguide written in (orange) silver containing zinc phosphate glass (PZnAg2) and (black) non-containing silver zinc phosphate glass (PZn). ... 120 Figure III.3: Various optical path difference (OPD) profiles as a function of (a) writing speed (b) pulse energy. The ∆n flips from negative to positive when increasing the pulse energy or decreasing the writing speed. ... 122 Figure III.4:Optical path difference (OPD) profiles of type I modification in non-containing silver zinc phosphate glass as a function of the laser parameters. The ∆n is always positive. ... 124 Figure III.5: Optical Path Difference (OPD) of the waveguide written in the same conditions (Ep=1µJ - v=1mm/s) in (orange) silver containing zinc phosphate glass (PZnAg2) and (black) non-containing silver zinc phosphate glass (PZn). ... 126 Figure III.6: Top view white light illumination (a.i) for type I waveguide, (b.i) for typical type A waveguide. Top view fluorescence (a.ii) for type I waveguide, (b.ii) for typical type A waveguide. Side view white light illumination (a.iii) for type I waveguide, (b.iii) for typical type A waveguide. Side view fluorescence image of (a.iv) for type I waveguide, (b.iv) for typical type A waveguide. ... 128 Figure III.7 Top view phase image of (a.i) type I waveguide, (b.i) type A waveguide. Refractive index profile of (a.ii) type I waveguide exhibiting one single positive ∆n peak. Inset: side view of the type I waveguide under white light illumination. (b.ii) Type A waveguide exhibiting two positive ∆n peaks. DLW conditions for type I: (Ep=0.65µJ - v=5mm/s – 𝜏𝑟𝑒𝑝=250 kHz - NA=0.55 – 160µm below the surface), type A (Ep=43nJ- v=60µm/s – 𝜏𝑟𝑒𝑝=9.8MHz - NA=0.75 - 160µm below the surface). ... 129 Figure III.8: Near-field mode profile following the injection of a 630nm laser for (a.i) Type I waveguide (b.i) Type A waveguide. Normalized horizontal intensity of (a.ii) type I waveguide (b.ii) type A waveguide. Normalized vertical intensity of (a.iii) type I waveguide (b.iii) type A waveguide. DLW conditions for type I: (Ep=0.65µJ - v=5mm/s – 𝜏𝑟𝑒𝑝=250 kHz - NA=0.55 – 160µm below the surface),
Type A (Ep=43nJ- v=60µm/s – 𝜏𝑟𝑒𝑝=9.8MHz - NA=0.75 - 160µm below the surface). ... 131
Figure III.9: Optical path difference (OPD) profiles as a function of (a) laser irradiance (b) writing speed. The type A ∆n is always positive no matter what the laser conditions are. Pulse energies: 30 nJ 50 nJ. ... 132 Figure III.10: Side view of a type I waveguide exhibiting negative ∆n (a) under white light illumination; (b) fluorescence image under blue excitation and emission in the visible range; (c) guided mode profile following laser injection at 630 nm. The dashed lines indicates the location of the waveguide. A small portion of light is guided on the side of the waveguide. (d) Refractive index change profile of the waveguide exhibiting a negative one. DLW parameters: 0.65µJ-25mm/s. ... 134 Figure III.11: Laser parameters for both lasers: (orange) T-pulse 200 which induces type A modification (blue) Ti:Sapphire which induces type I modification (a) laser fluence, (b) laser irradiance, (c) calculated laser dose deposited as a function of the writing speed. ... 136 Figure III.12: Different types of modification classifications as a function of a progressive scale of the laser fluence. The introduction of the new type A modification sits below the standard well known type I modification. ... 137 Figure IV.1: Simulations of the confinement factor as a function of the V parameter of the fiber for an LP01 mode. The confinement of the mode increases as the V parameter increases. ... 143 Figure IV.2: Schematic presentation of an evanescent wave based sensor. ... 144 Figure IV.3: Schematic presentation of the sensor. Taken from [182]. ... 145 Figure IV.4: Variation of the optical transmission for different refractive index liquids for taper thickness of (1) ~1.6 µm (2) ~700 nm. Taken from [182]. ... 146 Figure IV.5: (a) Transverse cut of the plastic fiber. (b) Top view of the polished section. (c) Side view of the polished section. Due to the mismatch between the refractive index liquids and the fiber core, part of the beam is lost (2) by refraction in the sensing zone (3) guided by internal reflection. Taken from [183]. ... 146 Figure IV.6: Experimental and theoretical normalized transmission output as a function of the refractive index liquids. Taken from [183]. ... 149 Figure IV.7: Schematic presentation of the refractive index (RI) sensor. Inset: Sketch of the optical rays in the sensing region. The refracted light represented in a dashed line only occurs when the RI of the liquid is higher than the RI of the cladding. Taken from [169]. ... 151 Figure IV.8: Experimental and simulated normalized transmitted powers as a function of the refractive index of the liquids. The previous model of Bilro et al [183] is represented with a dashed line. Inset: Comparison between Lapointe’s model [169] and Bilro’s model [183]. Taken from [169]. ... 153 Figure IV.9: Side view of (a) (b) the near-surface waveguides written in soda lime glass. (d) Gorilla glass. (c) 25µm below the surface. Near field mode profiles of the waveguides in Gorilla glass. (e)(f) 25µm below the surface. (g)(h) Near-surface waveguide. Taken from [71] ... 154
Figure IV.10: Side view of the near surface waveguides using the compensation method compared to waveguides written ~150 µm below the surface without the glass cover in (a) fused silica (b) Eagle. Taken from [91]. ... 155 Figure IV.11: (a) Side view of near-surface waveguide using the compensation method and the guided mode profile following laser injection at =488 nm. (b) Fluorescence emission of an aqueous fluorescein solution excited by the evanescent wave of the light guided (=488 nm) in the near-near-surface waveguide observed through a band pass filter 528/38 (top view) (c) Dark field image of a linear periodic assembly of AG@SiO2@FITC nanowires (top view) (d) Fluorescence emission of AG@SiO2@FITC nanowires (top view). Taken from [197]. ... 156 Figure IV.12: Sketch of the rising near-surface waveguide. ... 157 Figure IV.13: Side view under white light illumination of (a) 32 µm straight waveguide (b)(c)(d) rising near-surface waveguides. (e) Top view under white light illumination of a portion of a near-surface waveguide. Smooth modifications where no ablations or mini explosions were observed. DLW parameters: 28 nJ – 50 µm/s. ... 159 Figure IV.14: (a) Side view of the rising near-surface waveguide NWG1 under while light illumination. (b) Near-field mode profile following the injection of a 660 nm laser. (c) Sketch of the simulation of the waveguide where ~1 µm of the waveguide is simulated outside the glass. (d) Simulated mode profile based on the simulations shown in (c). A good match between experimental and simulated modes showing that the mode is confined more towards the glass due to the glass-air interface. 160 Figure IV.15: (a) Side view of a rising near-surface waveguide under white light illumination. (b) Near-field mode profile following the injection of a 660 nm laser. (c) Sketch of the simulation of the waveguide 2 µm away from the surface. (d) Simulated mode profile based on the simulations shown in (c). A good match between experimental and simulated modes showing that the mode is not affected. ... 162 Figure IV.16: (a) Top view phase image of a portion of a waveguide neighboring the surface waveguides exhibiting smooth type A modification. (b) ∆n profile extracted from the phase image showing two positive peaks of ~2.4 x 10⁻³. DLW parameters: 28 nJ – 50 µm/s. ... 163 Figure IV.17: Normalized transmission for all written waveguides following the deposition of a ~4 mm droplet of 1.604 Cargile oil. No interaction was observed after 7 µm spacing between the waveguide and the surface. Inset: Near-field mode profile of the most sensitive waveguide at ~2 µm below the surface. DLW parameters: 28 nJ – 50 µm/s. ... 165 Figure IV.18: Normalized transmission as a function of the size of the droplet of a 1.604 Cargille oil for two waveguides with different distances from the glass surface. The larger the droplet the higher the losses in transmission. ... 166 Figure IV.19: Normalized transmission as a function of different refractive index (RI) Cargille oils deposited on the glass surface for four different waveguides at different depths from the surface. DLW parameters: 28 nJ – 50 µm/s. ... 168
Figure IV.20: Experimental (full line) and simulations (dashed lines) for two different near surface waveguides at different distances from the surface. A good match between the experiment and the simulations. ... 170 Figure IV.21: Sketch of the evanescent wave/mode profile inside a near-surface waveguide for a refractive index (RI). (a) Lower than the cladding/glass; (b) higher than the cladding/glass; (c) equal to the cladding/glass. Inspired from [200]. Simulated mode profile for a (a.i) glass-air interface; (c.ii) glass-oil interface with a refractive index of oil matching the glass 𝑛𝑒𝑥𝑡~𝑛𝑔𝑙𝑎𝑠𝑠. ... 171
List of Abbreviations
DLW Direct Laser WritingCELIA CEntre des Lasers Intenses et ses Applications
ICMCB Institut de chimie de la matière condensée à Bordeaux COPL Centre d’optique, photonique et laser
SLAM Short Laser Pulses: Applications & Materials NPs Nanoparticles
DSC Differential Scanning Calorimetry
IR InfraRed
TIR Total Internal Reflection
VIs Visible
UV Ultra-Violet NIR Near InfraRed
MPI Multi Photon Ionization NA Numerical Aperture 3D Three Dimensions
2D Two Dimensions
∆n Refractive Index Change SLM Spatial Light Modulator
DWC Depressed Waveguide Cladding
WG Waveguide
WBG Waveguide Bragg Grating PbP Point by Point WGL Waveguide Laser DFB Distributed Feedback PL Photonic Lantern MM Multimode SM Single Mode
AOM Acousto-Optic Modulator OPD Optical Path Difference
QWLSI Quadri-Wave Lateral Shearing Interferometry DHM Digital Holographic Microscopy
TIE Transport Of Intensity
HRSEM High Resolution Scanning Electron Microscopy AFM Atomic Force Microscopy
FWHM Full Width Half Maximum
EFISHG Electric Field Induced Second Harmonic Generation LPG Long Period Grating
FBG Fiber Bragg Grating RI Refractive Index
Acknowledgment
This PhD has been completed between two labs in two different countries, France and Canada. These labs collaborating together under the umbrella of the Laboratoire International Associé (LIA) LUMAQ (Lumière Matiere Aquitaine Quebec). I would like to thank the directors of LUMAQ Thierry Cardinal and Younès Messaddeq as well as of the Centre des Lasers Intenses et ses Applications (CELIA), Philippe Balcou and Eric Mevel and the director of the Centre d’Optique, Photonique et Laser, Réal Vallée for accepting me as a member of their great labs.
I would like to thank also, Dr. Bertrand Poumellec, Dr. Shane Eaton, Prof Younès Messaddeq and Dr. Mathieu Bellec for accepting to take part in my PhD jury. It was an honor for me.
To my PhD supervisors, Prof. Lionel Canioni, Prof. Réal Vallée and Dr. Yannick Petit, special thanks for choosing me for this PhD. Thank you for your support, understanding and help during the most difficult time of the PhD. Prof. Lionel Canioni, you were a real mentor during my PhD and also my personal life. I really appreciated all the discussions we had, related or not related to the PhD project. Thank you for the huge amount of trust you put in me. I also enjoyed travelling to several conferences with you. I am grateful for your contribution in teaching me new things and introducing me to the scientific community. Prof. Réal Vallée, I have always admired your way of engaging me in lab meetings so I could give more, work more and get better results. Yes, you are a picky person in science but I love that because I think it is a good quality for a scientist and it made me a better scientist. It was a pleasure to work for you, in your lab. Dr. Yannick Petit thank you for your friendly reception and the friendly environment you created during the course of the PhD. Thank you for following all of my work and for your constructive, critical remarks and observations. I learned a lot from you.
I also wish to thank all my colleagues in the SLAM group and COPL. Thank you all for your help and the good times we spent together. Being a part of the SLAM group is like being a part of a family and I really liked this atmosphere. Thank you to the SLAM (ex) colleagues/friends, EungJang Lee, Marie Vangheluwe, Brice Mutelet, Allu Amarnath Reddy, Arthur Le Camus, Sophie Rouzet, Délphine Syvilay, Wendwesen Gebremichael (Wendey), Laura Loi, Inka Mannek-Honninger and Bruno Bousquet. Thank you all for the great atmosphere we had in the lab and outside the
lab. Also thank you to Arnaud Royon for the interesting discussions about the PhD project. Thank you to my colleagues at ICMCB: Jean-Charles Desmoulin, Alexander Fargues, Sylvain Danto, Téa Skopak and Thierry Cardinal. Thank you to Jean-Charles Desmoulin and Sylvain Danto for providing glass samples, otherwise my project would not have been possible. Thank you for enduring my special demands! Téa Skopak, thank you for the discussions we had and for the time we spent talking. Special thanks and appreciation to Thierry Cardinal for all the financial support for my travels to Canada. Thanks also to my (ex) colleagues in COPL for the warm welcome and friendly environment: Mathieu Boivin, Cheikou Ba, Souleymane Toubou Bah, Fréderic Jobin, Frédéric Maes, JC Gauthier, Laurent Dusablon, Simon Duval, Yigit Ozan Aydin, Clément Frayssinous and Feng Liang. Thank you to Denis Boudreau, Alex Grégoire, Victor Azzi for the help and letting me use their equipment. Thank you also to Yannick Ledemi and Sandra Messadeq for the help. I would like to thank also Tigran Galstian for accepting me to assist him in his lab course. It gave me a great experience. Special thanks to Marc D’Auteuil, Stéphane Gagnon, David Hélie, Martin Blouin, Vincent Fortin and Diane Déziel. Marc, thank you for all you help in mounting my setups and finding the tools. I really appreciated the volleyball discussions we used to have. Stéphane, Stéphane... I asked you a lot of difficult and tricky tasks to do with my glasses during my PhD so thank you a lot for your help. Without your help and skills, it would have been nearly impossible for me to do it by my own. David and Diane, thank you a lot for the help provided for me before my arrival and to facilitate my arrival. Moreover, your friendly welcome is amazing and really appreciated. David thank you for the Québecois cultural introduction during the sugar shack. Martin Bernier, thank you for the warm welcome and the reputation you gave me at COPL (don’t ask about it). It was really a pleasure to get to know you in Rochester and dance, to interact with you in and outside the lab (on my farewell party). Thank you! Julien, it was a pleasure playing volleyball with you, I really enjoyed it. Now the two brothers I had at COPL, JP Bérubé and Jérôme Lapointe. Guys!!! It was really a pleasure to work with you and go out together for beer and pool. Jay (Jérôme), I will miss having a beer with you buddy, working late together at night and our paths crossing late in the lab. JP, thank you for answering all my emails almost every day for almost 2 years, following my daily work, giving advice and helping me with my work. Thank you for enduring my persisting character and correcting my papers/abstracts. I hope you are not bored now that I am not around anymore.
Also thank you to Céline, Sophie, Sonia, Cinthia, Michelle, Caroline and Carole from both universities for all the administrative help that you provided.
Of course, I would like to thank my funding sponsors, the French National Research Agency (ANR), “Investments for the Future” Idex program for the mobility grant, LAPHIA for funding the contract extension. From the Canadian side, I would like to thank the Natural Sciences and Engineering Research Council of Canada (NSERC) (CG101779), Canada Foundation for Innovation (CFI) (GF072345), and Fonds de Recherche du Québec-Nature et Technologies (FQRNT) (FT097991, CO201310) for their funding and for the equipment bought and used during this project.
On a personal note, I would like to dedicate this PhD to my parents. I would like to thank my friends from France and Canada who supported and helped me during this PhD: Christelle, Georges, Jean-Baptiste, Clément, Linh, Diaa. To the close friends, Vittorio, Jack and Georges thank you. Vittorio, I will miss our trips together man. Arthur Bagramyan: Thank you for having me as your friend and being like family in Québec. We had awesome memories together. And Joyce, it was a pleasure meeting you from the first day I arrived to the lab and I am lucky to have you as a friend. That’s enough for you. A person who stood by me, he calls himself “the sun”, thank you very much. You helped a lot. I appreciate it.
General Introduction
Laser-matter interaction has challenged the scientific communities since the discovery of the laser in the 1960s. Research and development through the past years led to almost a limitless number of industrial and medical laser-based applications. Ranging from laser cleaning, cutting, welding, marking to laser-eye surgery, ablating cancer tumours, medical imaging, the laser provides a versatile and non-replaceable tool in both the industrial and medical fields. More specifically, laser-glass interaction has been extensively studied during the last two decades. The process of focusing femtosecond lasers inside glasses in order to change the physical-chemical properties of the glass is called Direct Laser Writing (DLW). DLW technique provides fast direct three-dimensional (3D) structuration of the glass allowing the creation of 3D optical components embedded inside transparent materials. It exhibits many advantages compared to the lithography technique which is limited to the two-dimensional (2D) structuring of materials and involve many steps, making DLW highly compatible with industrial manufacturing. Many applications could be based on the DLW technique such as the creation of miniaturized sensors and/or photonic components on glass chips. Indeed, for example, the DLW technique in glasses has led to the creation of Modular Photonics a company based in Australia selling glass based micro-chips processed by the DLW technique used for mode-selective applications, more specifically for astronomical needs.
This PhD was performed in a joint collaboration between University of Bordeaux, France and Université Laval in Québec, Canada in the framework of the Laboratoire International Associé (LIA) LUMAQ (Lumière Matière Aquitaine Québec). More specifically, it was carried out between three labs: Centre des Lasers Intenses et ses Applications (CELIA) and Institute of Chemistry of the Condensed Matter of Bordeaux (ICMCB) at University of Bordeaux, France and Centre d’Optique, Photonique et Laser (COPL) at Université Laval, Québec, Canada. It consisted in spending almost half the time of the PhD at each university while working on the same project which is a continuity of research activities conducted in the “Shortpulse Lasers: Applications and Materials” (SLAM) research group of my supervisor Lionel Canioni and the group “Chimie et photonique des matériaux oxide de fluores”, supervised by Thierry Cardinal at ICMCB. Previous work was based on optimizing and mastering the silver containing zinc phosphate glasses synthesis, investigating and understanding the exotic laser-glass process following DLW. Those activities led to the creation of “Argolight”, a spin-off company selling laser
structured glass slides allowing the fluorescence calibration of microscopes. Furthermore, NASA used one of Argolight’s products to equip the International Space Station microscope for the SpaceX SPX CRS 11 – Falcon 9.
While the previous works of the group on silver containing zinc phosphate glasses were mostly based on the investigation of the laser-glass response, this PhD project aims at creating and functionalizing of new type of optical components based on the creation of fluorescent silver clusters. In fact, silver containing zinc phosphate glasses are special and exotic glasses compared to the standard glasses used for DLW by the scientific community. The incorporation of silver ions inside the glass matrix allows exotic responses from the glass following DLW i.e. creation of silver clusters exhibiting properties such as fluorescence, nonlinearity and plasmon resonance. In particular, the project intends to create new types of optical components with properties that were not accessible in previous standard glasses. The first part of the project explains the standard laser-glass interaction that is mainly known by the scientific community as well as the state of the art of some optical components manufactured in glasses. Next, the exotic response of silver containing glasses following DLW is presented in detail with a theoretical model. The creation of a new type of waveguides and optical components in silver containing glasses are presented in detail. The second part consists in functionalizing the new type of waveguides and the creation of a refractive index sensor inside silver containing glasses.
More specifically, the first chapter of the project consists in introducing the glass and laser and presenting their history. The main laser-glass interaction processes are also explained in this chapter.
The second chapter is the main part of this manuscript. It takes into account the different types of modifications induced in glasses following DLW as well as a review of some previous works. Then, silver containing zinc phosphate glasses are introduced as well as the exotic laser-glass interaction they produce. Finally, the design, fabrication and characterization of optical components are presented in this chapter.
The third chapter consists of a comparison between the standard type I modification and the new type A modification reported in this manuscript. The
comparison takes into consideration the morphology, the refractive index changes and the near-field guided mode profile.
The fourth and last chapter consists in introducing the writing of near-surface waveguides that do not require any additional process as well as a presentation of a pioneer refractive index sensor exhibiting the advantages of type A modification.
Chapter I
General background on glass and
laser-matter interaction
I.1. Introduction
Laser-matter interaction is a broad research area with loosely defined boundaries. The laser is used to interact with different types of matter going from biological tissues, up to metals, dielectrics, plastics. It has become an essential tool in medical and industrial fields. In order to develop such effective and robust industrial tools, the study of the laser-matter process is prerequisite. The understanding of the effect of the laser on the matter and the physical-chemical phenomena that occur during this interaction is mandatory. Every material interacts with the laser irradiation in a specific way from the other. In this chapter, we will start by presenting glass material used in this work by walking through its history, the definition, the fabrication process and some other properties while the second part will introduce the history of the laser and its functionality.
Finally, the last part highlights the interaction between femtosecond lasers and glasses. This interaction highly depends on the type of laser used as well as on the glass properties. The different physical phenomena that occur following the interaction of femtosecond lasers with glasses will be presented in detail in order to understand the core of the laser-glass interaction.
I.2. Glass
I.2.1. Glass history
The oldest records of glass making are some clay tables dating from around 650 BC. They were not completely understandable as no dictionaries exist explaining the technical terms used back then (inspired from [1]). However, the oldest documented glass making record was around 1673-1676 by Ravenscroft. Then in AD 1612, Antonio Neri’s book “L’arte Vetraria”, appeared. It was the most influential one compared to other books. But still, this book contained recipes more than science due to the limited developments in chemistry. At that time, glass makers did not have the quality control on their powder materials. They probably depended on the taste of their powders given that sodium and potassium salts have different tastes as do carbonate chloride, sulphate and nitrate for example. Moreover, one should not forget the problems they had with furnaces. How to build one, how to maintain high temperature, how to control it and measure it. Nowadays, many industrial glass companies exist such as Corning, Saint-Gobain, Pilinkgton, Asahi Glass Co, etc. and they master the art of glass making.
I.2.2. Definition of glass
Many definitions have been proposed by scientists over the last two decades. In 1990, Elliot suggests that glasses are materials that do not present a long distance of atom periodicity like crystals and are an amorphous solid exhibiting a glass transition [2] . Zarzycki said that a glass is a non-crystalline solid exhibiting the phenomena of glass transition [1]. The glass is a solid presenting a structure of a liquid, non-crystalline solid or simply amorphous solid taking into consideration the atom disorder based on X-ray diffraction [3]. Finally, Shelby in 1997 said that the glass is an amorphous solid with the absence of atomic order at long distance while exhibiting a glass transition zone. Every material, inorganic, organic or metal formed by any technique presenting a glass transition is a glass [4]. So eventually, we can describe the glass as a super cooled liquid in a metastable condition exhibiting a glass transition region with atomic disorder. Compared to the atomic structure of crystals (Figure I.
1
.a), glass exhibits a non-organized atomic structure (Figure I.1
.b). Nowadays, we have many categories of glasses: oxide glasses, metallic glasses, fluorinated glasses, chalcogenide glasses and organic glasses. In this project, we will be working on oxide glasses, more specifically zinc phosphate glasses.Figure I.1: The atomic arrangement of a A2O3 lattice of a (a) crystal (b) glass. The
crystal exhibits atomic order compared to the disorder exhibited by the glass compound [5].
I.2.2.a. Glass transition
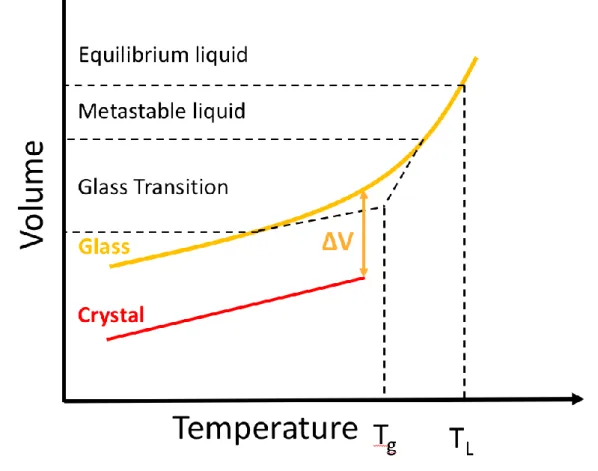
Earlier in this manuscript, the glass was defined as an amorphous solid exhibiting a glass transition phase. So, what is a glass transition phase? When a liquid is cooled below the melting temperature (TL) it enters the state of metastable liquid. Below TL, two options are possible: The cooled liquid could form a crystal or it could form a glass. If the thermodynamic barrier to nucleation occurs, the volume of the system sustains a drastic discontinuity of the volume ∆V and a crystal is formed as shown in Figure I.
2
. However, in the case of absence of nucleation, the liquid remains in a metastable equilibrium below TL with the same thermal contraction coefficient, without drastic change of the system’s volume. At a lower temperature than TL, the atomic mobility decreases and the atoms end up by being trapped in fixed positions. This occurs over a range of a temperature called the glass transition region and then the glass starts to form. Generally, the glass transition temperature (Tg) is the intersection of the extrapolated lines from the glass and metastable liquid ranges Figure I.2
.Figure I.2: Volume variation as a function of the temperature while cooling a liquid to form a crystal or a glass. Adapted from [1].
I.2.2.b. Thermodynamic aspect
Is the glass transition a phase transition? In order to answer this question, we will look into the thermodynamic aspects of the glass formation and the Kauzmann paradox [1]. But first let us introduce the entropy notion. The entropy (S) defines the disorder in the system. For instance, as mentioned before in section I.2.2, the crystal exhibits an organized atomic structure on a large scale, therefore the disorder is minimum implying a low entropy. However, for the glass, the atomic disorder is much greater, therefore we have a higher entropy than the crystal. Let’s consider again a hot liquid being cooled down to form a glass or a crystal. Kauzmann in 1948, noted that the configuration entropy of an equilibrium liquid decreases as a function of the temperature that if extrapolated below the temperature TK, it would fall below the crystal entropy (Figure I.
3
). That was not acceptable given that it does not fit with the third law of thermodynamics which states that the entropy of a crystal must be null at a temperature of 0K (S=0 T=0K). This disturbing phenomenon is stopped by a coincidental intervention of the kinetic phenomenon, the glass transition. The entropy freezes at a characteristic value of the equilibrium liquid at Tg as shown in Figure I.
3
. Moreover, the interval between Tk and Tg is generally quite small. The glass exhibits an entropy at 0K which is not the case for the crystal (Figure I.3
). This is the Kauzmann paradox. Grest and Cohen in 1981 tried to explain the glass transition as a first order phase transition [6], Gibbs and Dimarzio in 1958 suggested a second order phase transition [7] when Stillinger in 1988 proposed that no phase transition was happening [8]. Eventually, Stillinger was right. The glass transition is not a phase transition at all. It does not fulfil the Ehrenfest criteria for first or second order phase transition [9], contrary to the crystal where the cooling process of a liquid to form a crystal is considered as a phase transition from liquid to solid state.Figure I.3 The configurational entropy as a function of the temperature of the cooling process of an equilibrium liquid. The glass transition freezes the entropy
and avoids a thermodynamic catastrophe. This is known as the Kauzmann paradox. Taken from [1]
Given that the glass transition is characterized by a change in the heat capacity ∆Cp, it could be experimentally detected using the Differential Scanning Calorimetry (DSC). Comparing to another reference sample, the DSC output curve allows us to see the glass transition i.e. the differential heat capacity therefore detecting the glass transition temperature Tg. A DSC curve is shown in Figure I.
4
. The Tg can bedetected when the step change in heat capacity attains half the value of the total step change [10] (Figure I.
4
). Moreover, the DSC curve allows the detection of the temperature where the crystallisation effect starts at Tx and the peak of crystallisation at Tc. One should note that the Tg highly depends on the glass composition and its viscosity in the liquid state. Finally, in order to correctly measure Tg we should start by cooling the equilibrium state i.e. cooling the liquid [10].Figure I.4 Possible Differential Scanning Calorimetry (DSC) curve of a cooled liquid. Tg is the glass transition temperature, Tx the temperature of formation of
the first crystal, and Tc the crystallisation temperature. The DSC curve taken from [11].
I.2.3. Glass formation
After chemistry and physical chemistry were developed over the years, scientists started proposing criteria and formulas about glass formation instead of recipes based on tasting their powders to form glass. More specifically, in 1926 scientists proposed criteria for glass formation that may be applicable in some cases. This subject will not be discussed in detail in this manuscript. If readers are interested in this part, they may refer to the following readings [5, 12-15].
We will be interested only in oxide glasses since the glasses used in this work are oxide ones. In order to form a glass, scientists have classified the oxide glasses in three categories. Glass formers, modifiers and intermediates [5, 14].
Glassformers constitute the bone of the glass i.e. the main lattice and can usually
form a glass with ordinary lab techniques (melt-quenching). Examples are Ba2O3, SiO2, GeO2, P2O5, As2O5 etc. Normally these types of glasses exhibit a high melting temperature. Therefore glass modifiers are added in order to lower it. Modifiers do not form glass under normal conditions and are usually added to the glass to weaken the glass [14]. Examples of glass modifiers are Na2O, CaO or K2O.
Intermediates usually play a role between glassformers and modifiers. However,
they cannot make a glass by themselves. Examples of intermediate glass constituents are: Al2O3, ZnO, Ga2O3, TiO2.
I.2.3.a. Optical properties: Transparency window
The optical proprieties of a glass depend on the elements forming this glass, in other words the cations and ions used to form the glass. The optical transparency for glasses is directly linked to the absorption of the glass for different wavelengths (this part inspired by [1]). Let’s consider an incident light passing through a bulk glass. A quantity of light will be reflected, scattered, absorbed and the rest will be transmitted (Figure I.
5
). The coefficient of absorption is given by the Lambert-beer law as:𝐼 = 𝐼
𝑜𝑒
(−𝛼𝑙) (I-1)where I is the light transmitted, 𝐼0 the initial incident light, 𝛼 is the absorption
coefficient while l is the length of the sample as shown in Figure I.
5
. So, from (I-1)
we can express the absorption coefficient as:𝛼=−
1𝑙
ln (
𝐼𝐼0
)
(I-2)
Based on the transmission of the glass, the absorption coefficient could be calculated using (I-2
)
. It is recommended to represent the absorption of the glass using the absorption coefficient in cm-1 or dB/cm and not the transmission percentage. This gives more quantitative data about the transmission of the glass.Figure I.5 : Schematic presentation of an incident light on a glass sample. Io is
the incident light, IR the reflected light, IA the light absorbed, IT the transmitted
light and IS the scattered light.
The reflected light of one facet of a glass is known as the Fresnel reflection. The percentage of reflected light depends on the refractive index change of the material. For example, silver containing zinc phosphate glass used in this work with a refractive index change of n~1.6, Fresnel reflection is calculated to be around 5% using the following formula:
𝑅 = (
𝑛1−𝑛2 𝑛1+𝑛2)
2
(I-3)
where 𝑛2 in this case is the glass refractive index and 𝑛1 is equal to 1 which is the
refractive index of the air.
As mentioned before, the transparency window of the glass depends on its composition and the choice of glass network former and modifier molecules. Generally, standard oxide glasses exhibit a high transmission in the visible range and NIR but high absorption in the UV (Figure I.
6
). However, other type of glasses can exhibit a high transmission in the Infrared (IR) region and low transmission in the VIS such as chalcogenide [16]. Generally, the absorption in the UV range is linked to electronic transitions due to the absorption of an electron in the valenceband to be promoted in the conduction band. However, the absorption in the IR is linked to the molecular vibrations at this wavelength and the phonon energy [9].
Figure I.6:Absorption spectrum of a Silica glass in the visible and near infrared region. A high transmission is shown in the visible range.
I.2.4. Glass making
Making glasses could be performed by many techniques. It could be formed from plasma (evaporation), from liquid (quenching technique, sol-gel) or from solids (decomposition) [9]. In this framework, we will be interested in the melt-quenching technique which is used to form the glass. Two methods of melt-quenching techniques exist. The first one is the float glass which is an industrial technique used for the creation of large quantities of glass (which is not going to be presented herein) and the lab technique which is more of a “homemade” technique.
I.2.4.a. Lab technique
The lab technique used at ICMCB to make silver containing glasses is the melt-quenching technique shown in Figure I.