HAL Id: hal-03211896
https://hal.archives-ouvertes.fr/hal-03211896
Submitted on 29 Apr 2021
HAL is a multi-disciplinary open access
archive for the deposit and dissemination of sci-entific research documents, whether they are pub-lished or not. The documents may come from
L’archive ouverte pluridisciplinaire HAL, est destinée au dépôt et à la diffusion de documents scientifiques de niveau recherche, publiés ou non, émanant des établissements d’enseignement et de
Impact of Anthropogenic Sounds on Marine Mammals,
Monitoring Techniques and Application to the
Abysound Project
P Best, M Ferrari, H Glotin, M Poupard
To cite this version:
P Best, M Ferrari, H Glotin, M Poupard. Impact of Anthropogenic Sounds on Marine Mammals, Monitoring Techniques and Application to the Abysound Project. [Research Report] Université de toulon. 2019. �hal-03211896�
Livrable 2.4 : Impact of Anthropogenic
Sounds on Marine Mammals, Monitoring
Techniques and Application to the
Abysound Project
P. Best, M. Ferrari, H. Glotin, M. Poupard
July 2019
Research report, University of Toulon, DYNI team, LIS Laboratory, CNRS
Version N° Date Reviewers Writers
1 02/07/2019 P. Best, M. Ferrari, H. Glotin, M. Poupard P. Best, M. Ferrari, H. Glotin, M. Poupard
Contents
1 Introduction 5
2 Sound Pollution 7
2.1 Types of sound pollution sources . . . 7
2.2 Measuring the sound intensity . . . 8
2.2.1 Impulsive sounds (SPL) . . . 9
2.2.2 Non-impulsive sounds (cumulative SEL) . . . 9
2.3 Modelling areas of exposures . . . 9
2.3.1 Propagation models . . . 9 2.3.2 Fauna observation . . . 10 3 Fauna perturbation 11 3.1 Activity change . . . 11 3.2 Displacement . . . 12 3.3 Hear loss . . . 13
3.4 Occupation of the acoustic space . . . 16
3.5 Mitigation techniques . . . 16
3.5.1 Deterrent techniques . . . 16
3.5.2 Sound reduction . . . 16
4 Classic Monitoring 17 4.1 Purpose . . . 17
4.1.1 Dangerous sound pressure levels . . . 17
4.1.2 Presence, localization . . . 18
4.1.3 Classification . . . 19
4.2 Implementation . . . 19
4.2.1 Static Monitoring . . . 19
5 Abysound 22
5.1 MMPATF criterion selection . . . 22
5.2 Test areas . . . 23
5.2.1 St Tropez : North west Mediterranean sea IMMA . . . 23
5.2.2 Papuea New Guinea : Bismark sea IMMA . . . 24
5.3 Areas of mining as officialy planned by Nautilus Minerals . . . 26
5.3.1 Fidji Islands : VATU-I-RA IMMA . . . 26
5.3.2 Tonga : Tonga archipelago IMMA . . . 27
5.3.3 Solomon : Main Solomon Islands IMMA . . . 27
5.3.4 Other planned areas . . . 28
5.4 Presence of the marine mammals in the test and planned areas . . . 29
5.5 Potential consequences . . . 30
5.5.1 Displacement . . . 30
5.5.2 Hear Loss . . . 30
5.6 Test’s precautions . . . 31
1
Introduction
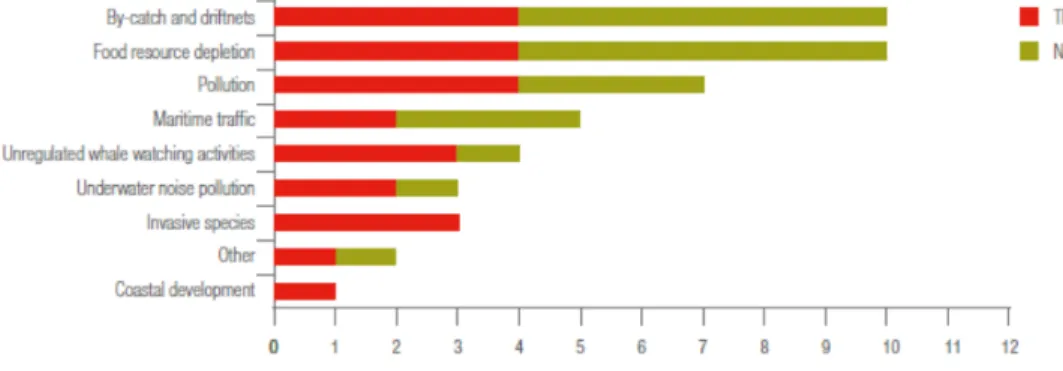
Anthropogenic underwater sounds are known today as a great source of disturbance for marine animals. Some of the numerous consequences of those disturbance can be seriously threatening to some species, as this graphic shows 1.1.
It is our responsibility to reduce this perturbation as much as possible, and it is only possible through the complete understanding of it, from the sources to the long-term effects on the fauna.
In this paper, we give a broad overview of maritime noise pollution. Starting with the study of the different sources of sound, we then study the many aspects of their consequences over several species. Since the monitoring of those perturbations is cru-cial to their understanding, we further describe classic (static) and mobile monitoring techniques. We then apply this knowledge to Abysound’s Nautilus Mineral case, by comparing the planned zones of mining with the presence of marine animals, and their relative importance according to the Marine Mammals Protected Areas Task Force.
2
Sound Pollution
Sound or noise pollution describes the anthropogenic underwater vibrations in gen-eral. Similarly to air pollution, human activity modifies the natural state of oceans and seas in many different ways. We focus here on the disturbance of the acoustic state for those environments.
2.1 Types of sound pollution sources
A broad range of human activities cause acoustic disturbance. We can divide those in three main categories :
• vessel traffic : freight and tourism boats use motors that emit vibrations under-water.
• sound exploration : used for underwater navigation (sonar) or seismic surveys (air-guns), sound is a powerful mean of getting information on your surround-ings, especially underwater (it is also broadly used by the marine mammals). • works : setting up structures (windmills, oil platforms...), mining, and other
many work on construction or destruction are conducted underwater, and are also source of powerful vibrations.
1.2
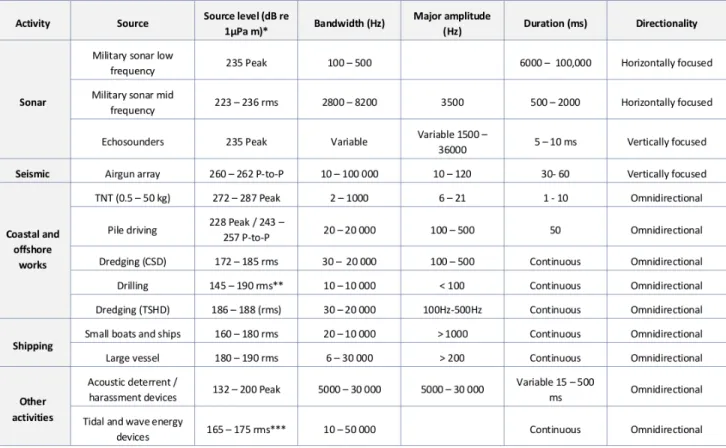
Figure 2.1:Overviewoftheacousticpropertiesofsomeanthropogenicsounds.*Nominalsource,**Highersource levelsfromdrillshipsuseofbowthrusters,***Projectionbasedonliteraturedatalevelsback-calculatedat1m.CSD= CutterSuctionDredger;TSHD=TrailingSuctionHopperDredger.16
2.2 Measuring the sound intensity For the following equations, with
p0 =1μPa (2.1)
we define the SEL as follows :
SEL = 10∗ log10( ∫ t1 t0 p(t)2 p2 0 dt) (2.2)
2.2.1 Impulsive sounds (SPL)
Impulsive sounds are typically transient, brief (less than 1 second), broadband, and consist of high peak sound pressure with rapid rise time and rapid decay2. For these sounds, the PK (Peak Sound Pressure Level) metric is preferable.
PK = max(SEL) (2.3)
2.2.2 Non-impulsive sounds (cumulative SEL)
Non-impulsive sounds can be broadband, narrow-band or tonal, brief or prolonged, continuous or intermittent, and typically do not have a high peak sound pressure with
rapid rise/decay time as impulsive sounds2. For these sounds, the SELcum (Cumulative
Sound Exposure Level) metric is preferable in most cases.
SELcum =10log10(Σ 24h 10
SEL
10 ) (2.4)
The SELcum metric takes into account both received level and duration of exposure3,
both factors that contribute to noise induced hearing loss (NIHL). Often this metric is normalized to a single sound exposure of one second.
2.3 Modelling areas of exposures 2.3.1 Propagation models
Sound intensity can be monitored at a certain point in space using hydrophones, but the measures are only relevant throughout a whole area, to measure the noise’s im-pact on a population of animals. For this purpose, instead of placing dozens of hy-drophones at different locations, sound propagation models can estimate the evolution of the sound intensity through space and time.
Nevertheless, the propagation of sound is highly dependant on numerous environ-mental parameters. The most important ones are the characteristics of the medium, and of the boundaries for the propagation space.
For the medium, the water density (depending on the depth) and saltiness are to take into account.
For the boundaries, the shapes (topography of the bottom, surface activity) and the physical characteristics (substrate of the bottom) are to take into account to accurately predict the behaviour of the sound against them.
Accounting some of those parameters, more or less sophisticated techniques exists to model the sound’s propagation, and thus the SEL by area.
One technique considered as a simple propagation model assumes a combination of spherical and cylindrical transmission losses to compute the SEL for an emission4.
A slightly more sophisticated model is the 2D ray-tracing model5 6. The ray method
is highly intuitive because the sound paths can be traced and show the path of each ray. Ray tracing is very efficient (fast). Once the rays are computed, the acoustic field levels are computed by summing the rays near the receiver7.
Many other types of models exist, taking into account more parameters, thus being more accurate but also heavier in computation.
Precise estimations of the SEL by area are needed when the location of the animals is well known and delineated. For rough estimations of the range of disturbance im-plied by a sound source, simpler models might be sufficient, but complex behaviours are to be acknowledged (e.x. sound propagating underground and resurfacing further because of topographic variations).
2.3.2 Fauna observation
A good approach for estimating the area of exposure from a sound source, instead of or in completion of propagation models, is actually monitoring the impact on the an-imals9. It is relatively easy to notice abnormal behaviours of animals next to noisy
ac-tivities (visual or passive acoustic monitoring), and it helps to get an idea of the area of exposure from one sound source.
3
Fauna perturbation
In this chapter we describe some of the numerous aspects of marine mammals’ life that are influenced by noise pollution, and the potential noxious consequences.
3.1 Activity change
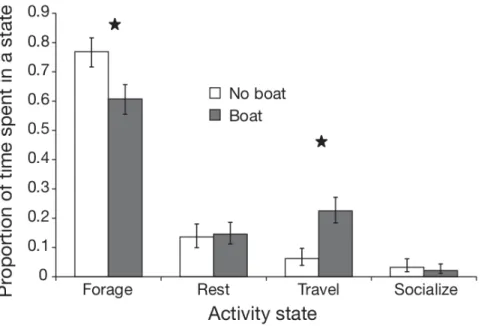
Several behavioural changes were studied on mammals exposed to sound pollution. One of the main sources of pollution studied is the vessel traffic. For bottlenose dol-phins for example, the presence of vessels implied longer inter-breath intervals, and quicker changes of heading, speed, and smaller inter-animal distances13. Those behaviours, demonstrate that the animals are actually trying to avoid the vessels. It is crucial to ac-knowledge that in this area of Sarasota bay Florida, vessels are encountered in an aver-age of 6 minutes intervals during day time. The dolphins’ ’natural’ activities are thus heavily disturbed. For killer whales, similar behaviours of fleeing boats have been mon-itored14. This fleeing activity implies changes in the overall time spent for each activity by the killer whales (see figure 3.1).
Again, with harbour porpoise, present in areas next to the construction of wind tur-bines : changes from normal activity (stationary, feeding) to traveling was monitored when exposed to the pile-driving sound8.
For any animal, having to flee boats or unfamiliar sounds for a significant amount of time implies less time for necessary activities like foraging or socializing. Spending less
Figure 3.1:Proportionoftimefocalkillerwhalesspentineachactivitystate(theiractivitybudget)dependingonthe presenceofboatswithin400mofthem,poolingacrossyearsandsites.Errorbarsare95%confidenceintervals.Black starsindicatedifferencesthataresignificantatthe0.05level14
foraging time could imply a smaller access to food which could be critically dangerous for the animals.
3.2 Displacement
As seen in the previous section, marine animals often flee unfamiliar noises. This phe-nomenon impacts their activity distribution, but also the habitat they evolve in. For pile-driving activities, the impact range goes up to 20km for harbor porpoise9. Vessel
traffic showed a long-term decrease of bottlenose dolphins population in the affected
regions10. Short term displacement of the animals might seem not dangerous for them,
and preventing potential hear losses or collisions. Although, the European commission stipulates :”A 24 hour time-period is too long if we want to make sure that we stay in the ‘no-effect’ range.”40. Indeed, as some species’ digestive system demands feeding many times per day, those animals rely on constant access to foraging areas. Thus, sev-eral hours of displacement can have sever impacts on their health.
Moreover, some construction works and other noisy activities might last a significant period of time, impeaching animals to evolve in potentially crucial areas like feeding or breeding zones. In this case, the displacement of the animals can have a heavily noxious
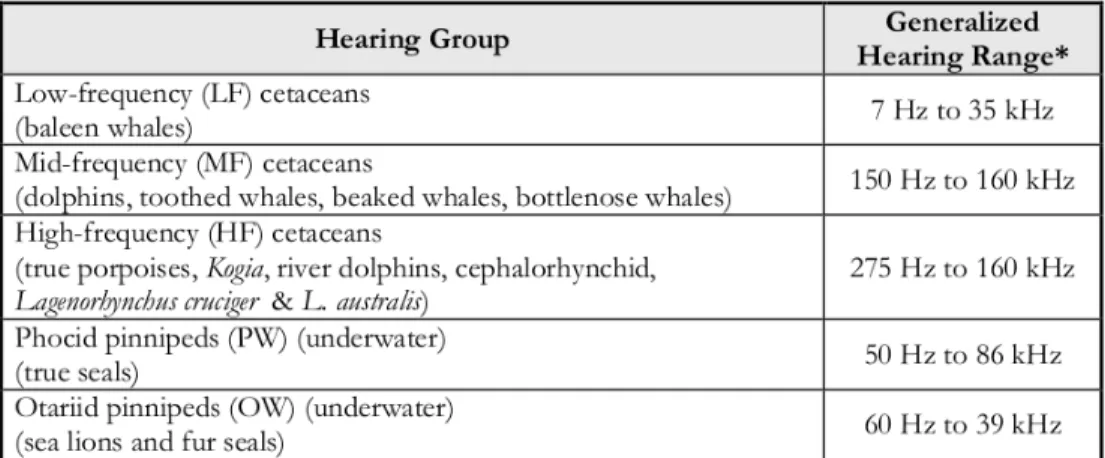
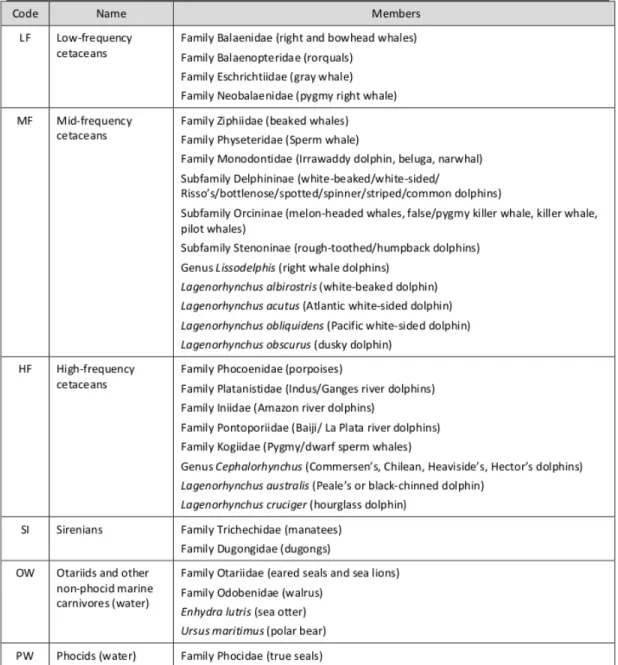
Figure 3.2:MarineMammalsHearingGroups2
impacts on the animals’ life. It is thus important to take into account if animals are dependant on a specific area or not to measure their displacement’s impact.
3.3 Hear loss
Hear loss in marine mammals has been observed as an effect of noise pollution un-derwater. They are sub-categorized as permanent threshold shift (PTS) or temporary threshold shift (TTS). Like for humans, the threshold shift describes an augmentation of the minimum sound level needed for the sound detection.
Studies2 have measured the sound level onset for PTS and TTS depending on the
hearing groups of the marine mammals. Several regulations exists depending on the country of application, with different methods for computing the SEL (cumulative
or not, weighted or not). This studie38 has benchmarked several regulations and their
computation method. We selected the National Marine Fisheries Service39 method since
it is more accurate (using species weighting function, animal’s movement and distance, and time of exposure).
The values of Figure 3.4 were computed using the Navy Phase 3 TTS exposure func-tions, defined with this equation17.
W(f) = C + 10log10( (ff 1) 2a (1 + (ff1)2)a(1 + (f f2) 2)b) (3.1)
Figure 3.4:SummaryofweightingfunctionparametersandTTS/PTSthresholds.SELthresholdsareindBre1µPa2s andpeakSPLthresholdsareindBre1µPa17.
Potential protective mechanisms against loud sounds have been observed among ma-rine mammals2. They consist of reducing hearing sensitivity (observed on false killer whales, belugas, bottlenose dolphins), turning heads (dolphins), or surfacing (long-finned pilot whales) when exposed to loud sounds. These natural protection instinct comforts the idea that high level sounds can be harmful to the animals.
Temporal and permanent threshold shifts have big impacts on marine mammals, as they rely on their auditory system for numerous aspects of their lives. First of all, com-munication between mammals (for socializing, organizing hunts and travels, and mating calls) can be impaired. Echo-localization, used among numerous marine mammals, also relies on hearing, and is necessary for navigation, finding prey, and avoiding collisions. Hear loss can impeach all of those crucial aspects of the marine mammals’ lives, and thus should be considered as a threat.
Moreover, studies18 found that with large, but recoverable noise-induced thresholds
shifts (maximum 40 dB TS measured by auditory brainstem response (ABR)), sound could cause delayed cochlear nerve degeneration in mice. Further studies19 reported a similar pattern of neural degeneration in mice after large but recoverable noise-induced TSs (maximum 50 dB TS measured by ABR), which suggests a common phenomenon in all mammals. The long-term consequences of this degeneration remain unclear.
3.4 Occupation of the acoustic space
Besides hear losses, the marine mammals’ activities that rely on sound can be impeached by the occupation of the acoustic space. Changes of the acoustic behaviour of bot-tlenose dolphins11, sperm whales, and belugas12 have been observed. Those changes were noticed as decreases of the rates of calls, and/or shift of frequencies used. Those behaviours are interpreted as adaptation techniques, against a noisy environment. Some animals have a free acoustic space (frequencies that the animal can use that aren’t in the ”polluting” noise) left at some frequencies and use it. Some other simply stop com-municating and foraging. Those effects can increase the energy expenditure and
de-crease food access and group cohesion15, which can be harmful for the populations in
the long-term.
3.5 Mitigation techniques
Several methods are used to reduce the impact of noise pollution on the marine fauna, among two main categories : deterring the animals’ presence, and reducing the sound propagation.
3.5.1 Deterrent techniques
Acoustic deterrence and harassment devices such as porpoise pingers or seal-scarers prior to loud sounds (e.x. pile-driving) serve to encourage the animals in moving away from the sound exposure area. Their efficiency can be compromised by two factors. In the first hand, some animals can get used to deterrent sounds, and thus not move away as expected. Secondly, some sound sources expose very large areas9, and the
displace-ment due to deterrents might not be sufficient to get away from the sound exposure.
3.5.2 Sound reduction
Sound reducing technologies for shipping, and coastal or offshore works are available. For shipping, improving the wake flow, and decreasing the cavitation shows reduced sound emission. For coastal and offshore works, bubble curtains, shells, cofferdams, or other sound dampers can be used16.
Sound reduction is usually a more reliable technique since it directly reduces the SPL, whereas deterrent methods might not move away the animals far enough or long enough.
4
Classic Monitoring
One of Abysound’s goal is to monitor the environmental impact of the noise emitted by offshore works. We list here necessary components to measure the actual noise dis-turbance on the local fauna.
4.1 Purpose
4.1.1 Dangerous sound pressure levels
Abysound’s system must detect sound exposure levels exceeding threshold shift onsets of marine mammals that could be around the offshore works. For that computation, not only SPL, but also duration and distance to potential receivers are necessary. Hav-ing those parameters, an alarm system could be built to warn the work operators of potential danger, so they could take action accordingly (temporary stopping the proce-dure, reducing the emitted noise if possible).
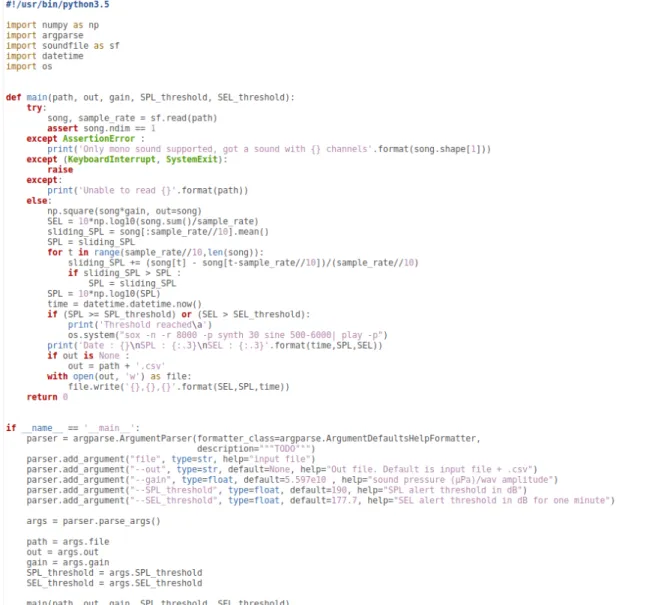
The DYNI team at the LIS lab of the University of Toulon has developped a pro-gram that detects and alerts if the SEL and SPL exceed a defined threshold.
Figure 4.1:ExceedingSPL/SELdetectionalgorithm(thisalgorithmisthepropertyoftheDYNIteamfromUniversityof Toulon)
4.1.2 Presence, localization
Besides monitoring the potential hear loss of nearby animals, it is important to measure the displacement of the animals, in terms of distance and duration. Indeed, especially in IMMAs, displacement of the animals could threaten whole populations of marine mammals. For this purpose, monitoring the animals localization and presence in the
designated zones has to occur. Moreover, animal presence monitoring is important to measure their potential exposure to high level sounds, and could help making decisions on activating mitigation techniques (dissuasive) Passive acoustic techniques for simple
presence detection9 exist and should be used. A more precise localization can be
per-formed using multiple hydrophones, and computing TDOAs35 34 (time difference of
arrival).
4.1.3 Classification
Classification of the detected animals in term of species is needed to compute their threshold shift onsets, and thus the risk of auditory impairment32 30 31.
4.2 Implementation
4.2.1 Static Monitoring
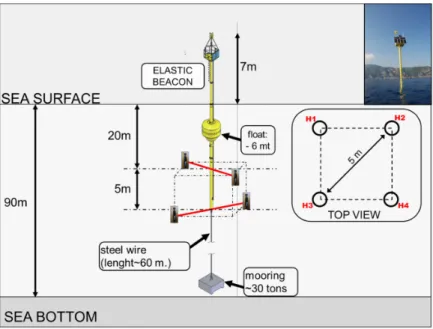
Static hydrophone arrays using underwater buoys provide stable recordings and ob-servations on foraging behavior,33 34 35 but can only monitor a fixed location, making it difficult to track animals over longer distances. In36, a permanent quadri-phonic sono-buoy array obtained a track of the animal in only 2 dimensions. A bottom-mounted array with small aperture (2 m) and high sampling rate was used for 3D localization of multiple whales37.
Figure 4.2:Exampleofastaticmonitoringantenna36
4.2.2 Mobile Monitoring
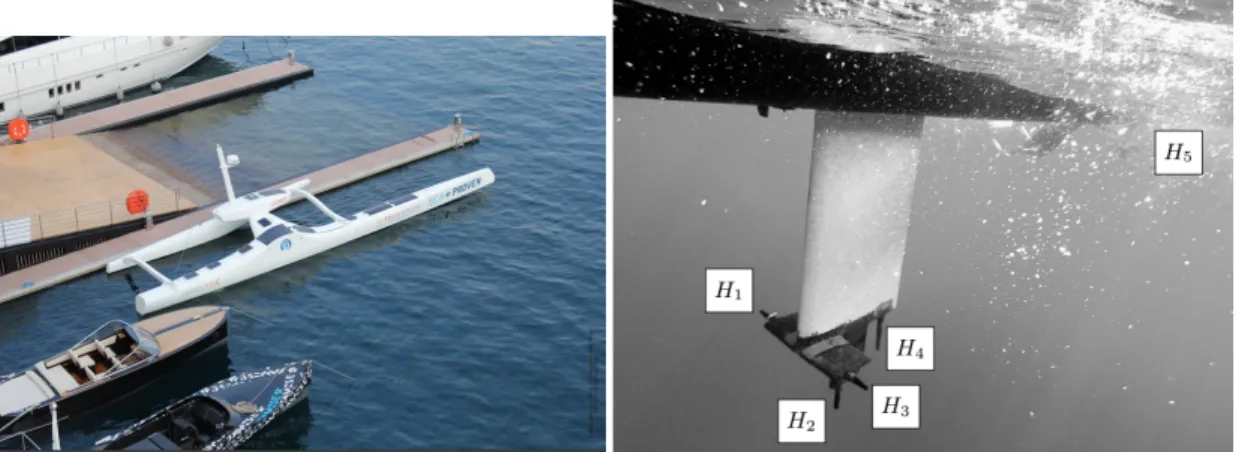
Recent studies29 demonstrate that we can obtain a high definition 3D track of deep
diving cetaceans from a five-channel, small-aperture hydrophone array on a moving au-tonomous surface vehicle (ASV), enabled by the vessel’s hydrodynamic quality and a high recording sample rate. Real-time processing is achieved by splitting a non-uniform array into two parts for time delay of arrival estimation. Resulting 3D tracks depict the behavior of the cetacean in the abyss (−1.2 km), with one position per second. This high resolution allows to observe a correlation between the repetition rate of the preda-tor’s biosonar and the tortuosity of its track.
5
Abysound
The main official source of knowledge for fauna presence and relative importance of areas is the Marine Mammals Protected Areas Task Force (MMPATF). The MMPAs Task Force was developed through the IUCN (International Union for Conservation of Nature) World Commission on Protected Areas (WCPA) and Species Survival Commis-sion (SSC), and through the International Committee on Marine Mammal Protected Areas (ICMMPA) to give a stronger voice to marine mammal needs within IUCN and to serve the larger marine mammal protected area community of practice. One of the works of the MMPATF is dertimining Important Marine Mammals Areas (IMMA) in the world’s oceans. IMMAs are defined as “discrete portions of habitat, important to marine mammal species, that have the potential to be delineated and managed for con-servation.” IMMAs consist of areas that deserve space-based protection and can be seen as a potential marine mammal layer for consideration by governments, intergovernmen-tal organisations, conservation groups, and the general public.
5.1 MMPATF criterion selection
The IMMA selection criteria27 are designed to capture many aspects of the biology,
ecology and population structure of marine mammals. These criteria are not hierarchi-cal in design but it is advised that prospective IMMAs are assessed sequentially in the given order. Therefore, any candidate need only satisfy one of the listed criteria and/or
sub-criteria to successfully qualify for IMMA status. Though they cover a range of im-portant attributes, and redundancies between them have been removed, there are some overlaps in the differing criteria that remain to assist assembled experts to identify IM-MAs efficiently from that evidence best available.
A Species or Population Vulnerability : Areas containing habitat important for the survival
and recovery of threatened and declining species
Bi Distribution and Abundance : Areas supporting at least one resident population,
contain-ing an important proportion of that species or population, that are occupied consistently
Bii Distribution and Abundance : Areas with underlying qualities that support important
concentrations of a species or population
Ci Key Life Cycle Activities : Areas that are important for a species or population to mate, give birth, and/or care for young until weaning
Cii Key Life Cycle Activities :Areas and conditions that provide an important nutritional base on which a species or population depends
Ciii Key Life Cycle Activities :Areas used for important migration or other movements,
of-ten connecting distinct life-cycle areas or the different parts of the year-round range of a non-migratory population
Di Special Attributes : Areas which sustain populations with important genetic, behavioural
or ecologically distinctive characteristics
Dii Special Attributes : Areas containing habitat that supports an important diversity of marine mammal species
5.2 Test areas
5.2.1 St Tropez : North west Mediterranean sea IMMA
Figure 5.1:Abysound’stestzone(redtriangle)insidetheImportantMarineMammalsAreaofthenorth-westM editer-raneansea23
The MMPATF’s summarized report23 on why and how this area is important to
nu-merous marine mammals : The North West Mediterranean has a set of geomorpholog-ical and oceanographic characteristics, including canyon systems and upwellings, which promote levels of productivity of extraordinary biological and ecological significance for the region. The Pelagos Sanctuary area, within the Provençal-Corsican-Ligurian Basin – complemented by an extension to the West encompassing the offshore por-tion of the Gulf of Lion to the Balearic sub-basin – contains habitat supporting a di-versity of cetacean species regularly found in the Mediterranean Sea. In particular, this area contains important habitat for Vulnerable Mediterranean fin whales (Balaenoptera physalus), Endangered sperm whales (Physeter macrocephalus), and Risso’s dolphins (Grampus griseus).
5.2.2 Papuea New Guinea : Bismark sea IMMA
Species with criterion A, Ci, Cii, and Dii are present in this area.
The Solwara 1 project area has been chosen for one of the two mining noise simula-tions. The area of the tests is part of the Bismark sea IMMA.
Figure 5.2:ImportantMarineMammalAreaofBismarkSea22
Figure 5.3:LocationofNautilusMineralsBismarkSeaProperty
The MMPATF’s summarized report22 on why and how this area is important to
numerous marine mammals : The Bismarck Sea of Papua New Guinea lies within the Indo-Pacific coral triangle, which is a global marine biodiversity hotspot. Con-sistent sightings of killer whales suggest that they are resident in Papua New Guinea, and the presence of calves and of feeding activity, have been recorded in the south of
the Bismarck Sea IMMA, especially in Kimbe Bay. Large aggregations of spinner dol-phins containing relatively high numbers of calves, and considerable numbers of sperm whales also occur in the Bismarck Sea. The significant species diversity of the area is underscored by the presence of six other cetacean species that have also been recorded. 5.3 Areas of mining as officialy planned by Nautilus Minerals
5.3.1 Fidji Islands : VATU-I-RA IMMA
Species with criterion A, Bi, Ci, Cii, and Dii are present in this area.
The MMPATF’s summarized report26 on why and how this area is important to
numerous marine mammals : The Vatu-i-Ra (ViR) IMMA is a tropical marine system stretching between the two main islands (Viti Levu and Vanua Levu) of Fiji. The ViR IMMA is comprised of a variety of habitats including healthy coral reefs in the coastal areas, a deep canyon, and dynamic and productive oceanographic processes. The ViR has been documented to provide critical resting habitat for spinner dolphins, as well as calving habitat and a migration route for Endangered Oceania humpback whales. The culturally important sperm whale is also present within the ViR although in numbers much reduced as compared to pre-whaling times. Other cetacean species confirmed across this area include the short-finned pilot whale, pantropical spotted dolphin, and false killer whale.
No planned zone of action of Nautilus Mineral has been found for the Fidji Islands. So it is not yet possible to see if the mining will actually occur within the Fidji IMMA. Although, it is worth noticing that the relatively small IMMA reported here lies among other potential IMMAs that suround the area.
5.3.2 Tonga : Tonga archipelago IMMA
Species with criterion A, Bii, Ci, and Di are present in this area.
The MMPATF’s summarized report25 on why and how this area is important to
nu-merous marine mammals : The Tongan Archipelago spans approximately 800 km from Niuafo’ou in the north to Eua in the south. Research has focused on the main island groups with concentrated efforts on humpback whales in the coastal waters that form their winter breeding grounds from August – November. There is natal site fidelity of humpback whales to the Tongan breeding grounds with distinctive mtDNA haplotypes for this area. Humpback whales and seven additional species of whale have been seen or acoustically detected within the Tongan Archipelago IMMA. Spinner dolphins are sighted year-round in Vava’u but no other delphinids are known to be resident despite sightings of nine additional species.
Figure 5.5:Left:IMMAoftheTongaarchipelago25.Right:ZonesofplannedminingbyNautilusMinerals.
The planned mining zones are located up to approximately 40km outside the Tonga IMMA.
5.3.3 Solomon : Main Solomon Islands IMMA
Figure 5.6:ImportantmarinemammalareaofthemainSolomonislands24
The MMPATF’s summarized report24 on why and how this area is important to
nu-merous marine mammals : The Main Solomon Islands IMMA includes coastal and off-shore waters located in the north-west part of the Solomon Islands, around the islands of Guadalcanal, Malaita, Santa Isabel and New Georgia. Overall, knowledge on marine mammal populations in the area remains scarce but a few dedicated surveys have high-lighted a high diversity of species (21) and this is an area of aggregation for Omura’s whales. Photo-identification and genetic data support the presence of small, resident, populations of coastal dolphins, that are genetically distinct from neighbouring popu-lations (spinner dolphins and Indo-pacific bottlenose dolphins). Finally, dugongs (Vul-nerable on the IUCN Red List) are widely distributed in the IMMA.
5.3.4 Other planned areas
New Zealand, Vanuatu islands, and the Clarion Clipperton Fracture Zone (CCZ) are located outside any IMMA as reported by the MMPATF. Nevertheless, the Vanuatu archipelago is now candidate for becoming an IMMA, moreover, not being classified as IMMA doesn’t mean marine mammals don’t inhabit the area, it just means it has not yet been observed as important to their survival. It is still our responsibility to impeach any harm to the animals inhabiting the mining areas.
5.4 Presence of the marine mammals in the test and planned areas The presence of marine mammals in the listed areas is summarized in table3.3.
s
Figure 5.7:Summaryofsimplepresence(notedasX)orMMPATFcriterionofmarinemammalsforeacharea(testor plannedformining).Hearinggroups3.3,andIUCNred-liststatusarealsospecified.
5.5 Potential consequences 5.5.1 Displacement
A lot of the mining or tests zones lie in critical areas for several species (see 5.7) As seen in chapter 3, short-term displacement of the animals exposed to abnormal noises is more than likely to occur. Acknowledging these elements demands that displacements of the animals occur in small enough surfaces and times to allow the animals to pursue their normal activity, without which their populations could be endangered.
5.5.2 Hear Loss Instantaneous SEL
For instantaneous exposures the noise emitted by the FPSO, the pumps, or the ground machines (considered as non-impulsive sounds) are below the PTS onset thresholds for marine mammals. Nevertheless, they are above the TTS thresholds for High frequency (HF) cetaceans. It is worth reminding that TTSs are not to neglect, as they can trigger dangerous long-term impacts on animals (see section 3.3).
Figure 5.8:FPSOandpumpnoisesoverlapwithTTSonsetsforH Fcetaceans(redrectangle)forinstantaneousexpo-sure(seeFigure3.3)
Cumulative SEL
Information on the mining procedure’s duration are lacking. We thus consider a con-stant SPL emitted by the pump, FPSO, and ground machines.
To get an idea of the potential cumulative exposures to the emitted sounds, we com-puted the SELcum2 for a receiver travelling as shown by the scheme 5.9, at a speed of
Figure 5.9:Potentialtravelofananimalnearthenoisesource
1m/s. Computing the transmission loss according to the distance21, and fitting a func-tion to the estimated pump sound 5.10, allowed us to estimate the received sound level for each position.
By accumulating the SELs through the whole travel, we get a SELcum as shown in 5.11.
This curve intersects the onset of HF cetaceans for TTS (153dB starting at 275Hz). Which means that with any closer distance passage, or a louder noise (also taking into account the FPSO and ground machines’ noises) would overlap with the TTS onsets of the HF cetaceans.
Those measures could be precised after running the tests, having the actual global sound exposure level maps. A good way of representing fauna perturbation around a powerful sound source is to draw borders around it, representing the range from which animals are subject to TTS or PTS 5.12
5.6 Test’s precautions
Similar noise simulations for monitoring the impact on the local fauna have occurred20.
From their experience, The sound’s simulation procedure (?which has not been detailed so far?) has to be set with care, since we don’t want any unrealistic frequencies to be introduced by amplification processes. Marine mammal’s impact will be relevant only if the sounds are strictly reproducing what will be emitted by the actual mining ma-chines, pumps, and FPSO.
Figure 5.10:Fittedfunctionforthepump’semittedsound
Figure 5.12:Visualizationmethodforhearlossrisks.Hereinblue,therangefromwhichanimalsaresubjecttoTTS, andinblack,therangeofpotentialPTS.38
6
Conclusion
The Abysound project can help the industries to monitor their acoustic impact on local marine mammals. For this purpose, measuring the emitted sound levels and the potential auditory damages of surrounding animals is important, but not sufficient. Indeed, the displacement of animals away from areas that are important to their well being (a.x. feeding / reproduction zones) can harm them critically. Technologies exist to automatically monitor the animals presence, localization, and activities, at relatively cheap costs. Abysound must gather and apply those techniques, and monitor the im-pact of sound on the surrounding animal’s activities, to fully complete its initial goal. For the Nautilus Mineral case, more data are needed for the scenarios, especially in terms of duration and periodicity. The tests are gonna provide more data on the emit-ted sounds and animal presence/reaction, which are gonna be useful for later studies.
For the ST Tropez tests end of april 2019, we proposed 6.1, a monitoring of the dis-placement of the animals using two static close to shore stations, combined with one
mobile station (drone29), or a similar antenna mounted on a Zodiak). Those static
and mobile stations would be sufficient to monitor the presence and activity of marine mammals (most probable in this area and time are several species of dolphins) before, during, and after the sound emissions. We would then be able to correlate the displace-ments and activity changes with the sound emissions.
References
[1] IUCN, “Marine mammals and sea turtles of the Mediterranean and Black Seas,” Gland, Switzerland and Malaga, Spain. IUCN, 2016, 32 p.
[2] National Marine Fisheries Service. 2016. Technical Guidance for Assessing the Ef-fects of Anthropogenic Sound on Marine Mammal Hearing: Underwater Acoustic Thresholds for Onset of Permanent and Temporary Threshold Shifts. U.S. Dept. of Commer., NOAA. NOAA Technical Memorandum NMFS-OPR-55, 178 p.
[3] ANSI (American National Standards Institute). 2013. Acoustic Terminology (ANSI S1.1-2013). New York: Acoustical Society of America.
[4] Evaluating the effect of seismic surveys on fish — the efficacy of different exposure metrics to explain disturbance, Nils Olav Handegard, Tron Vedul Tronstad, Jens Martin Hovem Canadian Journal of Fisheries and Aquatic Sciences, 2013, 70:1271-1277,
[5] Hovem, J.M. 2011. Ray trace modeling of underwater sound propaga-tion [online]. Documentapropaga-tion and use of the PlaneRay model. SIN-TEF A21539. Available from http://www.sintef.no/Publikasjoner-SINTEF/Publikasjon/?pubid=SINTEF+A21539.
[6] Tronstad, T.V., and Hovem, J.M. 2011. Model evaluation of Vesterålen and the Halten Bank [online]. SINTEF A17775. Available from http://www.sintef.no/ home/Publications/Publication/?pubid=SINTEF+A17775.
[7] Lian Wang, Kevin Heaney, Tanja Pangerc, Pete Theobald, Stephen Robinson, Michael Ainslie. (2014). Review of underwater acoustic propagation models. [8] Tougaard, J., Carstensen, J., Henriksen, O.D., Skov, H. and Teilmann, J. (2003):
Short-term effects of the construction of wind turbines on harbour porpoises at Horns Reef. Technical report to TechWise A/S. HME/362-02662, Hedeselskabet, Roskilde.
[9] Jakob Tougaard, Jacob Carstensen, and Jonas Teilmann (2009):Pile driving zone of responsiveness extends beyond 20 km for harbor porpoises (Phocoena phocoena (L.)). National Environmental Research Institute Aarhus University, Frederiks-borgvej 399, P.O. Box 358, DK-4000 Roskilde, Denmark
[10] Lars Bejder et al., Interpreting short-term behavioural responses to dis-turbance within a longitudinal perspective, Animal Behaviour (2006), doi:10.1016/j.anbehav.2006.04.003
[11] Luís, A. R., Couchinho, M. N. and Santos, M. E. (2014), Changes in the acoustic behavior of resident bottlenose dolphins near operating vessels. Mar Mam Sci, 30: 1417-1426. doi:10.1111/mms.12125
[12] Véronique Lesage, Cyrille Barrette, Michael Kingsley, Becky Sjare. (1999). The effect of vessel noise on the vocal behavior of Belugas in the St. Lawrence River estuary, Canada. Marine Mammal Science. 15. 65 - 84. 10.1111/j.1748-7692.1999.tb00782.x. [13] Nowacek, S. M., Wells, R. S. and SOLOW, A. R. (2001),Short-term effects of boats
traffic on bottlenose dolphins, tursiops truncatus, in Sarasota Bay, Florida. Marine Mammal Science, 17: 673-688. doi:10.1111/j.1748-7692.2001.tb01292.x
[14] Lusseau D , Bain DE , Williams R, Smith JC (2009) Vessel traffic disrupts the for-aging behavior of southern resident killer whales Orcinus orca. Endang Species Res 6:211-221. https://doi.org/10.3354/esr00154
[15] Tess Gridley, Simon H. Elwen, Gemma Rashley, Anja Badenas Krakauer, and Julia Heiler (2016) Bottlenose dolphins change their whistling characteristics in relation to vessel presence, surface behavior and group composition.
[16] ACCOBAMS (2013) Anthropogenic noise and marine mammals: review of the effort in addressing the impact of anthropogenic underwater noise in the AC-COBAMS and ASCOBANS areas.
[17] J.J. Finneran (2016) Auditory Weighting Functions and TTS/PTS Exposure Func-tions for Marine Mammals Exposed to Underwater Noise.
[18] Kujawa, S.G., and M.C. Liberman. 2009. Adding insult to injury: Cochlear nerve degeneration after “temporary” noise-induced hearing loss. The Journal of Neuro-science 29:14077-14085.
[19] Lin, H.W., A.C. Furman, S.G. Kujawa, and M.C. Liberman. 2011. Primary neural degeneration in the guinea pig cochlea after reversible noise-induced threshold shift. Journal of the Association for Research in Otolaryngology 12:605-616.
[20] Koschinski, Sven & Culik, Boris & Damsgaard Henriksen, O & Tregenza, Nick & M. Ellis, G & Jansen, Christoph & Kathe, Gunter. (2003). Behavioural Reactions of Free-Ranging Porpoises and Seals to the Noise of a Simulated 2 MW Wind Power Generator. Marine Ecology-progress Series - MAR ECOL-PROGR SER. 265. 263-273. 10.3354/meps265263.
[21] Yann Doh. Nouveaux modèles d’estimation monophone de distance et d’analyse parcimonieuse : Applications sur signaux transitoires et stationnaires bioacoustiques à l’échelle. Bio-informatique [qbio.QM]. Université de Toulon, 2014. Français. NNT : 2014TOUL0020. tel-01358281
[22] Bismark Sea IMMA, IMMA e-alias
https://www.marinemammalhabitat.org/portfolio-item/bismarck-sea/ [23] North West Mediterranean sea, slope and canyon system IMMA, IMMA
e-alias https://www.marinemammalhabitat.org/portfolio-item/north-western-mediterranean-sea-slope-canyon-system/
[24] Main Solomon Islands IMMA https://www.marinemammalhabitat.org/portfolio-item/main-solomon-islands/
[25] Tongan Archipelago IMMA https://www.marinemammalhabitat.org/portfolio-item/tongan-archipelago/
[26] Vatu-i-Ra IMMA https://www.marinemammalhabitat.org/portfolio-item/vatu-i-ra/
[27] MMPATF IMMA selection criterions
https://www.marinemammalhabitat.org/activities/immas/imma-criteria/ [28] Thode, Aaron. (2004). Tracking sperm whale (Physeter macrocephalus) dive
pro-files using a towed passive acoustic array. The Journal of the Acoustical Society of America. 116. 245-53. 10.1121/1.1758972.
[29] M. Poupard, M. Ferrari, J. Schlüter, R. Marxer, P. Giraudet, V. Barchasz, V. Giès, G. Pavan , H. Glotin (2017). Real-time passive acoustic 3D tracking of deep cetacean by small non-uniform mobile surface antenna.
[30] Glotin, H., Ricard, J., & Balestriero, R. (2017). Fast chirplet transform injects priors in deep learning of animal calls and speech. In Proceedings of the ICLR workshop [31] Glotin, LeCun, Mallat, Artières, Tchernichovski, Halkias, Proc. of the 1st wkp on
Neural Information Processing for Bioacoustics NIPS4B, joint to NIPS Alberta USA, Ed. 2013
[32] Glotin, Clark, LeCun, Dugan, Halkias, Sueur, Proc. of the 1st wkp on Machine Learning for bioacoustics, ICML4B, joint to ICML Atlanta USA, 2013
[33] Y. Simard and N. Roy, “Detection and localization of blue and fin whales from large-aperture autonomous hydrophone arrays: A case study from the St. Lawrence estuary,” Canadian Acoustics, vol. 36.1, no. 1, pp. 104–110, 2008.
[34] N. Roy, Y. Simard, and C. Gervaise, “3D tracking of foraging belugas from their clicks: Experiment from a coastal hydrophone array,” Applied Acoustics, vol. 71, no. 11, pp. 1050–1056, 2010.
[35] H. Glotin et al., “Bombyx stereophonic sonobuoy: a permanent survey of cetacean in Pelagos sanctuary,” Pelagos Research Report, 2017.
[36] M. Brunoldi, G. Bozzini, A. Casale, P. Corvisiero, D. Grosso, et al., “A permanent automated real-time passive acoustic monitoring system for bottlenose dolphin con-servation in the mediterranean sea,” PloS one, vol. 11, no. 1, pp. e0145362, 2016. [37] F. Bénard-Caudal, P. Giraudet, and H. Glotin, “Whale 3D monitoring using
astro-physic NEMO ONDE two meters wide platform with state optimal filtering by rao-blackwell monte carlo data association,” App. Acoustics, vol. 71, no. 11, pp.994–999, 2010.
[38] U. Stöber, F. Thomsen, ”Effect of impact pile driving noise on marine mammals: A comparison of different noise exposure criteria” The Journal of the Acoustical Society of America 145, 3252 (2019); doi: 10.1121/1.5109387.
[39] NMFS (2018). “Revisions to: Technical Guidance for Assessing the Effects of Anthropogenic Sound on Marine Mammal Hearing (Version 2.0): Underwater Thresholds for Onset of Permanent and Temporary Threshold Shifts,” Technical Memorandum No. NMFS-OPR-59 (U.S. Department of Commerce, NOAA, Silver Spring, MD), p. 167.
[40] Dekeling, R.P.A. et al. Monitoring Guidance for Underwater Noise in European Seas, Part III: Background Information and Annexes, JRC Scientific and Policy Re-port EUR 26556 EN, Publications Office of the European Union, Luxembourg, 2014, doi:10.2788/2808