RESEARCH OUTPUTS / RÉSULTATS DE RECHERCHE
Author(s) - Auteur(s) :
Publication date - Date de publication :
Permanent link - Permalien :
Rights / License - Licence de droit d’auteur :
Bibliothèque Universitaire Moretus Plantin
Institutional Repository - Research Portal
Dépôt Institutionnel - Portail de la Recherche
researchportal.unamur.be
University of Namur
Influence of nitrogen on the growth and luminescence of silicon nanocrystals
embedded in silica
Bolduc, M.; Genard, G.; Yedji, M.; Barba, D.; Martin, F.; Terwagne, G.; Ross, G.G.
Published in:Journal of Applied Physics DOI:
10.1063/1.3054561
Publication date: 2009
Document Version
Early version, also known as pre-print Link to publication
Citation for pulished version (HARVARD):
Bolduc, M, Genard, G, Yedji, M, Barba, D, Martin, F, Terwagne, G & Ross, GG 2009, 'Influence of nitrogen on the growth and luminescence of silicon nanocrystals embedded in silica', Journal of Applied Physics, vol. 105, no. 1. https://doi.org/10.1063/1.3054561
General rights
Copyright and moral rights for the publications made accessible in the public portal are retained by the authors and/or other copyright owners and it is a condition of accessing publications that users recognise and abide by the legal requirements associated with these rights. • Users may download and print one copy of any publication from the public portal for the purpose of private study or research. • You may not further distribute the material or use it for any profit-making activity or commercial gain
• You may freely distribute the URL identifying the publication in the public portal ?
Take down policy
If you believe that this document breaches copyright please contact us providing details, and we will remove access to the work immediately and investigate your claim.
Influence of nitrogen on the growth and luminescence of silicon
nanocrystals embedded in silica
M. Bolduc,1G. Genard,2M. Yedji,1D. Barba,1F. Martin,1G. Terwagne,2and G. G. Ross1,a兲
1
INRS-Énergie, Matériaux et Télécommunications, 1650, Blvd. Lionel-Boulet, Varennes, Québec J3X 1S2, Canada
2
Centre de Recherche en Physique de la Matière et du Rayonnement, Laboratoire d’Analyses par Réactions Nucléaires, University of Namur (FUNDP), 61 Rue de Bruxelles, B-5000 Namur, Belgium
共Received 6 June 2008; accepted 12 November 2008; published online 9 January 2009兲
Silicon nanocrystals 共Si-ncs兲 have been produced by implantation of Si+ in excess into SiO 2
followed by both annealing and passivation using argon or nitrogen. Nitrogen increases the photoluminescence 共PL兲 emission and shifts the spectra toward the blue. The measured Si-nc diameter is 4.3 and 3.8 nm after annealing performed under Ar and N2, respectively. A significant
quantity of nitrogen atoms has been detected in all samples by resonant nuclear reaction analysis 共RNRA兲. The nitrogen concentration is significantly higher when the annealing and passivation are performed in a nitrogen environment, in agreement with a larger Si–N vibration signal on the Raman spectra. The depth profiles of nitrogen are very similar to those of Si-nc, suggesting that the N2molecules may diffuse in the SiO2during the annealing and then are trapped in proximity to the
Si-nc. In addition to Si+, the implantation of N 2
+ to concentrations of 3 and 6 at. % produced a
decrease in the PL intensity共accentuated at the higher concentration兲 and an increase in the Raman signal associated to Si–N vibrations. These results suggest that a relatively low nitrogen atomic fraction enhances the PL emission, since a large nitrogen concentration impedes the formation of Si-nc thus significantly decreasing the PL intensity. © 2009 American Institute of Physics. 关DOI:10.1063/1.3054561兴
I. INTRODUCTION
Since the discovery by Canham1in 1990 showing that Si nanostructures can emit light at room temperature, there has been a considerable amount of interest on Si nanoclusters.2,3 Silicon nanometer-sized particles present unique optical properties, which are not observed in bulk materials. In par-ticular, once excited by photons, silicon nanocrystals共Si-nc兲 exhibit strong visible luminescence even at room tempera-ture. The Si-nc can be easily produced either by deposition of substoichiometric SiO2 layer or by ion implantation of
excess silicon in silicon oxide amorphous materials, fol-lowed by thermal annealing in an inert atmosphere.4–8 The light emission of Si-nc was attributed by some authors to a quantum confinement effect, but it is now considered that this model cannot explain all the reported experimental data9 and that the nature and the optical properties of the SiO2
where the Si-nc are formed can strongly affect the photolu-minescence 共PL兲 spectra.10 The physicochemical composi-tion of the SiO2layer surrounding the Si-nc plays an
impor-tant role in light emission and in optical gain. For example, the growth of substoichiometric SiO2 deposited layer is dif-ferent when N2O or O2, used as an oxidizing precursor gas, is mixed with the usual SiH4gas. Muloni et al.11performed physicochemical characterization of the deposited layers be-fore and after annealing at different temperatures. They in-vestigated the possible role of nitrogen in the Si-nc forma-tion. Using secondary ion mass spectrometry共SIMS兲, a large
quantity of nitrogen 共⬃15%兲 in the layer deposited with a SiH4– N2O gas mixture has been found even after annealing
at 1200 ° C. In this case, only a small nitrogen fraction was replaced at the surface by oxidizing oxygen. On the other hand, a smaller, but significant, quantity of nitrogen 共⬃2%– 3%兲 was detected in the layer deposited with a SiH4– O2gas
mixture only after annealing. X-ray photoelectron spectros-copy 共XPS兲 revealed that a larger concentration of Si–Si bonds is observed after annealing in the sample deposited with the O2 oxidizing precursor gas. According to these
au-thors, it seems that the presence of nitrogen inhibits the Si diffusion, thus influencing the Si-nc growth rate.
More recently, Wilkinson and Elliman12reported that the shape and intensity of the PL spectra emitted from Si-nc produced by ion implantation is strongly influenced by the choice of the annealing environment 共Ar, N2, or 5% H2 in
N2兲. Samples annealed in Ar exhibit a less intense redshifted PL spectrum. Raman spectroscopy measurements indicate that the annealing in N2gas reduces the Si-nc mean size due to the possible formation of a very thin oxinitride layer at the Si-nc/SiO2 interface. These authors concluded that these re-sults are consistent with the fact that the annealing in Ar or N2is a process of thermal relaxation. However, in the case of
N2, the compound formation arises through the diffusion of
ambient nitrogen into the oxide matrix. Unfortunately, there were no direct measurements of the nitrogen content in these Si-nc/SiO2 samples and no indication on a possible role of
nitrogen on the growth of Si-nc. Moreover, no value of the Si-nc diameter and size distribution was determined. The aim of this paper is to present evidence that a given quantity of nitrogen atoms is incorporated into the Si-nc/SiO2layer and
a兲Author to whom correspondence should be addressed. Tel.:⫹1
450-929-8108. Electronic mail: ross@emt.inrs.ca.
that the nitrogen concentration has a direct influence on the growth of the Si-nc, strongly affecting the PL spectra.
II. EXPERIMENTAL
Two different types of samples were used in our study: amorphous fused silica and films 共⬃1 m兲 of amorphous SiO2 thermally grown on a Si共100兲 substrate.13The former
samples are to verify that the PL spectra are not influenced by interference phenomena14,15 while the latter samples fa-cilitate characterization using nuclear reaction by avoiding the accumulation of electric charges during irradiation.16,17 Quartz and SiO2 samples were implanted by means of the
IMC-200 ion implanter18with 150 keV Si+ions to a fluence
of 1.1⫻1017 Si+/cm2, which corresponds to local Si
con-centration in excess of 23 at. % at the mean implantation depth共Rp兲. All samples were implanted simultaneously with
fluence uniformity better than 1%. After the Si+implantation,
some samples were also implanted with 164 keV N2+ions to fluences of 3⫻1016and 6⫻1016 N/cm2. According toSRIM
simulation,19 this energy produces an implantation mean range very similar to that of the excess Si. Thereafter, the samples were annealed to 1100 ° C for 60 min under an en-vironment of nitrogen 共N2兲 or argon 共Ar兲. Some samples
were passivated at 500 ° C for 30 min in a forming gas of 5% H2+ 95% N2or 5% H2+ 95% Ar. Measurements of the
photoluminescence 共PL兲 were carried out at ambient tem-perature using a laser diode at 405 nm for photonic excita-tion. The light emitted by the sample was transmitted to an optical-multichannel spectrometer共Ocean Optics USB2000兲. The wavelength detection of the spectroscope extends be-tween 550 and 1100 nm.
Micro-Raman measurements were performed at room temperature using a confocal Invia Renishaw RM 3000 spec-trometer, equipped with a digital camera and a 50⫻objective lens of 0.75 numerical aperture 共NA兲. An Ar laser line at 514.5 nm, focused either on the sample surface or within the first micrometer of the sample, was used for the Raman excitation.20
The nitrogen profiles were measured by resonant nuclear reaction analysis共RNRA兲 using the14N共␣,␥兲18F nuclear re-action, which has a resonance at 1.531 MeV.21The advantage of RNRA is the narrow resonance exhibited by the cross section leading to an excellent depth resolution of the nitro-gen profiles.22–24 The reported values for the 14N共␣,␥兲18F resonance are: width of 0.6 keV21and resonance strength of 2.6 eV.25 From these values, a resonant cross section of 3.1 mb was calculated.26 All RNRA measurements were done with the ALTAÏS,27the linear accelerator installed at LARN. The experimental setup is described in more details elsewhere.22The14N depth profiles are measured by varying step by step the incident 4He+ energy, so that the resonant
cross section acts as a probe of the nitrogen depth distribu-tion. At each energy, gamma rays in the range of 3.06–5.60 MeV produced by de-excitation of the 18F nuclei were counted in a NaI共Tl兲 well detector.
In order to measure the nitrogen concentration with greater sensitivity than the resonant reaction 14N共␣,␥兲18F, the 14N共d,␣兲12C and 14N共d,p兲15N nuclear reactions were
used with 1.05 MeV deuterons particles. The detector used for nuclear reaction analysis共NRA兲 was placed at 150° rela-tively to the incident beam direction and a 12 m Mylar absorber was placed in front of the detector to stop deuterons backscattered on the target. A rectangular 4⫻13 mm2
colli-mator placed in front of the detector defines a solid angle of 20.8 msr. Another detector used for Rutherford backscatter-ing spectroscopy共RBS兲 was placed at 165° relatively to the incident beam direction in order to measure the number of incident particles. The sensitivity of 14N共d,␣兲12C and
14N共d,p兲15N reactions is typically of⬃1015 atoms/cm2.
III. RESULTS AND DISCUSSION
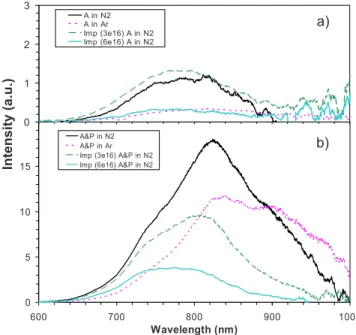
The PL spectra of annealed and annealed/passivated samples are shown in Figs.1共a兲and1共b兲, respectively. It is obvious that the passivation procedure and the type of an-nealing gas used have a strong influence on both the intensity and the shape of the PL spectra. Annealing in N2 promotes
an increase in the PL intensity along with a blueshift of the spectra in comparison to samples annealed in Ar关Fig.1共a兲兴. After passivation, the difference in intensity between the samples annealed in Ar and in N2 is relatively smaller关Fig.
1共b兲兴 and the spectrum of the N2 treated sample is
signifi-cantly blueshifted in comparison to the Ar treated sample, in agreement with the observation of Wilkinson and Elliman.12 Nitrogen implantation also has a strong influence on the PL. It produces a blueshift that is accentuated by passivation. For the passivated samples 关Fig. 1共b兲兴, the PL intensity is lower for those that have been implanted, notably at the higher nitrogen fluence 共6⫻1016 N/cm2兲. In contrast, for annealed only samples关Fig.1共a兲兴, the PL intensity is greatest for the sample implanted with the lower nitrogen fluence 共3⫻1016 N/cm2兲. This result supports the hypothesis that
the presence of nitrogen contributes to passivate the dangling
0 5 10 15 600 700 800 900 1000 Wavelength (nm) A&P in N2 A&P in Ar Imp (3e16) A&P in N2 Imp (6e16) A&P in N2
b) 0 1 2 3 A in N2 A in Ar Imp (3e16) A in N2 Imp (6e16) A in N2 a) Intensity (a.u. )
FIG. 1.共Color online兲 PL spectra of samples 共a兲 annealed and 共b兲 annealed
and passivated under N2or Ar environment. Two samples were also
im-planted with different nitrogen fluences共3⫻1016and 6⫻1016 N/cm2兲
be-fore annealing.
bonds, promoting radiative transitions. However, it seems that a too large nitrogen concentration leads to an attenuation of the PL emission.
In order to clarify this observation, the annealed/ passivated samples have been characterized by Raman spec-troscopy and the results are shown in Fig.2. The sharp peak around 520 cm−1 is the optical phonon associated with Si-nc.28–32The intensity and shape of this peak is influenced by the size and concentration of Si-nc. The peak intensity is slightly higher for the sample annealed under Ar, suggesting that the Si-nc size could be larger. This is in agreement with the observed redshift of the PL spectra in Fig. 1. However, the most remarkable result is the low Raman signal observed in the nitrogen implanted sample. This suggests that the high nitrogen concentration reduces the formation of Si-nc, which may explain the weak PL signal recorded from this sample. From Raman characterization, it is possible to obtain information about the Si-nc size and the ratio of the Si amor-phous clusters 共␣-Si兲 phonon peak intensity 共I␣-Si兲, around 470 cm−1, to the Si-nc optical vibration modes 共I
Si-nc兲,
around 520 cm−1.20
An instrumental resolution of 5 cm−1
and a reference wave number of 524 cm−1 for the Si–Si
bond in bulk28Si were used to fit the experimental results to obtain the Si-nc diameter and size distribution. We use a reference wave number of 524 cm−1 for the Si–Si bond
be-cause the Si-nc nucleation comes from the clustering of im-planted Si and our ion implantations were performed with
28Si共i.e., not with natural Si兲.33
The fit is plotted in the inset
of Fig. 2 and the results are presented in Table I. These indicate that the use of a N2 environment produces smaller Si-nc than annealing under Ar, in agreement with Wilkinson and Elliman.12 The choice of the annealing gas 共Ar or N2兲 has no influence on the Si-nc size distribution or on the
I␣-Si/ISi-ncratio, suggesting that the presence of nitrogen does
not contribute to the formation and crystallization of Si-nc. These observations are in contradiction with the conclusion of Muloni et al.11who used a different technique in the depo-sition of substoichiometric SiO2 layers. Finally, N2+
ion-implanted samples show the smallest Si-nc diameter and the greatest I␣-Si/ISi-nc ratio. Although the differences in Si-nc
size distribution and I␣-Si/ISi-ncratio are less than the
respec-tive measurement error, nevertheless these measurements suggest that a high nitrogen concentration may lead to an occupation of one or more Si bonds, thus impeding the for-mation of Si-nc leaving the Si atoms in amorphous clusters. Thus, there is a strong possibility that the Si-nc concentration has been decreased by the implantation of nitrogen.
A peak is also observed around 950 cm−1 in the Raman spectrum of Fig. 2. This peak is associated to the Si–N bond,34,35 which can provide very useful information on the role of nitrogen in the PL. It is obvious that annealing/ passivation in N2environment has contributed to enhance the
formation of Si–N bonds, supporting the hypothesis that ni-trogen plays a passivation role during annealing. Another striking result is the high intensity of the Si–N peak observed in the nitrogen implanted sample. This supports the fact that nitrogen atoms in high concentration can occupy a larger number of Si bonds, preventing an efficient formation of Si-nc. This observation is in agreement with the results of Table I and the weakness of the Si-nc peak around 500 cm−1.
Depth profiles of nitrogen, as measured by the RNRA technique, are shown in Fig. 3 for samples annealed and passivated in Ar and N2. A high nitrogen concentration is
observed from the samples annealed and passivated in N2. In
both cases, the nitrogen depth profiles correspond to the Si depth profile also shown in Fig. 3. In order to distinguish between implanted and annealed nitrogen atoms, nonan-nealed control samples of nonimplanted and Si+
ion-0 500 1000 1500 2000 2500 3000 3500 4000 0 200 400 600 800 1000 1200 Stokes shift (cm-1) R am an in ten si ty (a .u .) A&P in Ar -500 0 500 1000 1500 2000 2500 3000 370 420 470 520 Stokes Shift (cm-1) R am an int ens ity (a .u.) Exp. Si-nc a-Si Si-nc + a-Si
Imp (6e16) A&P in N2
-100 0 100 200 300 400 500 370 420 470 520 Stokes shift (cm-1) R am an in te ns ity (a .u .) Exp. Si-nc a-Si Si-nc + a-Si A&P in N2 -500 0 500 1000 1500 2000 2500 370 420 470 520 Stokes shift (cm-1) R am an in ten si ty (a .u .) Exp.Si-nc a-Si Si-nc + a-Si
FIG. 2.共Color online兲 Raman spectra of samples annealed and passivated in
N2 or in Ar environment. One sample was also implanted with nitrogen
before annealing. The inset shows a detail view of the peak at 520 cm−1and
the result of the fit for the I␣-Siat 470 cm−1and I
Si-ncat 520 cm−1.
TABLE I. Si-nc diameter and size distribution and I␣-Si/ISi-ncratio for
dif-ferent samples.
Sample
Si-nc diameter
Si-nc size
distribution I␣-Si/ISi-nc
A and P in Ar 4.3共⫾0.1兲 nm 0.7共⫾0.1兲 nm 22.2共⫾5兲%
A and P in N2 3.8共⫾0.1兲 nm 0.7共⫾0.1兲 nm 21.5共⫾5兲%
Imp.共6⫻1016 N/cm2兲 3.0共⫾0.3兲 nm 0.5共⫾0.3兲 nm 35.0共⫾15兲%
FIG. 3.共Color online兲 RNRA depth profile of nitrogen in samples annealed
and passivated under N2or Ar environment, along with the Si depth profile
implanted samples have been fabricated for NRA character-ization since both Si atoms and N2molecules have mass of 28 and follow similar trajectory in the magnetic field of the ion implanter. The areal concentrations of nitrogen are shown in TableIIalong with those measured in annealed and annealed/passivated samples. The sensitivity of the charac-terization technique 共⬃1⫻1015 at/cm2兲 has been deter-mined from nonimplanted control samples. However, a very small quantity of nitrogen was detected in the implanted sample, indicating that some N2+ions were implanted during the Si+ implantation. Annealing and passivation in Ar have not significantly increased the nitrogen concentration, while a slightly higher quantity of nitrogen was detected in the sample passivated at 500 ° C. On the other hand, annealing and passivation in N2 environment have significantly
in-creased the nitrogen concentration. These measurements sup-port the hypothesis that a small quantity of nitrogen can dif-fuse in the sample during both annealing and passivation. Since the nitrogen depth profiles follow that of the implanted Si, the diffused nitrogen can be trapped in the region where excess Si is localized. This is strengthened by the observa-tion of Si–N bonds through Raman spectroscopy.
It is well known that N2 can diffuse into SiO2 at high
temperature⬃1100 °C 共Ref.36兲 and can be incorporated at
the Si/SiO2 interface as an oxynitride compound.12,35,37The implantation induced damage can also contribute to enhance the N2 diffusion. According to the Raman and nuclear
共RNRA and NRA兲 characterizations, the N2 diffused
throughout the SiO2films and was trapped at the Si-nc/SiO2
interface. The similarity of the nitrogen and Si-nc depth pro-files, combined to the observation of an increase in the Si–N bonds in samples annealed in N2 environment, support the
mechanism proposed by Wilkinson and Elliman12 that an-nealing in N2is a process of thermal relaxation that is com-pounded by the exchange of nitrogen with the oxide net-work. The blueshift of the PL spectra could be a consequence of the size reduction in the Si-nc by oxynitridation at the Si-nc/SiO2 interface. The observation of Si–N bond
vibra-tions suggests the formation of SiOxNycompounds in
simili-tude with the mechanism observed at the Si/SiO2 interface
during annealing in nitrogen.36 At low concentration, the presence of nitrogen can contribute to the passivation of the Si-nc/SiO2interface in reducing the number of point defects or isolated dangling bonds38due to a better molecular match-ing at the Si/SiOxNyinterface共in comparison to the Si/SiO2
interface兲.39
Consequently, the PL intensity increases as has been observed after hydrogen passivation. However, at high
concentration, for instance when N2ions were implanted, the
oxynitridation is not stopped by lack of N2, thus the Si-nc
size is strongly reduced and may eventually not be formed. This mechanism is supported by the results in Table I, con-cerning the Si-nc size and the I␣-Si/ISi-ncratio.
IV. CONCLUSION
PL emission of Si-nc produced by implantation of Si+in
excess into SiO2is increased when a nitrogen environment is
used during annealing. A blueshift in the PL spectra has been observed in agreement with the decrease in the Si-nc diam-eter from 4.3 to 3.8 nm when Ar and N2 gases are used,
respectively. Nitrogen atoms have been detected in all samples by RNRA and the nitrogen concentration is signifi-cantly higher when the annealing and passivation are per-formed under N2 environment. The nitrogen depth-profiles
are closely related to those of Si-nc, suggesting that the ni-trogen atoms diffuse in the SiO2 during the annealing and
can be trapped in proximity of the Si-nc. This hypothesis is supported by the observation of a higher Si-N bond concen-tration through Raman spectroscopy. The implantation of ni-trogen to nini-trogen concentrations of 3 and 6 at. % has de-creased the PL intensity. These results suggest that a relatively low atomic fraction of nitrogen has enhanced the PL emission while at high nitrogen concentration, the forma-tion of Si-nc is reduced, leading to a decrease in the PL intensity.
ACKNOWLEDGMENTS
The authors thank Gilles Abel for technical help and ion implantation processing. This work has been supported by the ST-4/05.804 collaboration between the Wallonie-Bruxelles Community and the government of Québec, and the Natural Science and Engineering Research Council of Canada共NSERC, Grant No. STPSC 356653-07兲. G. Genard was supported as research fellow by the Belgian National Fund for Scientific Research共F.R.S.-FNRS兲.
1L. T. Canham, Appl. Phys. Lett.57, 1046 共1990兲; A. G. Cullis, L. T.
Canham, and P. D. Calcott,J. Appl. Phys.82, 909共1997兲.
2D. J. DiMaria, J. R. Kirtley, E. J. Pakulis, D. W. Dong, T. S. Kuan, F. L.
Pesavento, T. N. Theis, and J. A. Cutro,J. Appl. Phys.56, 401共1984兲.
3S. Hayashi, T. Nagareda, Y. Kanzawa, and K. Yamamoto,Jpn. J. Appl.
Phys., Part 132, 3840共1993兲.
4S. Cheylan, N. B. Manson, and R.G. Elliman, J. Lumin. 80, 213共1998兲.
5S. Cheylan and R.G. Elliman,Nucl. Instrum. Methods Phys. Res. B148,
986共1999兲.
6T. Shimizu-Iwayama, K. Fujita, S. Nakao, K. Saitoh, T. Fujita, and N.
Itoh,J. Appl. Phys.75, 7779共1994兲.
7T. Komoda, J. P. Kelly, R. M. Gwilliam, P. L. F. Hemment, and B. J.
Sealy,Nucl. Instrum. Methods Phys. Res. B112, 219共1996兲.
8B. Garrido, M. López, S. Ferré, A. Romano-Rodríguez, A.
Pérez-Rodríguez, P. Ruterana, and J. R. Morante,Nucl. Instrum. Methods Phys.
Res. B120, 101共1996兲.
9F. Koch and V. Petrova-Koch, J. Non-Cryst. Solids 198–200, 840共1996兲.
10S. M. Orbons, M. G. Spooner, and R. G. Elliman,J. Appl. Phys.96, 4650
共2004兲.
11V. Mulloni, P. Bellutti, and L. Vanzetti,Surf. Sci.585, 137共2005兲.
12A. R. Wilkinson and R. G. Elliman,J. Appl. Phys.96, 4018共2004兲.
13Supplied by Universitywafer.com, 66 N Street, Unit #9, South Boston,
MA 02127.
14R. Smirani, F. Martin, G. Abel, Y. Q. Wang, M. Chicoine, and G. G. Ross,
J. Lumin.115, 62共2005兲.
TABLE II. Areal nitrogen density as measured by NRA in different samples.
Sample description Nitrogen areal concentration
Non implanted SiO2 ⬍1⫻1015 N/cm2
Si implanted SiO2共not annealed兲 3.4⫻1015 N/cm2
Si implanted SiO2共A in Ar兲 4.1⫻1015 N/cm2
Si implanted SiO2共A and P in Ar兲 8.2⫻1015 N/cm2
Si implanted SiO2共A in N2兲 1.0⫻1016 N/cm2
Si implanted SiO2共A and P in N2兲 1.4⫻1016 N/cm2
15D. Barba, F. Martin, C. Dahmoune, and G. G. Ross,Appl. Phys. Lett.89,
034107共2006兲.
16G. G. Ross and C. Sévigny,Nucl. Instrum. Methods Phys. Res. B211, 351
共2003兲.
17M. Yedji and G. G. Ross, J. Phys. D 39, 4429共2006兲.
18Purchased from Ion Beam Services: http://www.ion-beam-services.com/.
19J. P. Biersack and J. F. Ziegler,
SRIM-2006; http://www.srim.org.
20D. Barba, F. Martin, and G. G. Ross,Nanotechnology19, 115707共2008兲.
21C. R. Gossett, Nucl. Instrum. Methods Phys. Res. B 10–11, 722共1985兲.
22G. Genard, M. Yedji, G. G. Ross, and G. Terwagne,Nucl. Instrum.
Meth-ods Phys. Res. B264, 156共2007兲.
23G. Terwagne, M. Piette, and F. Bodart, Nucl. Instrum. Methods Phys. Res.
B 19-20, 145共1987兲.
24G. Terwagne, S. Lucas, and F. Bodart,Nucl. Instrum. Methods Phys. Res.
B66, 262共1992兲.
25H. B. Mak, G. T. Ewan, J. D. MacArthur, W. McLatchie, and R. E.
Azuma, Nucl. Phys. A. 343, 79共1980兲.
26M. Yedji, M. Bolduc, G. Genard, G. Terwagne, and G. G. Ross,Nucl.
Instrum. Methods Phys. Res. B266, 2060共2008兲.
27Accélérateur Linéaire Tandetron pour l’Analyse et l’Implantation des
Solides.
28G. H. Li, K. Ding, Y. Chen, H. X. Han, and Z. P. Wang,J. Appl. Phys.88,
1439共2000兲.
29H. Richter, Z. P. Wang, and L. Ley,Solid State Commun.39, 625共1981兲.
30I. H. Campbell and P. M. Fauchet,Solid State Commun.58, 739共1986兲.
31G. Faraci, S. Gibilisco, P. Russo, A. R. Pennisi, and S. La Rosa,Phys. Rev.
B73, 033307共2006兲.
32Md. N. Islam, A. Pradhan, and S. Kumar, J. Appl. Phys. 98, 024309
共2005兲.
33M. Cardona,Phys. Status Solidi B220, 5共2000兲.
34B. K. Agrawal, P. S. Yadav, and B. K. Ghosh,J. Phys. C21, 3397共1988兲.
35M. Ribeiro, I. Pereyra, and M. I. Alayo,Thin Solid Films426, 200共2003兲.
36S. I. Raider, R. A. Gdula, and R. Petrak,Appl. Phys. Lett.27, 150共1975兲.
37M. L. Green, T. Sorsch, L. C. Feldman, W. N. Lennard, E. P. Gusev, E.
Garfunkel, H. C. Lu, and T. Gustafsson,Appl. Phys. Lett.71, 2978共1997兲.
38B. Tuttle,Phys. Rev. B60, 2631共1999兲.
39E. P. Gusev, H. C. Lu, T. Gustafsson, E. Garfunkel, M. L. Green, and D.