RESEARCH OUTPUTS / RÉSULTATS DE RECHERCHE
Author(s) - Auteur(s) :
Publication date - Date de publication :
Permanent link - Permalien :
Rights / License - Licence de droit d’auteur :
Bibliothèque Universitaire Moretus Plantin
Institutional Repository - Research Portal
Dépôt Institutionnel - Portail de la Recherche
researchportal.unamur.be
University of Namur
Aluminum pretreatment by a laser ablation process
Al Sayyad, Adham; Bardon, Julien; Hirchenhahn, Pierre; Santos, Kevin; Houssiau, Laurent;
Plapper, Peter
Published in: Procedia CIRP DOI: 10.1016/j.procir.2018.08.136 Publication date: 2018 Document VersionPublisher's PDF, also known as Version of record
Link to publication
Citation for pulished version (HARVARD):
Al Sayyad, A, Bardon, J, Hirchenhahn, P, Santos, K, Houssiau, L & Plapper, P 2018, Aluminum pretreatment by a laser ablation process: influence of processing parameters on the joint strength of laser welded aluminum -Polyamide assemblies. in M Schmidt, F Vollertsen & G Dearden (eds), Procedia CIRP: 10th CIRP Conference
on Photonic Technologies [LANE 2018]. Procedia CIRP, vol. 74, pp. 495-499, 10th CIRP Conference on
Photonic Technologies, LANE 2018, Furth, Germany, 3/09/18. https://doi.org/10.1016/j.procir.2018.08.136
General rights
Copyright and moral rights for the publications made accessible in the public portal are retained by the authors and/or other copyright owners and it is a condition of accessing publications that users recognise and abide by the legal requirements associated with these rights. • Users may download and print one copy of any publication from the public portal for the purpose of private study or research. • You may not further distribute the material or use it for any profit-making activity or commercial gain
• You may freely distribute the URL identifying the publication in the public portal ?
Take down policy
If you believe that this document breaches copyright please contact us providing details, and we will remove access to the work immediately and investigate your claim.
ScienceDirect
ScienceDirect
Procedia CIRP 00 (2017) 000–000
www.elsevier.com/locate/procedia
2212-8271 © 2017 The Authors. Published by Elsevier B.V.
Peer-review under responsibility of the scientific committee of the 28th CIRP Design Conference 2018.
28th CIRP Design Conference, May 2018, Nantes, France
A new methodology to analyze the functional and physical architecture of
existing products for an assembly oriented product family identification
Paul Stief *, Jean-Yves Dantan, Alain Etienne, Ali Siadat
École Nationale Supérieure d’Arts et Métiers, Arts et Métiers ParisTech, LCFC EA 4495, 4 Rue Augustin Fresnel, Metz 57078, France
* Corresponding author. Tel.: +33 3 87 37 54 30; E-mail address: [email protected]
Abstract
In today’s business environment, the trend towards more product variety and customization is unbroken. Due to this development, the need of agile and reconfigurable production systems emerged to cope with various products and product families. To design and optimize production systems as well as to choose the optimal product matches, product analysis methods are needed. Indeed, most of the known methods aim to analyze a product or one product family on the physical level. Different product families, however, may differ largely in terms of the number and nature of components. This fact impedes an efficient comparison and choice of appropriate product family combinations for the production system. A new methodology is proposed to analyze existing products in view of their functional and physical architecture. The aim is to cluster these products in new assembly oriented product families for the optimization of existing assembly lines and the creation of future reconfigurable assembly systems. Based on Datum Flow Chain, the physical structure of the products is analyzed. Functional subassemblies are identified, and a functional analysis is performed. Moreover, a hybrid functional and physical architecture graph (HyFPAG) is the output which depicts the similarity between product families by providing design support to both, production system planners and product designers. An illustrative example of a nail-clipper is used to explain the proposed methodology. An industrial case study on two product families of steering columns of thyssenkrupp Presta France is then carried out to give a first industrial evaluation of the proposed approach.
© 2017 The Authors. Published by Elsevier B.V.
Peer-review under responsibility of the scientific committee of the 28th CIRP Design Conference 2018.
Keywords: Assembly; Design method; Family identification
1. Introduction
Due to the fast development in the domain of communication and an ongoing trend of digitization and digitalization, manufacturing enterprises are facing important challenges in today’s market environments: a continuing tendency towards reduction of product development times and shortened product lifecycles. In addition, there is an increasing demand of customization, being at the same time in a global competition with competitors all over the world. This trend, which is inducing the development from macro to micro markets, results in diminished lot sizes due to augmenting product varieties (high-volume to low-volume production) [1]. To cope with this augmenting variety as well as to be able to identify possible optimization potentials in the existing production system, it is important to have a precise knowledge
of the product range and characteristics manufactured and/or assembled in this system. In this context, the main challenge in modelling and analysis is now not only to cope with single products, a limited product range or existing product families, but also to be able to analyze and to compare products to define new product families. It can be observed that classical existing product families are regrouped in function of clients or features. However, assembly oriented product families are hardly to find.
On the product family level, products differ mainly in two main characteristics: (i) the number of components and (ii) the type of components (e.g. mechanical, electrical, electronical).
Classical methodologies considering mainly single products or solitary, already existing product families analyze the product structure on a physical level (components level) which causes difficulties regarding an efficient definition and comparison of different product families. Addressing this
Procedia CIRP 74 (2018) 495–499
2212-8271 © 2018 The Authors. Published by Elsevier Ltd. This is an open access article under the CC BY-NC-ND license (https://creativecommons.org/licenses/by-nc-nd/4.0/)
Peer-review under responsibility of the Bayerisches Laserzentrum GmbH. 10.1016/j.procir.2018.08.136
© 2018 The Authors. Published by Elsevier Ltd. This is an open access article under the CC BY-NC-ND license (https://creativecommons.org/licenses/by-nc-nd/4.0/)
Peer-review under responsibility of the Bayerisches Laserzentrum GmbH.
10th CIRP Conference on Photonic Technologies [LANE 2018]
ScienceDirect
Procedia 00 (2018) 000–000
www.elsevier.com/locate/procedia
2212-8271 © 2018 The Authors. Published by Elsevier Ltd. This is an open access article under the CC BY-NC-ND license (http://creativecommons.org/licenses/by-nc-nd/3.0/)
Peer-review under responsibility of the Bayerisches Laserzentrum GmbH.
10th Conference on Photonic Technologies – LANE 2018
Aluminum Pretreatment by a Laser Ablation Process:
Influence of Processing Parameters on the Joint Strength
of Laser Welded Aluminum – Polyamide Assemblies
Adham Al-Sayyad
a,*, Julien Bardon
b, Pierre Hirchenhahn
c, Kevin Santos
a, Laurent Houssiau
c,
Peter Plapper
aaUniversity of Luxembourg, rue Coudenhove-Kalergi 6, L-1359 Luxembourg, Luxembourg
bLuxembourg Institute of Science and Technology, avenue des Hauts-Fourneaux 5, L-4362 Esch-sur-Alzette, Luxembourg cUniversité de Namur, NISM Namur Institute for Structured Matter, LISE, Rue de Bruxelles 61, 5000 NAMUR, Belgium
* Corresponding author. Tel.: +352-466644-6034; fax: +352-466644-36034. E-mail address: [email protected]
Abstract
Laser welding of metal – polymer assemblies is an innovative bonding process. It was already demonstrated that laser surface pretreatments of aluminum (Al), prior to laser welding with a polymer, impacts joints strength. This work adopts a design of experiments (DoE) approach to investigate the influence of several Al laser ablation parameters on joint strength of laser welded Al – polyamide (PA6.6) assemblies. Significant parameters were highlighted, process window was outlined, and optimal parameters were identified. After assembly failure, the joint area was evaluated using optical microscopy. Depending on the laser ablation parameters, the joint area can be enhanced resulting in a significant increase in the corresponding bearable shear load.
© 2018 The Authors. Published by Elsevier Ltd. This is an open access article under the CC BY-NC-ND license (http://creativecommons.org/licenses/by-nc-nd/3.0/)
Peer-review under responsibility of the Bayerisches Laserzentrum GmbH.
Keywords: Laser ablation; Laser beam welding; Hybrid joining; Metal-polymer assemblies
1. Introduction
Joining metals to polymers has gained cogent academic and industrial attention as these assemblies combines the thermal, mechanical, and electrical properties of the metals, with the low density and high deformability of polymers. Nowadays, such materials combination is mostly joined using mechanical or chemical methods. However, mechanical fasteners increases the assembly weight, and adhesive bonding escalates the manufacturing cost as it requires additional curing time. Contrarily, laser welding is a very promising rapid joining technique, particularly for its aptitude in creating miniaturized joints by precisely controlling the heat input to the weld joint.
Laser beam welding of metals, such as mild steel, stainless steel and aluminum to PA based polymers and fiber-reinforced composites, has already been demonstrated in literature [1]–[6]. Researchers [1]–[3] have been studying the effects of
mechanical and chemical surface pre-treatment techniques for metals on the joint strength. The use of a laser beam, as a tool for metallic surface pretreatment, has gained attention among researchers because of its appeal as a rapid, solventless and non-contact process, with considerably lower environmental impact compared to chemical pretreatments. Researchers have been studying the influence of patterned (cf. Figure 1.a) and stochastic surface structuring geometries (cf. Figure 1.c) on the joint strength.
Effects of forming uniformly distributed structures on Al and stainless steel surfaces, using Nd:YAG laser, before laser welding and thermal joining to selected polymers were examined [4]–[6]. The created structures allowed for mechanical interlocking, which was reported as one of the main causes behind the increase in joint strength. Holtkamp et al. [5] claimed a correlation between the increase in shear strength and laser surface structural density (per unit area).
496 Adham Al-Sayyad et al. / Procedia CIRP 74 (2018) 495–499
2 Al-Sayyad/ Procedia 00 (2018) 000–000
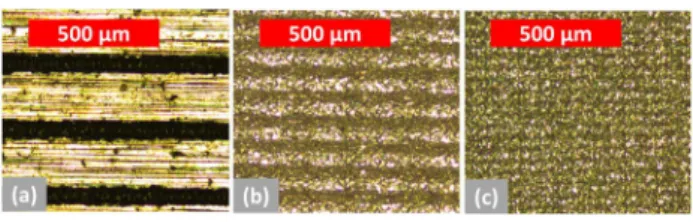
Figure 1. (a) patterned; (b) semi-patterned ;(c) stochastic ablation geometry.
Concerning stochastic surface structuring, researchers [7], [8] reported the effects of Al surface pretreatment, using short-pulsed laser ablation, prior to laser welding with PA6.6. However, the influence of the laser ablation parameters, on the joint strength and failure behavior, was not investigated.
2. Experimental method
This research considers patterned, semi-patterned, and stochastic laser surface pretreatment geometries (Figure 1). It highlights the most significant laser ablation processing parameters, defines the process window, and explores the failure behavior of laser welded Al – PA6.6 joints.
2.1. Materials
The materials used for these experiments were 0.5 mm thick EN-AW1050A aluminum, in half-hard state, and 4 mm polyamide 6.6 (PA6.6) purchased from Dutec. The Al sample had a geometry of 30 mm × 60 mm, while the PA6.6 sample had the dimensions of 25 mm × 75 mm. While the Al surface was prepared by laser treatment, PA samples was wiped with ethanol to remove potential dirt and grease from the surface prior to laser joining process.
2.2. Laser ablation DoE
Al surface was ablated by means of short-pulsed (ns) Nd:YVO4 laser (TruMark 6130 from TRUMPF) with a wave length of 1064 nm, and a spot size of 45 µm. The high power density caused the removal of surface contamination, and the formation of an aluminum oxidized layer at the surface [8].
Laser is introduced in the form of pulses on the Al surface. The pulses overlap ratio (o), shown in Figure 2 and described by Equation 1, is strongly influenced by three parameters: pulse frequency (fp), beam deflection speed (V) and beam diameter
(∅). Keeping a constant beam diameter and independently decreasing the pulse frequency or increasing the beam speed results in an increase in the overlap ratio. Thus, a combination of both parameters can produce patterned or stochastic surface structures. However, an increase in the pulse frequency causes a diminution in the peak pulse power (PPP).
First, Plackett-Burman [9] screening DoE was set, with the aid of Minitab software, to highlight the most significant parameters affecting the joint resistance to the applied shear load. Twenty-four experimental runs were designed to investigate seven parameters (Table 1). This design had a relatively high statistical power with 80% chance of detecting small effect size (shift in mean value) of 1.06 standard deviation. The joint strength was quantified by means of a single-lap shear test, using Z010 machine from Zwick/Roell.
� �%� = �1 − � ���� �
∅ ������� ����� � 100 (1) Table 1: Screened variables.
Variables Type Low value High value Pulse frequency (kHz) Continuous 15 40 Beam speed (mm/s) Continuous 1776 3776 Lines Categorical Off On Focal position Continuous 2.5mm offset On surface Rolling direction Categorical Axial Perpendicular Hatching orientation Categorical Axial Perpendicular Power percentage (%) Continuous 50 75
For the screening design, two levels were chosen per variable. The beam deflection speed and pulse frequency were included in the design. Power percentage controls the peak pulse power (PPP) together with pulse frequency. 15 kHz yields an approximately calculated PPP of 85 kW, while 40 kHz yields 35 kW, as obtained from the machine manufacturer (TRUMPF). The focal position was varied from focusing on the Al surface with a spot size of 45 µm, to defocusing with a downward offset of 2.5 mm yielding a spot size of 102 µm.
Apart from continuous factors, the term “lines” refer to the laser scanning geometry. With this variable, the laser scans the geometry of a single line eight times with an offset equidistantly arranged in 4 mm wide geometry as shown in Figure 2. This causes the lines to overlap resulting in repetitive ablation of treated area. The term “rolling” corresponds to rolling grooves observed on raw Al. The term “hatch” corresponds to the alignment of the parallel laser beam structuring lines illustrated by the dashed lines in Figure 2. The distance between the hatching lines is influenced by the overlap ratio. Axial and perpendicular orientations are described with reference to the direction of the applied shear load.
Once important factors were identified, Response surface method (RSM) [10] was used in order to identify the factor settings that optimize the response. RSM is a statistical experimental design where the parameters are simultaneously varied in order to simulate their interaction. It also provides a predictive model relating the response to the process parameters. To outline the process window, four successive full-factorial experimental designs, with a total of 140 welded samples, were used to fit the model. Factors’ levels of the consecutive designs were determined by following the steepest path of ascent. Face-centered central composite design was used to model curvature. Analysis of Variance (ANOVA) [11] was employed to determine the reliability of the developed model and the significance of its coefficients.
Figure 2. (a) schematic of overlapped pulses; (b) “lines” variable.
Figure 3. (left) Laser welding process schematic; (right) laser beam trajectory.
2.3. Laser beam welding
The laser welding was done using a fiber laser (TruFiber 400 from TRUMPF) with a wavelength of 1070 nm. The laser beam was irradiated on the Al surface, with a calculated spot diameter of 58 µm, after clamping the parts in an overlap configuration as shown in Figure 3. Part of the laser beam energy was absorbed, converted to heat energy, and conducted to the joint interface, thereby joining Al and PA6.6. Concerning the welding parameters, a peak pulse power of 400 W was modulated with a pulse frequency of 25 kHz, and a pulse duration of 35 µs. The laser beam followed a spiral trajectory with a corresponding feed velocity �� = 88.8 mm/s (Figure 3).
Those parameters gave joints with good resistance in previous studies [7], [8]. In order to investigate the sole effect of surface pre-treatment parameters, the laser welding parameters were kept fixed during the optimization and screening experiments. 2.4. Surface topography
Surface profile was obtained for all of the treated Al samples involved in the optimization experiments. The measurement was done according to ISO 4287 standard using TESA rugosurf 10G from TESA Technology. The measurement was aligned to the actual loading direction (axial to the shear load). The cut-off length was set to 0.8 mm with five cut-cut-offs.
2.5. Macroscopic and microscopic assessments
After failure, microscopic and macroscopic images of the joint area were obtained using Leica DM4000 microscope, and a digital FUJIFILM X-Pro2 camera respectively. Five samples, ablated with different parameters, were assessed. The joint area was visually outlined and measured using GIMP software by counting the number of pixels and correlating with the pixel dimensions, which was determined using a reference scale included in the sample picture.
Figure 4. (left) Pareto chart of effects; (right) shear load main effect plot.
3. Results and discussions
3.1. Screening DoE
Screening design resulted in several ablation geometries, including patterned, semi-patterned, and stochastic (Figure 1). Pareto chart (Figure 4) shows the magnitude of effects of the screened parameters. Here, the effect of a single parameter illustrates the difference in mean shear load at its high and low values. The red line, determined by Lenth's method [12], shows the effect size at 0.1 level of significance. Results identified both pulse frequency and beam speed to have statistical significance on the achieved shear load.
The main effect plot, shown in Figure 4, describes how changes to a single factor affect the mean shear load. Results show that the high level of the pulse frequency and the low level of beam speed are favored to increase the shear load. This clearly manifests the benefit of increasing the overlap ratio. Thus, stochastic rather than patterned laser ablation geometry. 3.2. Optimization DoE
The critical factors, pulse frequency and beam speed, were used to create a predictive model. Insignificant variables were kept constant as shown in Table 2 during optimization.
Table 2: Fixed parameters settings during optimization DoE.
Power (%) Focal position Hatching Lines Rolling 100 On surface Perpendicular Off Axial
Figure 5 shows the contour plot of the developed regression model (Equation 2). ANOVA analysis revealed the high reliability of the model and the significance of its coefficients, namely: pulse frequency (fp [kHz]), beam speed (V [mm/s]),
and non-linearity in speed (V2). Such nonlinear behavior
outlines an optimal range of overlap ratio between 60% and 75% as illustrated on the contour plot.
The maximum achievable pulse frequency of the laser ablation machine in use was 120 kHz. To further expand the process window, it was decided to lower the PPP by controlling the power percentage while keeping the overlap ratio (≈ 68%) of the previously identified optimal setting (120 kHz and 1750 mm/s) unchanged. This last optimization step (Figure 5) revealed an optimal calculated PPP of ≈ 4.75 kW, achieving a maximum average shear load of 1465 ± 65 N.
���� ��� = 343.7 + 4.3 ��+ 0.68 � − 0.00019 �� (2)
498 Adham Al-Sayyad et al. / Procedia CIRP 74 (2018) 495–499
4 Al-Sayyad/ Procedia 00 (2018) 000–000
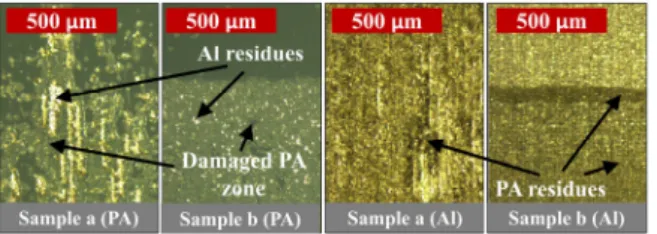
Figure 6. Welded region after fracture; (a) low (b) high shear load.
3.3. Surface topography
All ablated Al surfaces, excluding those ablated at 85 kHz and 250 mm/s (conditions “a”), showed comparable surface topography (average Ra = 1 ± 0.28 µm). Samples ablated at conditions “a” (e.g. sample “a”, Figure 6) revealed a significantly higher Ra (3.35 ± 0.22 µm) and failed at an average shear load of only 580 ± 41 N.
3.4. Optical assessments after fracture
Microscopic images (Figure 6) reveals PA residues on fractured Al surface. The area of residual PA on Al side exhibited similar geometry to that of corresponding damaged area on the PA side. Traces of Al residues were also detected on the PA side. Therefore, it is assumed that failure is cohesive. Sample “a” exhibits a low value, and inhomogeneous geometrical distribution, of joint area compared to “b”. This can be explained by the increase in thermal contact resistance at the interface, as a result of increased Al surface roughness [13]. Further characterization of the surfaces after fracture and discussion of its link with failure mode and shear strength of the assembly are beyond the scope of this study.
The area of residues/damages on both materials after failure is quantified and assumed to present the joint area. Figure 7 shows a linear relation between the weld joint area, of five differently ablated samples, and their corresponding shear load. A descriptive regression model was generated to describe the relation between all data points. High coefficient of determination (R2) value (0.96) indicates that this linear
relation describes 96% of the variation in response, and features negligible variations in calculated strength. Interestingly, this linear relation highlights a constant shear stress among all tested samples regardless of the laser ablation parameters. The slope of the descriptive regression model denotes a shear stress of 35.44 MPa. Results confirms that laser ablation parameters have a strong influence on the joint area and quality, but no impact on the joint stress at failure.
Figure 7. Relation between shear load and joint area.
4. Conclusion
A design of experiments was developed to investigate the influence of short-pulsed laser ablation parameters to treat Al surface before laser welding to PA6.6. Screening results highlighted the significance of pulse frequency and beam guidance speed on the joint resistance to the applied shear load, with preferences to stochastic structuring geometry. A developed regression model shows a directly proportional linear relation between the shear load and the pulse frequency, and a nonlinear relation with the beam guidance speed. Optimal laser ablation parameters were identified at a spot size of 45 µm, along with a peak pulse power of ≈ 4.75 kW and an overlap ratio of ≈ 68%, which are calculated at pulse frequency of 120 kHz and beam speed of 1750 mm/s.
Joint area was evaluated optically after failure. Results showed that joint area is linearly correlated to joint shear load. This leads to the conclusion that laser ablation parameters have a strong influence on the joint quality, through the value of joint area, but no influence on the joint stress at failure.
Acknowledgments
The authors would like to acknowledge FNR (Luxembourg), and DGO6 (Walloon region, Belgium) for their financial support in this research work through the LaserSTAMP project.
References
[1] J. P. Bergmann and M. Stambke, “Potential of laser-manufactured polymer-metal hybrid joints,” Phys. Procedia, vol. 39, pp. 84–91, 2012. [2] Z. Zhang, J. G. Shan, X. H. Tan, and J. Zhang, “Effect of anodizing
pretreatment on laser joining CFRP to aluminum alloy A6061,” Int. J. Adhes. Adhes., vol. 70, pp. 142–151, 2016.
[3] A. Klotzbach, M. Langer, R. Pautzsch, J. Standfuß, and E. Beyer, “Thermal direct joining of metal to fiber reinforced thermoplastic components,” vol. 022421, no. 806, 2017.
[4] P. Amend, S. Pfindel, and M. Schmidt, “Thermal joining of thermoplastic metal hybrids by means of mono- and polychromatic radiation,” Phys. Procedia, vol. 41, pp. 98–105, 2013.
[5] J. Holtkamp, A. Roesner, and A. Gillner, “Advances in hybrid laser joining,” Int. J. Adv. Manuf. Technol., vol. 47, no. 9–12, pp. 923–930, 2010.
[6] A. Roesner, S. Scheik, A. Olowinsky, A. Gillner, U. Reisgen, and M. Schleser, “Laser assisted joining of plastic metal hybrids,” Phys. Procedia, vol. 12, no. PART 2, pp. 373–380, 2011.
[7] C. Lamberti, T. Solchenbach, P. Plapper, and W. Possart, “Laser Assisted Joining of Hybrid Polyamide-Aluminum Structures,” Phys. Procedia, vol. 56, no. 8, pp. 845–853, 2014.
[8] A. Al-Sayyad et al., “Influence of laser ablation and plasma surface treatment on the joint strength of laser welded aluminum-polyamide assemblies.,” in JNPLI 2017, 2017.
[9] R. L. PLACKETT and J. P. BURMAN, “THE DESIGN OF OPTIMUM MULTIFACTORIAL EXPERIMENTS,” Biometrika, vol. 33, no. 4, pp. 305–325, 1946.
[10] G. E. P. Box and K. B. Wilson, “On the experimental attainment of optimum conditions,” in Breakthroughs in statistics, Springer, 1992, pp. 270–310.
[11] R. H. Myers, D. C. Montgomery, and C. M. Anderson-cook, Response Surface Methodology. 2009.
[12] R. V Lenth, “Quick and Easy Analysis of Factorials Unreplicated,” Technometrics, vol. 31, no. 4, pp. 469–473, 1989.
[13] C. V. Madhusudana, Thermal contact conductance, 2nd ed. Springer, 2014. Sample a Sample b R² = 0.96 0 500 1000 1500 2000 10 15 20 25 30 35 40 45 50 Sh ea r lo ad (N ) Joint area (mm2) Ablated Al Corresponding PA ∆y ∆x ∆y ∆x =35.44 MPa