Evolution of human pitch:
Preliminary analyses in the French population using
INA audiovisual archives of Vox Pops
Alexandre Suire1 & Melissa Barkat-Defradas2 1Post-doctoral Fellow – University of the Ryukyus, Japan
2CNRS Researcher – University of Montpellier, France Introduction
Beyond its linguistic content, the human voice is a formidable tool to convey a wide range of emotions and affective states. Moreover, it also reflects various biological and social information about the emitter such as sex, age, some personality traits and, importantly, his or her socio-cultural background.
Indeed, vocal characteristics are also subjected to the cultural and social expectations of the society the individual belongs to. For instance, van Bezooijen [1] showed that the significant difference in voice pitch observed between Japanese and Dutch women (~230 Hz vs. ~190 Hz respectively) are explained by the fact that they comply to social expectations linked to their gender, which vary considerably between the two cultures. In Japan, traits traditionally associated with femininity include “modesty”, “innocence” and “psychological dependence”. In order to conform to the preferences of men sharing the same cultural representations, Japanese women vocally express these traits by using a higher pitch, which is known to be perceptually associated with impressions of “docility” and “weakness” [2]. Conversely, in a culture where the social roles attributed to men and women are relatively more egalitarian like the Netherlands, Dutch men tend to value traits related to female “independence” and “hard-working”, which result in a preference for women with lower-pitched voices, which are known to be perceptually associated with “self-confidence” and “leadership” [3]. Thus, Japanese and Dutch men show preferences towards culturally congruent voices related to the values attributed to femininity. More generally, it illustrates the idea that voice pitch reflects how a given culture considers men and women social roles.
Interestingly, some evidence suggests that these gender representations have significantly evolved over time, at least for women from Western’s societies. Indeed, several studies have shown that women are increasingly moving away from feminine stereotypes by adopting traits that are generally associated with masculinity, such as competitiveness, independence, leadership, as well as declaring themselves as being more orientated towards higher professional careers [4,5]. In turn, such changes would shift the use of their voices towards a lower-frequency pitch in order to project those impressions, to which men seem to be more attracted nowadays [6]. However, there is currently a strong lack of information on whether voice pitch has evolved or not across a larger span of time to confirm such results.
In this context, audiovisual archives offer a unique opportunity to tackle this issue and the present project aims at exploring the evolution of both men and women voice pitch in the French population as a first study case. For this purpose, we focused on Vox Pops recorded for television news that are most representative of how individuals vocally behave within a
given society at a given time. Therefore, the relevance of this work is twofold: (1) offer an original systematic analysis of how the human vocal pitch has evolved over time and (2) highlight how audiovisual archives can shed light on the evolution of human social behaviors such as speech.
Methods
Voice samples
Voice samples were selected from French speakers interviewed during TV news Vox Pops between 1940 and 2019. These recordings generally took place in public areas, and involved anonymous passers-by who were asked to give their opinion on a particular subject. recordings were provided by the INA (Institut National de l’Audiovisuel, France) as online video clips from which we selected suitable ones for our purpose. The reason for choosing this kind of material is that these individuals’ spontaneous speech were felt to be more representative of the general population than, for instance, interviewers, TV presenters, comedians or singers who have generally a better control of their vocal apparatus.
Clips with high background noise or chaotic vocalizations (e.g. screaming, shouting, laughing, crying…) were excluded. Eventually, 96 video clips were selected. Then, we extracted the audio signals associated from each selected video and saved them as .WAV files for further analyses.
Voice analysis
Speech segmentation and acoustic analyses of audio signals were conducted using Praat v. 6.0.43 [7]. Segmentation consisted in isolating speech samples (i.e. speakers talking) by removing fragments of external noises (i.e. surrounding noises), multi-voicing (i.e. voice overlaps) and non-linguistic vocalizations (e.g. laughter, crying…). For some speakers, multiple speech samples were selected since they could appear several times in the same interview. Then, we used a batch-processing script to measure four parameters of fundamental
frequency (F0, Hz): mean (F0mean), range (F0min and F0max) and F0 contour with its standard
variation (F0sd). Then, we measured the coefficient of variation F0CV, which corresponds to
F0sd / F0mean. This measure represents the logarithmic perception of voice pitch (i.e.
controlling for the effect of magnitude on variability, [6,8]). All F0 parameters were measured using Praat’s autocorrelation algorithm with a search range of 100–500 Hz for women speakers and 75–300 Hz for men speakers. We also measured the duration (s) of each voiced segments. For speakers with multiple voice samples, we averaged all five F0 parameters.
Perceptually, F0mean,F0min and F0max refer to voice pitch while F0sd and F0CV refer to
global intonation. As such, voices with relatively lower F0mean, F0min and F0max will sound
lower-pitched or “deeper” whereas voices exhibiting relatively higher F0mean, F0min and F0max
will sound higher-pitched. Voices with relatively lower F0sd and F0CV will sound more
monotonous whereas voices exhibiting relatively higher F0sd and F0CV will sound more
Note that differences are perceptually noticeable between the two sexes. Women’s voices are significantly higher in pitch than men (approximately twice as much) as well as more expressive. These characteristics are consistent across languages. For instance, mean
pitch (F0mean) of French speaking women vary between 140 and 240 Hz and between 100 and
150 Hz in men [9], while pitch variation F0sd is around 30 Hz in women and 13 Hz in men
[10].
Analyses and results
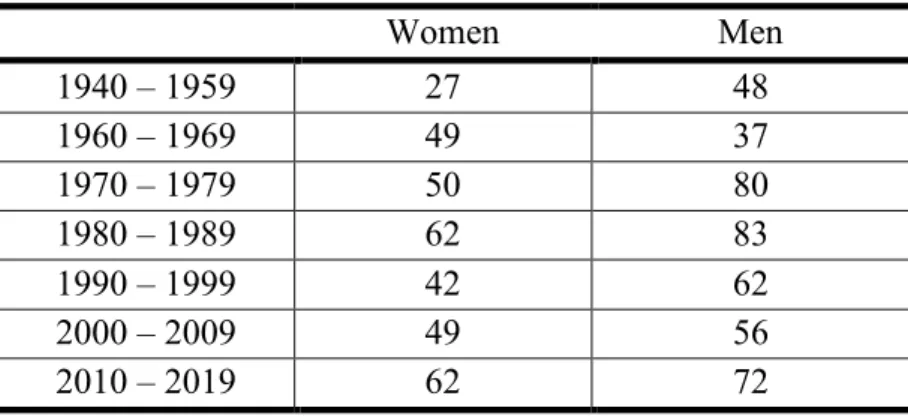
Except for the period 1940 – 1959, women and men’s voices were analyzed separately by decade, from 1960 – 1969, 1970 – 1979, etc. to 2010 – 2019 (see Table 1 for details concerning the number of speakers analyzed for each decade). In total, we analyzed 340 women and 432 men unique speakers across 7 decades. Speech samples averaged a duration of 4.7 seconds (± 4.6).
Table 1. Number of analyzed speakers per sex and decade
ANOVAs (Analyses of Variance) were used to examine the evolution of all F0 parameters over time (i.e. per decade) for each sex. Tukey post-hoc comparisons with Bonferroni’s correction were then performed to look for specific differences between each decade. Results were considered significant at the α = .05 level.
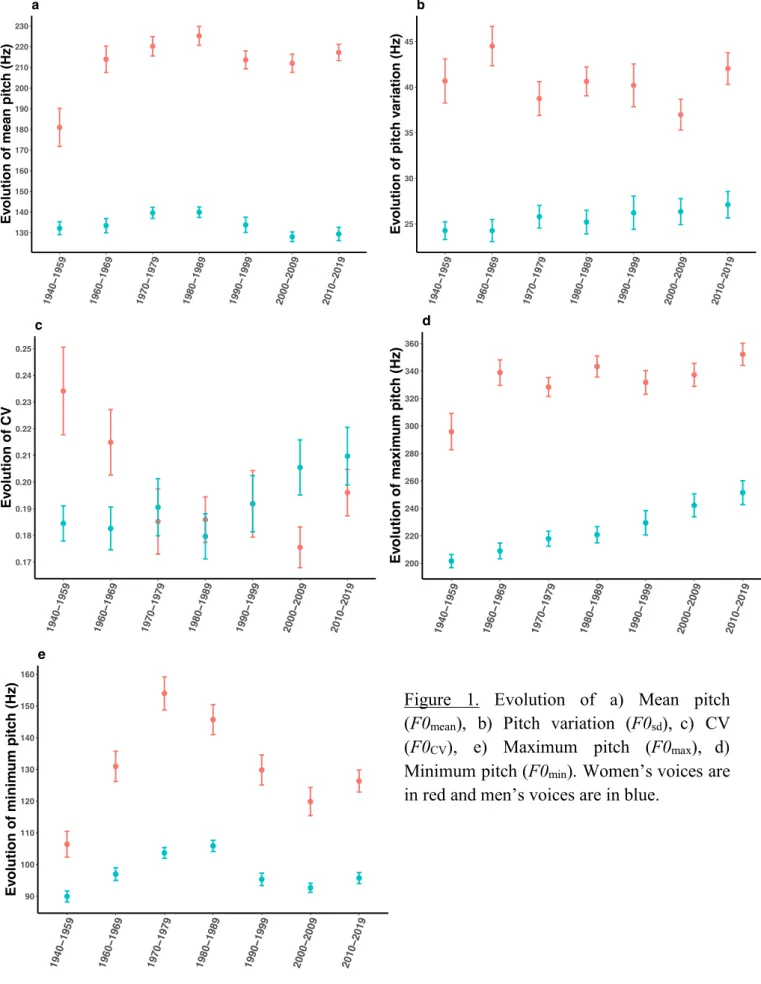
All results are summarized in Figure 1. Mean pitch (F0mean)was significantly higher in
women after 1940 – 1959 (all p < .05) but remained constant after that specific period. In men, no significant increase or decrease was observed between each decade and thus mean pitch
remained constant over almost ~80 years (all p > .05). Pitch variation (F0sd) did not
significantly vary in both women and men across time (all p > .05). Although there was considerable variation, a look at the evolution of CV (F0 coefficient of variation), which corrects for the logarithmic perception of voice pitch [11], shows that it was only significantly
lower between 1940 – 1959 and 2000 – 2009 (p < .05). Women’s F0CV also overlapped the
values observed for men between 1970 – 1979 and 1990 – 1999. In other terms, it appears
that women’s voices became relatively more monotonous over time. Values of F0CV for men
did not significantly change over time (all p > .05). Maximum pitch (F0max) was significantly
higher in women after 1940 – 1959, with another important increase in 2010 – 2019 (all p < .05), while in men it only started to be significantly higher between 2000 – 2009 and 2010 –
Women Men 1940 – 1959 27 48 1960 – 1969 49 37 1970 – 1979 50 80 1980 – 1989 62 83 1990 – 1999 42 62 2000 – 2009 49 56 2010 – 2019 62 72
2019 compared to 1940 – 1959 (all p < .05). Minimum pitch (F0min) significantly increased after 1940 – 1959 in 1970 – 1979 and 1980 – 1989, but significantly decreased after those decades between 1980 – 1989 and 2010 – 2019 (all p < .05). In men, a similar pattern was observed (all p < .05). In summary, these results reveal that women’s voices have evolved higher pitched voices after 1940 – 1959 but remained constant after that. We also observed an
increase in vocal range (i.e. simultaneous increase in F0max and decrease in F0min) and a more
monotonous voice after 1970 – 1979. For men, voice pitch has not significantly changed over time but vocal range also increased after the same period.
Figure 1. Evolution of a) Mean pitch
(F0mean), b) Pitch variation (F0sd), c) CV
(F0CV), e) Maximum pitch (F0max), d)
Minimum pitch (F0min). Women’s voices are
in red and men’s voices are in blue.
130 140 150 160 170 180 190 200 210 220 230 1940 −1959 1960 −1969 1970 −1979 1980 −1989 1990 −1999 2000 −2009 2010 −2019 Ev
olution of mean pitc
h (Hz) a 25 30 35 40 45 1940 −1959 1960 −1969 1970 −1979 1980 −1989 1990 −1999 2000 −2009 2010 −2019 Ev olution of pitc h v ariation (Hz) b 0.17 0.18 0.19 0.20 0.21 0.22 0.23 0.24 0.25 1940 −1959 1960 −1969 1970 −1979 1980 −1989 1990 −1999 2000 −2009 2010 −2019 Ev olution of CV c 90 100 110 120 130 140 150 160 1940 −1959 1960 −1969 1970 −1979 1980 −1989 1990 −1999 2000 −2009 2010 −2019 Ev olution of minim um pitc h (Hz) e 200 220 240 260 280 300 320 340 360 1940 −1959 1960 −1969 1970 −1979 1980 −1989 1990 −1999 2000 −2009 2010 −2019 Ev olution of maxim um pitc h (Hz) d
Discussion and future perspectives
Our study shows that voice pitch (F0mean) in both men and women has little evolved over time
(Figure 1a). Those results seem to contradict the hypothesis of a female vocal masculinization,
as initially suggested. In this context, we suggest two possible explanations. First, F0mean may
not be the most reliable acoustic parameter to study the evolution of voice over time as it captures relatively little information on how an individual vocally behaves (i.e. static cue). Second, lack of significant changes could also be explained by an important factor we did not control for: individuals could use their voice pitch differently depending on their social positions such as a lower and a higher voice pitch in high- and low-ranking individuals, respectively [3,11,12]. Indeed, some studies showed the existence of a link between vocal characteristics and social class [13–15]. Here, the relevance of INA archives (and any other audiovisual archives for that matter) should be underlined since a detailed analysis of available visual data could be particularly useful to verify the validity of this hypothesis. For instance, a fine-grained analysis of clothes could allow us to infer the interviewed individual’s social background and account for an original method to further investigate this topic.
Nonetheless, considering more dynamic acoustic criteria (i.e. F0sd, F0CV, F0min,
F0max,) revealed interesting patterns. Figure 1d and 1e (i.e. F0min and F0max) show that both
men and women’s vocal range increased (simultaneous increase of F0max and decrease of
F0min) from the 1970’s to nowadays. Considering that F0mean and F0sd did not change
significantly, we could interpret these results by suggesting that there are two “vocal profiles” coexisting within both sexes of the French population. All things being equal, this would mean that a part of the population progressively spoke over time in a more lower pitch register and another in a higher pitch register. Again, one possible explanation we suggest is that different social classes are using different ways to express themselves, which became more marked over time. Otherwise, this could also partially confirm that, at least in some parts of the population, there has been a “female vocal masculinization” and, unexpectedly, a
“male vocal feminization”. Along with results of a respective decrease and increase in F0CV in
women and to a lesser extent men (which are considered to be respectively a masculine and feminine vocal trait [16]), such results occurring from the 1970’s could be interpreted by the fact that some men and women started to depart themselves vocally from the social expectations attributed to their sex and gender at the very beginning of the 1960’s because of the relaxation of social taboos and norms [17]. Indeed, the culture of decades prior to the 1960’s was described as being unable to contain the demands for greater individual freedom, which saw people breaking free of the social constraints through extreme deviation from the norm. This major socio-historical phenomenon has been studied in the context of several domains, but our study could be, to our knowledge, the first one to investigate its effect on the human voice. Therefore, our work allows us to hypothesize that the evolution of vocal characteristics may be considered as a reliable sign of cultural evolution.
Although results are few, the current study offers a more systematic analysis on the evolution of voice pitch in both men and women. Cross-sectional studies are particularly important because they answer questions regarding the evolution of human behavior. As such, the use of audiovisual archives for that purpose is useful and extremely precious. In this context, we suggest two avenues for further research. Firstly, other acoustic parameters
should be given attention as the human voice cannot be defined solely on the basis of voice pitch and modulation but also on timbre (vocal resonances), quality (roughness, breathiness…) and rhythm (speech tempo). Furthermore, as all languages can significantly differ across all these aspects, comparing the evolution of voices from different cultures is a particularly interesting aspect. Indeed, this could give us important cues on how gender and social roles have evolved over time across each culture.
Acknowledgments
We would like to thank the INA for providing us access to the audiovisual archives. We would also like to thank the International Federation of Television Archives for funding and allowing us to realize this original study.
Access to data
Data can be requested by sending an email to Alexandre Suire: alexandresuire@hotmail.fr
References
1. van Bezooijen R. 1995 Sociocultural Aspects of Pitch Differences between Japanese
and Dutch Women. Language and Speech 38, 253–265.
(doi:10.1177/002383099503800303)
2. Pisanski K, Rendall D. 2011 The prioritization of voice fundamental frequency or
formants in listeners’ assessments of speaker size, masculinity, and attractiveness. The Journal of the Acoustical Society of America 129, 2201–2212. (doi:10.1121/1.3552866)
3. Klofstad CA, Anderson RC, Peters S. 2012 Sounds like a winner: voice pitch
influences perception of leadership capacity in both men and women. Proceedings of
the Royal Society B: Biological Sciences 279, 2698–2704.
(doi:10.1098/rspb.2012.0311)
4. Cashdan E. 2008 Waist-to-Hip Ratio across Cultures: Trade-Offs between Androgen-
and Estrogen-Dependent Traits. Current Anthropology 49, 1099–1107. (doi:10.1086/593036)
5. Donnelly K, Twenge JM. 2017 Masculine and Feminine Traits on the Bem Sex-Role
Inventory, 1993–2012: a Cross-Temporal Meta-Analysis. Sex Roles 76, 556–565. (doi:10.1007/s11199-016-0625-y)
6. Pisanski K, Oleszkiewicz A, Plachetka J, Gmiterek M, Reby D. 2018 Voice pitch
modulation in human mate choice. Proceedings of the Royal Society B: Biological Sciences 285, 20181634. (doi:10.1098/rspb.2018.1634)
7. Boersma, P., & Weenink, D. 2017 Praat: Doing phonetics by computer [Computer
software].
8. Fouquet M, Pisanski K, Mathevon N, Reby D. 2016 Seven and up: individual
differences in male voice fundamental frequency emerge before puberty and remain stable throughout adulthood. Royal Society Open Science 3, 160395. (doi:10.1098/rsos.160395)
9. Vaissière J. 2015 La phonétique. Paris: Presses universitaires de France.
competitive and courtship contexts and its relation to mating success. Evolution and Human Behavior 39, 684–691. (doi:10.1016/j.evolhumbehav.2018.07.001)
11. Anderson RC, Klofstad CA. 2012 Preference for Leaders with Masculine Voices
Holds in the Case of Feminine Leadership Roles. PLoS ONE 7, e51216. (doi:10.1371/journal.pone.0051216)
12. Mayew WJ, Parsons CA, Venkatachalam M. 2013 Voice pitch and the labor market
success of male chief executive officers. Evolution and Human Behavior 34, 243–248. (doi:10.1016/j.evolhumbehav.2013.03.001)
13. Pittam J. 1994 Voice in social interaction. Sage.
14. Madsen LM, Svendsen BA. 2015 10 Stylized voices of ethnicity and social divisions. ,
24.
15. Trudgill P. 1997 The social differentiation of English in Norwich. In Sociolinguistics,
pp. 179–184. London.
16. Leongómez JD, Binter J, Kubicová L, Stolařová P, Klapilová K, Havlíček J, Roberts
SC. 2014 Vocal modulation during courtship increases proceptivity even in naive
listeners. Evolution and Human Behavior 35, 489–496.
(doi:10.1016/j.evolhumbehav.2014.06.008)
17. Debolt AA, Baugess JS. 2011 Encyclopedia of the Sixties: A Decade of Culture and