HAL Id: halshs-00727621
https://halshs.archives-ouvertes.fr/halshs-00727621
Submitted on 4 Sep 2012
HAL is a multi-disciplinary open access
archive for the deposit and dissemination of sci-entific research documents, whether they are pub-lished or not. The documents may come from teaching and research institutions in France or abroad, or from public or private research centers.
L’archive ouverte pluridisciplinaire HAL, est destinée au dépôt et à la diffusion de documents scientifiques de niveau recherche, publiés ou non, émanant des établissements d’enseignement et de recherche français ou étrangers, des laboratoires publics ou privés.
Innovation, structural change and productivity growth.
Evidence from Italian regions, 1980-2003
Francesco Quatraro
To cite this version:
Francesco Quatraro. Innovation, structural change and productivity growth. Evidence from Italian regions, 1980-2003. Cambridge Journal of Economics, Oxford University Press (OUP), 2009, 33, pp.1001-1022. �halshs-00727621�
Innovation, Structural Change and Productivity Growth
Evidence from Italian Regions, 1980-2003
1Francesco Quatraro
Bureau of Research on Innovation, Complexity and Knowledge (BRICK) Collegio Carlo Alberto, Moncalieri (Torino)
and
Laboratory of Economics of Innovation “F. Momigliano” Department of Economics
University of Turin
Via Po 53, 10124 Turin, Italy Tel. +390116704980
Fax +390116703895
francesco.quatraro@unito.it
ABSTRACT
This paper develops a Schumpeterian approach to structural change, by grafting the role of business cycles and creative destruction into the growth retardation theory. The context of the empirical analysis is represented by the growth path of 20 Italian regions over the period 1981-2003, in the light of the transition towards the knowledge-based economy. The results strongly support our hypotheses: 1) early-industrialized areas are fully involved in the generalized movement towards the knowledge-based economy. 2) In late-industrialized areas, due to the delayed expansion of manufacturing activities, productivity growth and innovation takes place within manufacturing sectors.
JEL Classification Codes: O33, R11.
Keywords: Structural change, growth retardation, innovation, regional productivity growth
1 Introduction
Most advanced countries have been facing a process of dramatic reshaping of economic activity for the last two decades. Indeed, a wide body of empirical literature has provided evidence of a widespread transition towards the so-called knowledge-based economy (Freeman and Soete, 1997).
Such evidence has stimulated an increasing cross-fertilization between the analysis of structural change and the economics of innovation and technological change, and contributed to the resurgence of interest in the dynamics of economic change within economics. A possible reason may be ascribed to the powerful interpretative ground provided by the structural change approach, in particular with respect to the understanding of path-dependence in economic development and of cross-country differences in technology adoption (Silva and Teixeira, 2008).
The focus on structural change is especially relevant when analyzing the rise of the knowledge economy. Indeed, the increasing weight gained by service sectors represents a crucial complementary factor contributing to renewed productivity growth in the new economy (Griliches, 1994; Jorgenson, 2001; Antonelli, 2003; Broersma and van Ark, 2007).
Yet, empirical contributions have basically neglected the role of the change in economic structure that is necessary in order to adapt to changes brought about by technical progress. For this reason, this paper aims at investigating the shift towards the knowledge based economy by looking at the relationships between innovation, structural change and productivity growth.
We adopt a Schumpeterian view of the process of innovation, according to which economic agents are likely to innovate as a reaction to unexpected changes within the economic environment (Schumpeter, 1947). Innovative behaviour emerges within a stage of the business cycle, when economic growth has reached its maximum, and spreads across the system unless the expected profitability declines (Schumpeter, 1939).
This approach needs however to be integrated so as to give full consideration to the role of structural change within the broader process of economic development. The grafting of Schumpeter’s legacy into the retardation theory articulated by Simon Kuznets (1930), allows for the qualification of innovative behaviour in the light of the endless process of structural change which characterizes modern economic growth. The shift of employment towards new sectors feeds the shift of innovation capabilities. Industries whose retardation is not yet accomplished are still able to enjoy high rates of innovation activities. On the contrary, industries experiencing the slowdown are characterized by a migration of the entrepreneurial ability towards the new emerging sectors.
Within this framework, one is able to appreciate the uneven distribution of growth rates not only across sectors, but also across different geographical areas within the same sector. Innovation and retardation are strictly intertwined, and the economic performances of regions are linked to the stage of development of their leading industry. In late-industrialized areas aggregate productivity growth is still expected to be driven by manufacturing industries, and innovative efforts are undertaken to creatively respond to the dynamics of employment within service sectors.
Early-industrialized areas are instead likely to succeed in the transition to the knowledge economy, as long as both service sectors and the complementary technologies are properly developed.
The focus of the analysis is on the re-allocation of labour force across different sectors, investigating the way it affects aggregate productivity growth and the level of patenting activity. The context of the analysis consists of the growth path of 20 Italian regions in the period 1980-2003. The Italian case provides a good benchmark to investigate the effects of differential stages of development on economic and innovation performances. Indeed, the comparison between the employment dynamics in manufacturing and service sectors in Italy, the U.K. and the U.S. shows that the decrease of manufacturing share of value added in the former is far slower than in the US and in the UK. As a result, the share of manufacturing industries in Italy turns out to be still high in the late 1990s, while that of service sectors increases very slowly (Antonelli et al., 2007). Within this context, the features of Italian regions are such that they reproduce the economic and industrial dualism between early- and late-industrialized countries (Fuà, 1980). On the one hand North-Western regions have been the cradle of modern industrial firms, while on the other hand North-Eastern and Central regions have been historically characterized by a delayed diffusion of the manufacturing base during the 1960s and the 1970s (Fuà and Zacchia, 1983).
In this context the contribution of this paper is twofold. On the one hand, it provides an attempt to integrate in a single theoretical framework two high complementary strands of analysis, which have been separated for decades, i.e. Kuznets’ retardation theory and Schumpeter’s theory of innovation. On the other hand, it aims at rejuvenating a field of enquiry that has been lacking appropriate consideration since the 1980s. For this reason the debate about the economic development of Italian regions has somehow missed the opportunity to investigate cross-regional differences in the light of the economics of innovation.
The remainder of the paper is organized as follows. In Section 2 we outline the theoretical framework, articulating the relationship between productivity growth, structural change and innovation. Section 3 presents the features of the economic context which represents the backdrop of the analysis. In Section 4 the data and the methodology are described, while in Section 5 we show the results of the econometric analysis. Finally some concluding remarks follow in Section 6.
2
Theoretical Framework
The importance of structural change to the process of economic growth is hardly new to economic analysis. Empirical and theoretical works addressing this issue may be dated back to the 1930s (Kuznets, 1930; Burns, 1934). More recently the effects of structural change on productivity growth have received renewed attention. On the one hand, some studies dealt with technological change by focusing on the consequences of both the changing specialization of national economies in favour of “hi-tech” activities, and the gap with countries specialized in “low-tech” activities (Fagerberg, 1994 and 2000). On the other hand, some authors investigated the effects of structural change on the returns to R&D activity and on the tendency of the rate of profit to fall (Frantzen, 2000; Wolff, 2003).
The interplay between Schumpeterian dynamics and retardation theory enhances the understanding of differences in the transition towards the knowledge-based economy in different areas. Indeed innovation represents the main engine of economic progress within the capitalistic system (Schumpeter, 1928 and 1939). Moreover such an engine is constantly switched on, as “the opening up of new markets, foreign or domestic, and the organizational development […] illustrate the same process of industrial mutation […] that incessantly revolutionizes the economic structure from within, incessantly destroying the old one, incessantly creating a new one” (Schumpeter, 1942: p.83).
Kuznets himself stressed the bearing of Schumpeter’s approach upon the analysis of structural change. He noted that the process of creative destruction entails two parts, the creation of new combinations on the one hand, and the destruction of the old ones on the other hand. The introduction of radical innovations alters the structure of the economy, creating new jobs and making the existing ones obsolete. This in turn engenders a dislocating effect upon employment, which tends to shift from the old sector to the new one, with major difficulties in terms of switching costs (Kuznets, 1972).
Economic agents operate in environments shaped by the conditioning influence of factors both internal and external to the economic system. When there is an unexpected change in one or more of these factors, economic agents have to adjust2. The way this happens may reside either within the comfortable borders of the existing practice, or outside its range. Creative response is an adaptation effort carried out by doing something completely new, which alters the data of the system (Schumpeter, 1939 and 1947).
Innovation emerges out of the process of competition within the capitalistic system, as an outcome of the creative response. Economic performances and innovation performances are characterized by complementary cycles. Innovating activities appear to be clustered in time, long after the expanding stages of the industry. Such a lag is due to a delayed diffusion of entrepreneurial ability among firms within the sector (Schumpeter, 1939).
The bringing about of innovation is a specific task of the entrepreneur, who is the one getting things done by bearing the risk of putting resources to untried uses (Schumpeter, 1911 and 1928). The scope for profiting from innovating is what pushes the entrepreneur to choose to creatively react rather than passively adapt. These profits however are not indefinitely available in the industry, but are instead temporary. The competing down process is likely to deter further innovation efforts (Schumpeter, 1939 and 1942). The decision to innovate holds as long as the benefits are larger than the costs. When a saturation level is reached, in which the expansion on the supply side goes faster than that on the demand side, innovation efforts are likely to gradually fade out3.
While Schumpeter’s analysis of the cyclical behaviour of economic and innovation activities received major criticisms, mainly concerning his methodology, it had the merit of drawing attention to the role of innovation in the process of structural change (Kuznets, 1940). In particular, in his 1939 book Schumpeter focused on three countries4, showing that the process of economic development was led by five industries and three institutional innovations5. Thus in his work is found the concept of “leading sector”, which was common to other authors in the same years, such as Kuznets and Burns (Rostow, 1975).
What was missing in Schumpeter analysis was the explicit appreciation of the process of structural change, and of how and why it takes place. This was instead among the main concerns of the growth retardation theory articulated by Kuznets6. According to this view, growth rates are unevenly distributed across industries, and economic performances of countries (or regions) are strictly related to the dominant industry within the area.
As Kuznets put it, “some nations seem to have led the world at one time, others at another. Some industries were developing rapidly at the beginning of the century, others at the end. Within single countries or within single branches of industries […] there has not been uniform, un-retarded growth” (Kuznets, 1930: p.3). Hence the economic leadership may shift from one country to another, as an effect of the
reduction of industry growth rates, which in turn causes the lead in development to
shift from one branch to another: “The main reason for the shift seems to be that a rapidly developing industry does not continue its vigorous growth indefinitely, but slackens its pace after a time, and is overtaken by industries whose period of development comes later” (Kuznets, 1930: p.5).
Hence industry growth rates are expected to decline over time, and then those industries whose period of development comes later are likely to overtake the mature ones. This implies that one should observe an alternation of leading industries and of leading countries as well. Such diversity across industries generates a process of change in the economic structure of production, in terms of relative composition of activities. Differential growth rates across branches of an industry are hence likely to create structural change.
The change of leading sectors is the engine of structural change. This latter may be viewed as a multidimensional concept, in that “major aspects of structural change include the shift away from agriculture to non-agricultural pursuits and, recently, away from industry to services; a change in the scale of production units, and a related shift from personal enterprise to impersonal organization of economic firms” (Kuznets, 1973: p.248).
It therefore seems clear that economic performances of an area are strictly related to the performances of its leading industry. The change in the economic structure, in the sense of a change in the allocation of employment across different industries, is likely to shape and eventually rejuvenate the dynamics of productivity growth7. Within each industry the process of Schumpeterian competition is likely to shape the dynamics of innovating behaviour.
A sequence between creative reaction and creative destruction can be detected. Firms within the established sector begin to innovate as soon as the room for further expansion gets smaller. Firms innovate to adjust to changes in the environment they operate in, so as to preserve or to gain further market shares. Innovation becomes systematic as opposed to sporadic: a local innovation system emerges, where relevant knowledge externalities become available and firms rely upon the introduction of innovation as a source of competitive advantage. When the number of innovating firms increases but the productivity growth rate within the industry keeps on reducing, the boosting effect upon innovation disappears8, and innovation efforts are then directed outside. Creative destruction emerges as the force creating a new structure to the detriment of the old one.
Growth rates are unevenly distributed not only across industries, but within the same industry they are unevenly distributed across different regions. Thus one would expect
the process of economic growth to be driven by different sectors in different regions. By the same token, one would also observe different kinds of innovation dynamics within each region, according to the relative evolution of the economic structure.
INSERT FIGURE 1 ABOUT HERE
The feedbacks between retardation of growth rates and Schumpeterian competition thus give rise to a self-propelling process featured by endless economic change, as shown in Figure 1.
The framework provided so far leads us to spell out two hypotheses: 1) in early-industrialized areas, the growth enhancement effect of manufacturing activities is exhausted, while the shift towards service-based activities is still at the early stages. On the other hand, in late-industrialized areas, productivity growth is still driven by manufacturing industries, despite the generalized movement towards the knowledge-based economy. 2) For this reason in late-industrialized areas manufacturing sectors are the main driver of innovation activities. Firms still maintain that it is worth putting effort in innovations to react to changes in the economic environment. In early-industrialized areas, the scope for innovation within the manufacturing sector is very low or null, so that the innovation efforts are directed outside. The migration away from manufacturing and towards the new emerging industries gains momentum. The industrial base is shrinking and the advantages from knowledge externalities are declining.
3
The Italian Context
The Italian economist Giorgio Fuà (1980), along the lines of Kuznets’ thought, showed that in the early 1980s Italy had characteristics typical of a late-industrialized economy. Late industrialized countries are defined as those countries whose process of economic development took off during the 19th or the 20th century. Their main features are a comparative low level of total factor productivity (TFP), a strong weight of traditional sectors and the polarization of firms around two types. On the one hand there is a small number of modern firms with high level of TFP, high wages and advanced managerial capabilities which are already active in science based sectors. On the other hand there is a large number of traditional firms with low TFP and backward technology and management. Such firms survive making extensive use of a low-wage workforce and avoiding fiscal burdens.
Italy at that time was late industrialized with respect to the diffusion of manufacturing sectors and modern firms. However the aggregate dynamics proved to hide a marked structural heterogeneity within the national context.
Indeed, in the 1950s most Italian regions were rural, and populated by a large share of small- and medium-sized enterprises, as opposed to North-Western regions which specialized in manufacturing activities, carried out by large firms. Analyzing the distribution of growth rates and structural change at the regional level in the period 1950-1970, the Ancona School identified and found the clues of a successful diffusion process of manufacturing activities towards such rural regions in the North-East and eventually in Central Italy, along the Adriatic coast. For this reason they proposed to group such regions into a larger macro-area which has been eventually called NEC (North-East-Centre)9. At the same time, the growth of manufacturing industries was
slowing down in the North-West, wherein the growth of business service industries was already in nuce (Pettenati, 1991; Fuà and Zacchia, 1983)10.
Different factors were proposed in the 1970s as conducive to the peculiar territorial diffusion of manufacturing activities towards the NEC. On the one hand it has been argued that the widespread presence of small- and medium-sized firms contributed to create a favourable environment, characterized by low costs of living, intense utilization of labour potential, and the persistence of quite informal labour relationships. Firms in turn benefited from these peculiarities in terms of lower costs and better business efficiency. Moreover they maintained that the small size scale and the specialization in labour-intensive activities, permitted in many ways swifter adaptation to changes in markets and technologies (Fuà, 1983, 1991a and 1991b; Fuà and Zacchia, 1983; Garofoli, 1981 and 1983).
On the other hand the relevance of the features of the social texture has been stressed, whereby the traditions rooted in the sharecropping system largely drawing on the informal institution of the “extended family” were persisting. The gradual diffusion of manufacturing did not seem to be paralleled by a simultaneous change of the social organization. Low wages and temporary jobs were accepted because of the weakness of the labour market as an institution, substituted by the “extended family” which worked as a real self-regulatory system. In such a context dynamic pressures and attitude toward self-employment represented a key factor for the successful creation of manufacturing enterprises (Paci, 1973 and 1992)11. The boosting role of institutional factors (above all embedded in the labour market) and the peculiarities of the economic structure, were maintained to lead to the set of positive-feedbacks well described by the industrial district theorists (Brusco, 1982; Becattini, 1989).
More recent evidence shows that the Italian economy has retained its delay in the industrialization process also during the last decades of the 20th century. A closer look to the evolution of industrial specialization in the two areas has revealed the existence of significantly different regional patterns. Indeed, NEC regions show persistent increasing rates of specialization in manufacturing activity during the 1980s and 1990s, while in the North-West the weight of manufacturing sectors decreases (Becattini and Coltorti, 2006). It seems therefore that at the turning of the century NEC regions are characterized by specialization indexes very close to (and in some cases even higher than) the values featuring North-Western regions. Furthermore, empirical analyses have also shown that the differential dynamics of manufacturing sectors in the two areas are strictly related to the evolution of regional innovation capabilities (Quatraro, 2008).
4
Data and Methodology
In order to test the hypotheses articulated in Section 2, we drew the data from two sources. The first is the National Bureau of Census (ISTAT). Unfortunately this source presents some limitations regarding the extension of detailed data. Longer time series (1980 – 2003) are available at the regional level, but just for five macro-sectors. The five sectors are agriculture and fisheries (ISIC 011-050), manufacturing (ISIC 151-3720), constructions (ISIC 451-4550), financial intermediation, real estate, renting and
business activities (ISIC 651-749), wholesale and retail, hotels and communication, transports and communication (ISIC 501-642).
Further levels of detail are available at the regional level, but starting from 1995. We then focused the attention upon two service sectors, i.e. the Informatics (ISIC 72) and
the Communication (ISIC 64) service sectors12. The ISTAT also provides the regional breakdown of R&D statistics, articulated in public and private R&D expenditure, though the first observed year is 1982. We use data about value added, number of employees, gross fixed investments, and labour income to calculate regional multi-factor productivity (see Appendix) and eventually assess its response to structural change13.
The extent to which such a mutation is likely to engender an adaptation effort, sustained by innovative activity, can be investigated by looking at patent applications. To this purpose we have also drawn data from the European Patent Office (EPO) relative to the number of patent applications submitted in the period 1981-2003, by region.
The limits of patent statistics as indicators of innovation activities are well known. The main drawbacks can be summarized in their sector-specificity, the existence of non patentable innovations and the fact that they are not the only protecting tool14. Moreover the propensity to patent tends to vary over time as a function of the cost of patenting, and it is more likely to feature large firms (Pavitt, 1985; Griliches, 1990). Nevertheless, previous studies highlighted the usefulness of patents as measures of production of new knowledge, above all in the context of analyses of innovation performances at the regional level (Acs et al., 2002). Besides the debate about patents as an output rather than an input of innovation activities, empirical analyses showed that patents and R&D are dominated by a contemporaneous relationship, providing further support to the use of patents as a good proxy of innovation (Hall et al., 1986). Moreover, the application to the European Patent Office is a time- and resource-consuming process, which is likely to exert an ex-ante selection of the innovations to be patented. This allows us to identify high-value innovations stemming from systematic and more formalized innovation efforts, which are the object of our analysis.
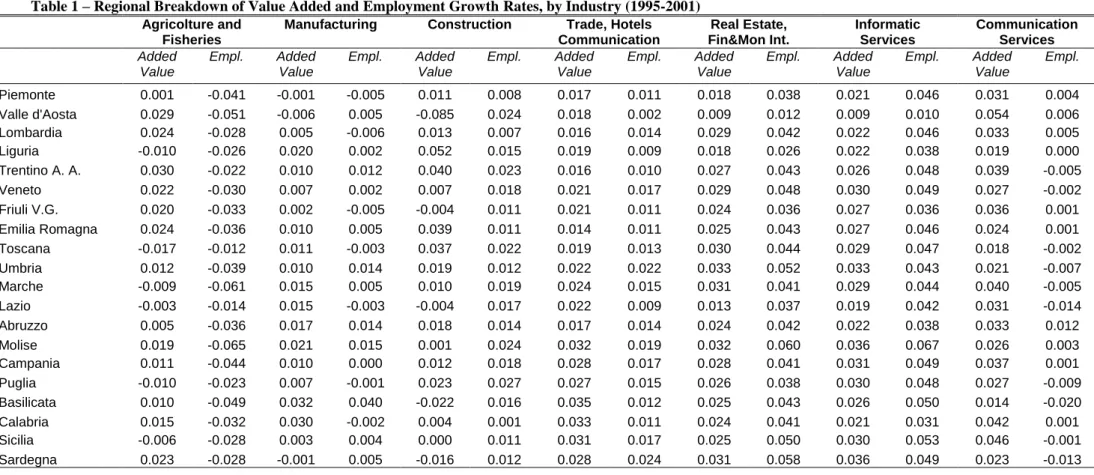
In Table 1 we report the industrial and regional breakdown of annual average growth rates of value added and employment, in the period 1995-2001. In the first five columns the data are at the macro-sector level. Let us focus on manufacturing and service sectors. As far as the former are concerned, employment growth rates are negative in North-Western regions like Piedmont (-0.5%) and Lombardy (-0.6%). Value added followed coherent dynamics in Piedmont (-0.1%), while in Lombardy it grew, even though at a far lower rate (+0.5%) than in other regions in the North-East-Centre. The Aosta Valley is instead characterized by decreasing value added and increasing employment, while the Liguria region shows a comparative higher growth rate of value added (+2%) and a quite contained increase of employment (+0.2%). On the opposite, within the NEC area manufacturing sectors are characterized by quite generalized positive dynamics. In Trentino value added and employment grew respectively at 1% and 1.2%, while in Veneto the evidence is less pronounced (+0.7% and +0.2%). Down along the Adriatic coast, manufacturing value added in Emilia Romagna grew at an average rate of 1%, while employment growth rate is 0.5%. The evidence is even more striking in Central regions like Marches, Abruzzi and Molise, where the growth rate of value added ranges form 1.7% to 2.1% and that of employment reaches 1.5%.
INSERT TABLE 1 ABOUT HERE
For service sectors (columns 4 and 5) there are not clear-cut geographical patterns. Both value added and employment growth rates are positive in all Italian regions. This
is particularly striking in the case of financial intermediation services, where the growth rates reach 5.8% per year. In the last two columns we investigate the dynamics of the informatics and the communication service sectors. The first sector shows very high growth rates of employment, as compared to the latter. Even in this case in all Italian regions the figures range from +3.1% to +6.7% (with the only exception of Valle d’Aosta). The growth of employment in the service sectors related with informatics and communication therefore appears to be a pervasive phenomenon, and is especially relevant in the case of the former. For value added, the difference among the two sectors appears to be less pronounced, but even in this case growth rates are comparatively higher than those we have seen above in the macro-sectors.
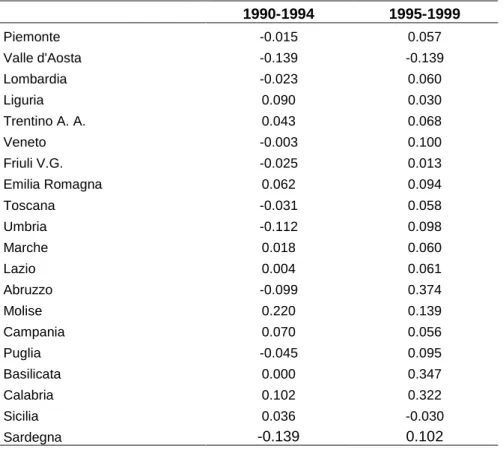
The evidence for patent applications is reported in Table 2. The difference between North-Western and NEC regions is quite marked in the first half of the 1990s. Indeed in Piedmont patent applications decreased of about 1.5%, and in Lombardy 2.3%. In contrast, Trentino shows a growth rate of 4.3%, followed by the Marches (1.8%) and Emilia Romagna (0.6%). The difference is slightly reduced in the late 1990s for North-Western and North-Eastern regions, while patent application keep on growing at faster rates in Central regions15.
INSERT TABLE 2 ABOUT HERE
The clues for the process of structural change are thus quite evident in the Italian case. Such a mutation takes the shape of a growing transition towards the knowledge-based economy. While North-Western regions are completely involved in the process, the NEC regions seem instead to be still characterized by a (delayed) diffusion of manufacturing activities, which coevolves with the rise of service sectors and is likely to shape innovation activities of firms within the late-industrialized regions16.
4.1
Methodology
The analysis we carried out in this paper is articulated in two stages. Firstly we test the
hypothesis about the relationship between structural change and productivity growth,
through the relationship between the change in the employment mix and the growth of TFP. According, among others, to Fabricant (1940 and 1942), Fagerberg (2000) and Metcalfe et al. (2006), when structural change is at stake, what deserves to be investigated is the impact of the change in the employment share of each sector. The basic econometric specification is the following:
dlogTFPit/dt = αi + β1(logTFPi,t-1) + β2(dlogAGRi,t-1/dt) + (1) + β3(dlogMANi,t-1/dt) + β4(dlogCONi,t-1/dt) +
+ β5(dlogTRADEi,t-1/dt) + β6(dlogFINi,t-1/dt) + ui
In so doing we exploit both the time (t) and space (i) dimension in the panel data of Italian regions in the period 1980 – 2001. As noted above, this analysis considers the change in the employment share in the five macro-sectors (Agriculture, Manufacturing, Construction, Trade-Hotels-Restaurants, Real Estate – Financial and Monetary Intermediation). The variable logTFPi,t-1 is meant to control for mean reversion effects.
This first estimation intends to provide the frame within which we put the analysis carried out on more disaggregated data, but on a shorter time span. Although having data over only the period 1995 – 2001 may create some problems, we estimate the following panel data model:
dlogTFPit/dt = αi + β1(logTFPi,t-1) + β2(dlogMANi,t-1/dt) (2) + β3(dlogINFOi,t-1/dt) + β4(dlogCOMi,t-1/dt) + ui
Where i still refers to the regions. It is basically similar to the previous model, except for the variables dlogINFOt/dt and dlogCOMi/dt, which are respectively Informatics
and R&D services and Logistic and Communication services. Moreover, the model in
equation (1) has also been estimated by splitting the whole sample in three geographical areas corresponding to North-West, North-East-Centre and South. It must be noted that all the models will also be estimated on the pooled sample, in order to check for the robustness of the results.
It is worth emphasizing that a narrower focus on the second half of the 1995 is not merely due to data constraints. Actually in the second half of the 1990s the early clues of the transition process affecting Italy can be found. Such a process is characterized by the decline of manufacturing sectors and the rise of service ones, leading the system towards the so called knowledge economy (Antonelli and Militello, 2000; Berta, 2004). Indeed in the post-1995 the change in relative prices yielded negative effects on productivity, witnessing a general difficulty of the system in adapting to the changing environment (Quatraro, 2006).
The second stage of the analysis is meant to test the hypothesis according to which
mutation in economic environment is likely to engender a creative reaction ending up in the introduction of innovations. For this work, we are interested in investigating the
relationship occurring between the dynamics of labour shares for each sector and patenting activity. It is quite evident that this kind of analysis should be limited to considering just manufacturing and service sectors, since the probability of generating a patent within the agriculture and construction sectors is very low. Moreover, it must be considered that the process of switching from agriculture to manufacturing has long been completed in Italy, while the direct comparison of manufacturing and services is of interest now. In view of this, we estimate the following regressions:
it it t i t i it X Z year Y ' ,1 ' ,1 (3) Where Yit is the number of patent applications as a proxy of innovative activity, Xit is the vector of variables related to the share of each sector, in particular manufacturing,
trade, accommodation and communication and real estate, financial and monetary intermediation sectors, αit is the fixed effect and νit the error term. The vector Zit refers instead to control variables. Indeed, patent applications can be viewed as outcomes of a peculiar production process, whose main inputs are R&D expenditures (Griliches, 1979). For this reason we include in our econometric specification two variables:
BERDIND, i.e. the ratio between regional private R&D expenditure and GDP; GOVERDIND, i.e. the ratio between regional public R&D expenditure and GDP. All
dependent variables in the estimation are lagged one year, in order to reduce the risk of spurious correlations. We also control for the time trend by including the variable year.
The equation (3) is subsequently estimated by splitting the sample firstly in two periods, i.e. distinguishing between data before and after 1995. Finally we carry out the estimations by distinguishing three macro areas, in the same vein as above, to check for systematic differences between North-Western and North-Eastern and Central regions.
5
Econometric Results
5.1 Structural Change and Productivity Growth
In the first two columns of Table 3 we report the preliminary results of estimations of Equations (1). We carried out fixed effects estimations to control for cross-regional heterogeneity. OLS estimation on pooled data is also run in order to check for the robustness of the results. Controlling for regional fixed effects, the only significant coefficient for traditional sectors is for the growth rate of employment share in the
construction sector, which is negatively related to the growth rate of TFP. The evidence
about service sectors is very interesting. The coefficient on real estate, financial and
monetary intermediation is indeed systematically positive and significant, meaning that
an increase in the employment share of the sector determines an increase in TFP growth rates. This may well mean that at the aggregate level the increasing share of service sectors is likely to feed virtuous dynamics. On the contrary, the trade, hotel and
communication sector shows up a negative and significant coefficient only in the fixed
effect estimations.
INSERT TABLE 3 ABOUT HERE
In the last two columns of Table 3 we report the estimations of Equation (2) that, due to data constraints, narrow the focus of the analysis on the period 1995 – 2001. The results of such analysis dramatically change the scenario. Indeed the informatics and R&D sector does not show a significant coefficient, while the logistic and communication services turn out to positively affect TFP growth. This means that at least in the late 1990s at the aggregate level the informatics sector still had to be properly developed (and this would provide an explanation to the difficulties of Italian economy in shifting towards a ICT-driven economy), while communication services have become a leading boosting factors.
However, as already noted in Section 3, the aggregate picture hides the diverging paths of the twenty Italian regions. These patterns deserve instead to be carefully analyzed due to their analogy with the divergence observed at the international level. For this reason we now turn to investigate the productivity dynamics splitting the whole Country into three macro-areas.
TERRITORIAL DECOMPOSITION
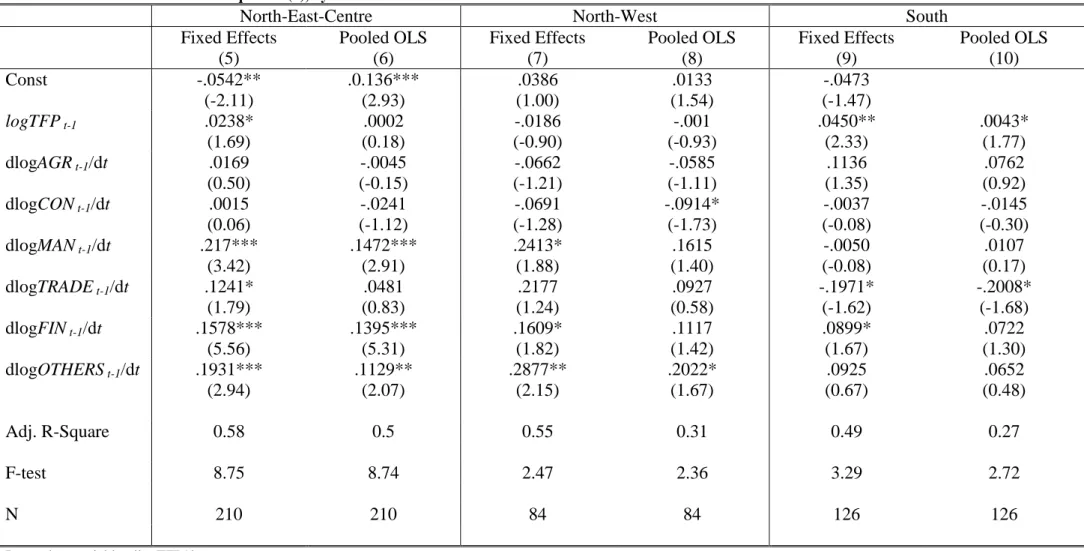
In Table 4 are the results of the estimation of Equation (1), carried out by splitting the sample in the three macro areas introduced above. The results are fairly appealing. First of all it must be noted that the lag of TFP is positive and less than one in the NEC regions and in the South, but not in the North-West. This suggests the existence of a convergence. Moreover the coefficient on the employment share of manufacturing sectors turns now to be significant and positive in some areas. In particular it is
systematically so in the case of NEC regions, where the same result holds both for the fixed effects and for the pooled OLS estimation. This clearly supports the idea that in the period observed productivity growth in North-Eastern and Central regions still owed very much to manufacturing sectors, despite the general climate of change towards the service sectors.
INSERT TABLE 4 ABOUT HERE
Opposite to aggregate results, the trade, hotels and communication sector shows up a positive and significant coefficient in the NEC regions, while the impact is negative and significant in Southern regions. No significant effect can be found in North-Western regions. The coefficient on real estate, financial and monetary intermediation services is systematically positive and significant in NEC and North-Western regions, and even of the same magnitude. The employment dynamics in the remainder of service sectors proved to be significant in NEC and North-Western regions, where the coefficient is positive.
It seems clear that in the last two decades of the 20th century the transition towards a service-based economy was still at a very early stage. While the reallocation of labour force in some service sectors yielded positive effects on productivity growth, the dynamics in traditional sectors and non-ICT service sectors had a counterbalancing effect. In this the most genuine positive dynamics can be found within NEC regions. In North-Western regions the situation appears to be more puzzling, while Southern regions still exert a retarding force. Let us investigate the effects of structural change on innovation in the light of these results.
5.2
Structural Change and Innovation
In this Section we investigate the relationship between innovation dynamics and structural change in Italian regions. The results presented so far show that on the one hand there are evident signs of the increasing weight of service sectors in economic growth, but on the other hand the weight of manufacturing sectors still remains significant, above all in NEC regions. The coexistence of these two phenomena is likely to stimulate firms in manufacturing sectors to creatively react to the changing economic conditions, by putting more efforts in high-value innovating activities. The use of patent applications as a dependent variable constrains the analysis to the innovative performances of the manufacturing sectors. Indeed cross-industry differences in propensity to patent provide a good background to the analysis of creative response dynamics within manufacturing-intensive regions, as in the case of service sectors patents have proved to play a very marginal role17.
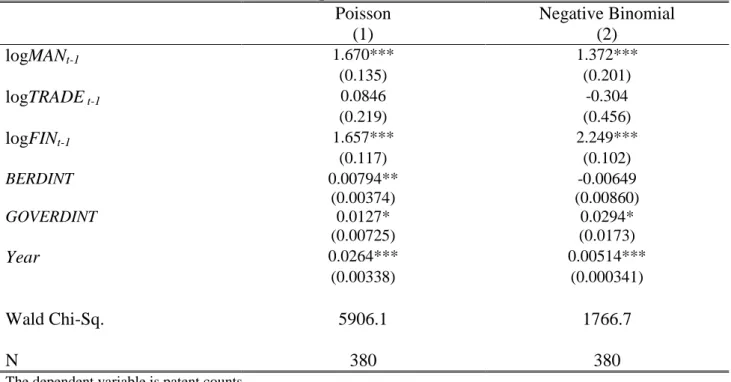
In Table 5 we present the results of preliminary aggregate estimations of Equation (3). It must be noted that due to the overdispersion of the data, and the large presence of zeros, negative binomial estimation should be more appropriate (Hausman et al., 1984). However we carry out also Poisson estimations to check for the robustness of our results. At the aggregate level it is evident that both the employment share of
manufacturing and that of real estate, financial and monetary intermediation service
sectors have a positive and significant impact on patenting activity. Moreover, it is worth noting that the coefficient on service sectors in col. (2) is far higher than the one on manufacturing sectors. These results strongly support the idea that the increase in the weight of service sectors triggers innovative efforts within manufacturing firms.
INSERT TABLE 5 ABOUT HERE
In Table 6 the analysis has been carried out splitting the sample into two time-groups. Before 1995 only the real estate, financial and monetary service sectors has a positive and significant coefficient, while after 1995 the coefficients on all the macro sectors we considered are significantly positive. The two macro service sectors exert a very strong influence on patenting activity, along with a noteworthy impact of manufacturing sectors. This is consistent with the results about productivity growth. Manufacturing firms have undertaken considerable efforts to react creatively to the ongoing transformation. This has caused a productivity acceleration in part of the manufacturing, sustained by a parallel increase in the employment share. For this reason in the period after 1995 the employment share of manufacturing shows up such a positive relationship with patenting activity.
INSERT TABLE 6 ABOUT HERE
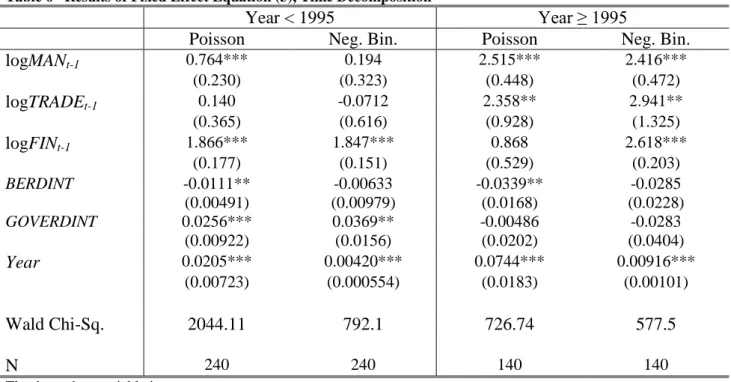
TERRITORIAL DECOMPOSITION
In Table 7 there are the estimation results of Equation (3) carried out for each macro area. It is immediately evident that the situation for NEC regions resembles very much the aggregate one, in that coefficients on real estate, financial and monetary
intermediation and manufacturing sectors are positive and significant. In this case
however the coefficient on manufacturing employment is equal to or greater than that on services. This supports the idea that specifically in NEC regions the growth of manufacturing activities is still able to trigger innovation within the sector. For what concerns North-Western regions, real estate, financial and monetary intermediation is the only sector featured by a positive and significant coefficient, while the other two macro sectors shows a negative and significant coefficient.
INSERT TABLE 7 ABOUT HERE
This is to say that while an inducement mechanism is at stake, it is not paralleled by a revival of manufacturing sectors in the area. In particular, the negative sign on manufacturing is quite appealing. Indeed a pure version of the creative destruction hypothesis would have implied complete substitution of the new sector for the old one. However Schumpeter himself maintained that in changing contexts, there are some firms that survive because they are able to adapt to new conditions. In Italy this happened at least in two ways. On the one hand the organization of division of labour was considerably modified. In particular one could observe a stretching of the value chain, with a parallel shift towards downstream activities, with a low level of labour intensity. On the other hand, in advanced areas intensive investments substituted for extensive investments, with the consequent decrease of manufacturing employment.
6
Concluding Remarks
The grafting of the Schumpeterian legacy into Kuznets’ analysis of structural change proved to be fertile ground in gaining a better understanding of the interplay between productivity, structural change and innovation.
This is even more relevant due to the profound mutations occurring in most advanced countries. Indeed at the international level the shift of employment from manufacturing to service sectors is now well established evidence. It is equally evident that some countries are managing the transition better than others. A seeming distinction between early and late knowledge-based countries is likely to occur, similar to the distinction between early and late industrialized countries proposed in the 1980s (Fuà, 1980). In this paper we investigated the evidence of Italian regions, as we believe it may be generalized both within and across other countries. Italian regions have been grouped in macro areas which reproduce the industrial and economic dualism observed at the international level. On the one hand there are North-Western early industrialized regions, on the other hand the North-Eastern-Central industrialized regions (Fuà and Zacchia, 1983).
In particular, we found that the late-industrialized regions are still undergoing a process of economic growth driven by manufacturing sectors, wherein firms have undertaken failure-induced efforts to innovate. On the other hand within early-industrialized regions the manufacturing sectors has gradually lost importance, but service sectors still face difficulties to take off.
Hence within late-industrialized areas it is likely to observe situations characterized by the creative response of more recent manufacturing firms to the changing economic conditions. This is likely to exert a strong delaying effect on the transition towards a knowledge-based economy. At the same time, within early industrialized areas such efforts should be weaker, and the system should manage to complete the transformation in a knowledge-based economy, as long as service sectors are properly developed. The differential weight of service sectors in the NEC and North-Western regions may well be explained by looking at the relative stage of maturity they have reached in the process of economic development. Within the latter, the demand for business services has reached a critical mass, triggering division of labour and the increasing specialization in business services. NEC regions are characterized by the widespread presence of industrial districts, whose product specialization is reached by locally gathering firms working in a variety of vertically related industries. The bulk of competitive advantage of these productions lies in the capacity to adapt to changing market conditions. A possible reason behind such a low weight of business services may be due to the position of districts, with respect to the value chain. In late-industrialized areas service activities are indeed likely to be performed within firms’ boundaries, and the composition of production activities turns out to be biased towards upward sectors. Further development would therefore require the shift of the boundaries of local systems of production, and position them in the downstream stages of the value chain.
Notes
1The background research for this paper has been carried out during my visiting period at the CRIC – University of Manchester. Preliminary versions of this papers have been presented at the Department of Economics Lunch Seminar, University of Torino on 2007 May 10th, and at the 5th EMAEE Conference organized at the Manchester Metropolitan University on 2007 May 17th-19th. I acknowledge the comments of Cristiano Antonelli, Alessandro Corsi, Francesco Crespi, Stan Metcalfe, Pier Paolo
Patrucco, Erik Stam and Vittorio Valli, as well as the research grants of the Collegio Carlo Alberto and the funding of the European Union Directorate for Research, within the context of the Integrated Project EURODITE (Regional Trajectories to the Knowledge Economy: A Dynamic Model) Contract nr° 006187 (CIT3).
2In Schumpeter’s view, firms’ behaviour is to be understood “on the one hand, as a result of a piece
of past history and, on the other hand, as an attempt to deal with a situation that is sure to change presently - as an attempt by those firms to keep on their feet, on ground that is slipping away from under them” (Schumpeter, 1942: p.84).
3It is worth noting that a complementary demand-side approach may be elaborated. Metcalfe et al.
(2006) establish a connection between demand dynamics and growth retardation through technological change. Their model accounts for dynamics of productivity growth as induced by output growth, through the self-propelling mechanisms fed by innovation activities. Growth rates are in turn unevenly distributed across sectors, producing structural change. The driving force generating such uneven distribution is to be found in the cross-industry dynamics of income elasticities, which affects demand dynamics and hence output growth for a given branch of activity. According to Smith, the increase of market dimensions is likely to foster technological change. Along the lines of Young, productivity growth in one sector is likely to have enhancing effects on productivity in other sectors, augmenting the growth process. A complementary approach focusing on the role of active consumers can be found in Fatas-Villafranca and Saura-Bacaicoa (2004).
4The countries are Great Britain, Germany and United States.
5The industries are cotton textiles, railroads, steel, automobiles and electric power. The institutional
innovations are the factory system, the corporation and the modern financial system.
6
It is fair to note that the term economic structure refers to a stream of different and yet closely relate processes, involving the distribution of employment across sectors, the dimensional distribution of productive units and their organizational forms. In this approach, structural change is the main driver of economic history, along with technological change (Kuznets, 1977).
7
It is fair to stress that while this approach mainly lies upon the supply side, it is worth recalling the demand-side framework developed by Luigi Pasinetti (1981 and 1993). The author proposed a view of the consumer as characterized by a hierarchy of needs, or order of priorities among groups of needs and services. Economic growth implies necessarily the growth of income. As income increases, consumption choices tend to shift from one group of goods of goods and services to another. This shift of consumers across demand schedules is the main cause of structural change. As he put it “employment in each sector i […] moves through time at a rate of change equal to the rate of population growth plus the rate of increase of per capita demand for commodity i” (Pasinetti, 1981: p. 95).
8
An authoritative reference in this respect is the work by Wilfred Salter (1960).
9 The grouping of Italian regions is as follows. North-West: Piedmont, Lombardy, Valle d’Aosta
and Liguria. North-East: Veneto, Emilia-Romagna, Friuli Venezia-Giulia,Trentino Alto-Adige. Centre: Tuscany, Abruzzi, Marches, Lazio, Umbria and Molise. South: Campania, Apulia, Calabria, Basilicata, Sicilia and Sardegna.
10 Different frameworks have been proposed to interpret this polarization. An alternative and yet
complementary approach stresses the importance of differential patterns of industrial organization, which counterpoise systems based on large enterprises to systems based on small firms organised in industrial districts.
11 The empirical analysis carried out by Garofoli (1994) addresses the issue of firms creation quite
exhaustively.
12Empirical evidence indeed shows that the development of complementary sectors matters to the
diffusion of ICTs (Crespi, 2007).
13 We acknowledge that differences in levels and rates of change of TFP may be subject to
non-univocal interpretations. While Solow (1957) associated TFP growth with technological advances, Abramovitz (1956) defined the residual as some sort of measure of ignorance. Nonetheless it remains a useful signalling device, in that it provides useful hints on where the attention of the analysts should focus (Maddison, 1987).
14 On this point see the work by Levin et al. (1987) and the subsequent works inspired by the Yale
survey.
15
According to many scholars, the positive dynamics featuring the industrial districts which flourished in late-industrialized regions in Italy, are responsible for fairly vigorous innovative activity. See for example the works by Patrucco (2005) concerning the Emilia-Romagna technology district, the works by Belussi (2003) and by Belussi and Arcangeli (1998) concerning both the North-Eastern regions, and Belussi (1999),and Boschma and Ter Val (2005) for more recent evidence about Southern regions.
16A more detailed analysis reveals that in metropolitan areas within the North-West service sectors
display a very good performance, in spite of the very strong manufacturing roots. It would hence seem that the diffusion of the knowledge-based economy should take off from these early bulwarks of industrialization (Quatraro, 2007).
17The debate about the nature of innovation activities within service sectors has recently received
increasing attention. Tether (2005) and Consoli (2007) offer good critical syntheses. Evangelista and Sirilli (1998) and Evangelista (2000) present the Italian evidence, emphasizing the very marginal role played by patents in innovation dynamics within service sectors.
Methodological Appendix
The effect of structural change on productivity growth is estimated after having calculated TFP following a growth accounting approach (Solow, 1957; Jorgenson, 1995; OECD, 2001). The output of each industry, Y, is produced from aggregate factor inputs, consisting of capital services (K) and labour services (L). Total factor productivity (A) is defined as the Hicks-neutral augmentation of the aggregate inputs. Such a production function is as follows:
) , (K L f A Y (A1)
Whose general Cobb-Douglas version takes the following format: L K A Y (A2)
Under the assumption of perfect competition and constant returns to scale, TFP growth is derived as the growth of output minus a share weighted growth of inputs.
) / ln ( ) / ln ( / ln / ln A dt d Y dt d K dt d L dt d (A3)
Where α and β represent the factor’s share in total factor income, and α + β = 1, with a bar representing the averages over the period. Following Jorgenson et al. (2006), to reduce the possible biases in the computation of TFP, we also accounted for the changes in labour quality, calculated as the ratio between labour input and hours worked. Equation (3) can be hence rewritten as:
dt LQ d dt L d dy K d dt Y d dt A dln / ln / ( ln / )( ln / ) ln / (A3’)
Where LQ = L / H. The labour share is calculated as the ratio between labour income and total income, while the capital share is derived as a residual.
A basic problem arises, due to the unavailability of capital stock estimations at the regional level. In our own estimations we follow the procedure set out by Maffezzoli (2006), which can be summed up as follows. The official procedure to compute the capital stock is the Permanent Inventory Method (PIM). We assume fixed expected service lives, simultaneous exit mortality patterns and linear depreciation. As a consequence, the real gross capital stock can be computed as:
1 0 ~ d i t t I K (A4)Where d is the expected service life, and It the real investment flow at time t. The depreciation of capital stock is simply equal to Dt K~t /d. The discrete approximation of such a relationship is:
) 2 /( ) ~ ~ (K K 1 d Dt t t (A5)
Finally the net capital stock obtains directly from
1 0 1[1 (2 1)/2 ]
d i t
t I i d
K or
via the accumulation equation Kt Kt1 It Dt.
The accounting data at regional level provide series about gross fixed investments. To make calculations of regional capital stocks we drew the capital stock estimations and the depreciation data at the national level. Then we estimated the average expected service life of aggregated assets by rearranging Equation (A5) as follows:
) 2 /( ) ~ ~ (Kt Kt 1 Dt d (A6)
The results suggest that the aggregate assets are expected to live on average about 34 years. Unfortunately the data about regional accounts are available only starting from 1980, so that we have not enough observation to compute the capital stock. We hence constructed a time series for the actual, time-varying and nation wide depreciation rate, defined as t Dt /Kt1, and then took the 2001 as a benchmark
starting point. We finally extended the series before and after 2001 using the following relationships respectively: ) 1 /( ) ( , , 1 ,t it it t i K I K (A7) t t i t t i K I K , (1 ) ,1 (A8)
This methodology has some drawbacks, such as approximating a linear depreciation scheme with a geometric one, ruling out regional differences in depreciation rates and some necessary degree of measurement error. However, given the availability of the data, it provides a good approximation for the purposes of our work.
7
References
Abramovitz, M. (1956), Resource and Output Trends in the United States Since 1870, American Economic Review, 46, 5-23.
Acs, Z.J., Anselin, L. and Varga, A. (2002), Patents and Innovation Counts as Measures of Regional Production of New Knoweldge, Research Policy, 31, 1069-1085. Antonelli, C. (2003), The Economics of Innovation, New Technologies and
Structural Change, London, Routledge.
Antonelli, C. and Militello, G. (2000), Italia in Transizione: Ruolo dello Stato e dei
Mercati, Roma, Ediesse
Antonelli, C., Patrucco, P. P. and Quatraro, F. (2007), La Grande Onda Schumpeteriana alla Fine del XX Secolo. Transizioni Tecnologiche e Modelli Economici nel Caso Italiano, in Berta, G. (ed.), Una Trasformazione in Atto: Il Nord
Italia. Annali della Fondazione Giangiacomo Feltrinelli - 2007. Milano: Feltrinelli.
Becattini, G. (1989), Modelli Locali di Sviluppo, Bologna, Il Mulino.
Becattini, G. and Coltorti F. (2006), Areas of large enterprise and indutrial districts in the development of post-war Italy: A preliminary survey, European Planning
Studies, 14, 1105-34.
Belussi, F. (1999), Path Dependency vs. Industrial Dynamics: An Analysis of Two Heterogeneous Districts, Human Systems Management, 18, 161-174.
Belussi, F. (2003), “The Generation of Contextual Knowledge. The Case of the Packaging Machinery Industry in The Bologna District”. In: Belussi, F., Gottardi, G., and Rullani, E. (Eds) The Technological Evolution of Industrial Districts. Boston, Kluwer Academic.
Belussi, F. and Arcangeli, F. (1998), A Typology of Networks: Flexible and Evolutionary Firms, Research Policy, 27, 415-28.
Berta, G. (2004), Metamorfosi. L’Industria Italiana fra Declino e Trasformazione, Milano, EGEA.
Boschma, R. and Ter Val, A.L.J. (2005), Knowledge Networks and Innovative Performances in an Industrial District. The Case of a Footwear District in the South of Italy, Papers in Evolutionary Economic Geography n. 06.01, University of Utrecht.
Broersma, L. and Van Ark, B. (2007), ICT, business services and labour productivity growth, Economics of Innovation and New Technology, 16, 433-449.
Brusco, S. (1982), The Emilian Model: Productive Decentralization and Social Integration, Cambridge Journal of Economics, 6, 167-184.
Burns, A. F. (1934), Production Trends in the United States since 1870, Boston, NBER.
Consoli, D. (2007), Services and Systemic Innovation: A Cross-Sectoral Analysis,
Crespi F. (2007), IT services and productivity in European industries, in Kox H.L.M., Rubalcaba L. (eds.), Business services in European economic growth, Palgrave Mac Millan, London.
Evangelista, R. (2000), Sectoral Patterns of Technological Change in Services,
Economics of Innovation and New Technology, 9, 183-221.
Evangelista, R. and Sirilli G. (1998), Innovation in the Service Sector. Results from the Italian Innovation Survey, Technological Forecasting and Social Change, 58, 251-269.
Fabricant, S. (1942), Employment in Manufacturing, 1899-1939, New York, NBER.
Fabricant, S. (1940), The Output of Manufacturing Industries: 1899 – 1937, New York, NBER.
Fagerberg, J. (1994), Technology and International Differences in Growth Rates,
Journal of Economic Literature, 32, 1147-1175.
Fagerberg, J. (2000), Technological Progress, Structural Change and Productivity Growth: A Comparative Study, Structural Change and Economic Dynamics, 11, 393-411.
Fatas-Villafranca, F.and Saura-Bacaicoa, D. (2004), Understanding the demand-side of economic change: A contribution to formal evolutionary theorizing, Economics
of Innovation and New Technology, 13, 695-716.
Frantzen, D. (2000), Innovation, International Technological Diffusion and Changing Influence of R&D on Productivity, Cambridge Journal of Economics, 24, 193-210.
Freeman, C. and Soete, L. (1997), The Economics of Industrial Innovation, London, Frances Pinter.
Fuà G. (ed) (1991a), Orientamenti per la Politica del Territorio, Bologna, il Mulino.
Fuà, G (1991b), The environmental bases of diffuse industrialization, International
Studies of Management & Organization, vol. XXI, n. 1, pp. 5-20.
Fuà G. (1983), Industrializzazione nel Nord Est e nel Centro, in G. Fuà e C. Zacchia (ed.), Industrializzazione senza fratture, Bologna, il Mulino, pp. 7-46.
Fuà, G. (1980), Problemi dello Sviluppo Tardivo in Europa, Bologna, Il Mulino. Fuà, G. e Zacchia, C. (eds.) (1983), Industrializzazione Senza Fratture, Bologna, il Mulino.
Fuà, G. (ed) (1991), Orientamenti per la Politica del Territorio, Bologna, il Mulino.
Garofoli, G. (1994), New Firm Formation and Regional Development: The Italian Case, Regional Studies, 28, 381-393.
Garofoli G. (1983), Aree di specializzazione produttiva e piccole imprese in Europa, Economia Marche, a. II, n. 1, pp. 3-43.
Garofoli G. (1981), Lo Sviluppo delle aree periferiche nell’economia italiana degli anni Settanta, L’Industria, a. II, n. 3, pp. 391-404.
Griliches, Z. (1994), Productivity, R&D and data constraint, American Economic
Review, 84, 1-23.
Griliches, Z. (1990), Patent Statistics as Economic Indicators: A Survey, Journal
of Economic Literature, 28, 1661-1707.
Griliches Z. (1979), Issues in Assessing the Contribution of Research and Development to Productivity Growth, The Bell Journal of Economics, 10, 92-116.
Hall, B.H., Griliches Z. and Hausman J.A. (1986), Patents and R and D: Is There a Lag?, International Economic Review, 27, 265-283.
Hausman, J.A., Hall, B. H. and Griliches Z. (1984), Econometric Models for Count Data and with Application to Patents-R&D Relationship, Econometrica, 52, 909-938.
Jorgenson, D.W. (1995), Productivity Volume 1: Post-war US Economic Growth, Cambridge, MA, MIT Press.
Jorgenson, D.W. (2001), Information Technology and the US Economy, American
Economic Review, 91, 1–32.
Jorgenson, D.W., Ho M.S., e Stiroh K.J (2006), Potential Growth of the US Economy: Will the Productivity Resurgence Continue?, Business Economics, 41, 7-16.
Kuznets, S. (1977), Two Centuries of Economic Growth: Reflections on US Experience, American Economic Review, 67, 1-14.
Kuznets, S. (1973), Modern Economic Growth: Findings and Reflections,
American Economic Review, 63, 247-258.
Kuznets, S. (1972), Innovation and Adjustments in Economic Growth, Swedish
Journal of Economics, 74, 431-451.
Kuznets, S. (1940), Schumpeter’s Business Cycles, American Economic Review, 30, 257-271.
Kuznets, S. (1930), Secular Movements in Production and Prices, Boston, Houghton Mifflin.
Levin R.C., A.K. Klevorich, R.R. Nelson And S.G. Winter (1987), Appropriating the returns from industrial research and development, Brooking Papers on Economic
Activity, 3, 783-831.
Maddison, A. (1987), Growth and Slowdown in Advanced Capitalist Economies: Techniques of Quantitative Assessment, Journal of Economic Literature, 25, 649-698.
Maffezzoli, M. (2006), Convergence across Italian regions and the role of technological catch up, Topics in Macroeconomics, 6 (1), Article 15.
Metcalfe S.J, Foster J. and Ramlogan R. (2006), Adaptive Economic Growth,
Cambridge Journal of Economics, 30, 7-32.
OECD (2001), Measuring Productivity. Measurement of Aggregate and
Industry-level Productivity Growth, OECD, Paris.
Paci, M. (1992), Il Mutamento della Struttura Sociale in Italia, Bologna, il Mulino. Paci, M. (1973), Mercato del Lavoro e Classi Sociali in Italia. Ricerche sulla
Composizione del Proletariato, Bologna, il Mulino.
Pasinetti, L.L. (1993), Structural Economic Dynamics, Cambridge: Cambridge University Press.
Pasinetti, L.L. (1981), Structural Change and Economic Growth, Cambridge, Cambridge University Press.
Patrucco, P.P. (2005), The Emergence of Technology Systems: Knowledge Production and Distribution in The Case of the Emilian Plastics District, Cambridge
Journal of Economics, 29, 37-56.
Pavitt, K. (1985), Patent Statistics as Indicators of Innovative Activities: Possibilities and Problems, Scientometrics, 7, 77-99.
Pettenati, P. (1991), I Modelli di Organizzazione Economica del Territorio, in Fuà, (ed)., Orientamenti per la Politica del Territorio, pp.127-175, Bologna, Il Mulino.
Quatraro, F. (2008), The diffusion of regional innovation capabilities: Evidence from Italian patent data, Regional Studies, iFirst published October 10, 2008,
http://dx.doi.org/10.1080/00343400802195162.
Quatraro F. (2007), Change vs. Decline: A Comparative Analysis of the Evolution of TFP in Italian Regions, with a Particular Attention to the case of Turin, International
Review of Economics, 54, 86-105.
Quatraro, F. (2006), Technological Change and Productivity Growth in Italian Regions, 1982-2001, Region et Developpement, 24, 139-164.
Rostow, W. W. (1975), Kondratieff, Schumpeter and Kuznets: Trend Periods Revised, Journal of Economic History, 35, 719-753.
Salter, W.E.G. (1960), Productivity and Technical Change, Cambridge, Cambridge University Press.
Schumpeter, J. A. (1911) (1934), The Theory of Economic Development, Oxford, Galaxy Books.
Schumpeter, J. A. (1928), The Instability of Capitalism, Economic Journal, 38, 361-386.
Schumpeter, J. A. (1939), Business Cycles. A Theoretical, Historical and
Statistical Analysis of the Capitalist Process, New York and London, McGraw Hill.
Schumpeter, J. A. (1942), Capitalism, Socialism and Democracy, London, Unwin. Schumpeter, J. A. (1947), The Creative Response in Economic History, Journal of
Economic History, 7, 149-159.
Silva, E.G. and Teixeira, A.A.C. (2008), Surveying structural change: Seminal contributions and a bibliometric accounts, Structural Change and Economic Dynamics, in press.
Solow R. M. (1957), Technical Change and the Aggregate Production Function,
The Review of Economics and Statistics, 39, 312-320.
Tether, B. (2005), Do Services Innovate (Differently)? Insights from the European Innobarometer Survey, Industry and Innovation, 12, 153-184.
Wolff, E.N. (2003), What’s behind the Rise in Profitability in the US in the 1980s and the 1990s?, Cambridge Journal of Economics, 27, 479-499.
Figure 1 - Feedbacks among Innovation, Structural Change and Economic Growth Retardation Leading Sector TFP Growth Profit Expectations Creative reaction Creative destruction ECONOMIC GROWTH