Publisher’s version / Version de l'éditeur:
Vous avez des questions? Nous pouvons vous aider. Pour communiquer directement avec un auteur, consultez la première page de la revue dans laquelle son article a été publié afin de trouver ses coordonnées. Si vous n’arrivez pas à les repérer, communiquez avec nous à PublicationsArchive-ArchivesPublications@nrc-cnrc.gc.ca.
Questions? Contact the NRC Publications Archive team at
PublicationsArchive-ArchivesPublications@nrc-cnrc.gc.ca. If you wish to email the authors directly, please see the first page of the publication for their contact information.
https://publications-cnrc.canada.ca/fra/droits
L’accès à ce site Web et l’utilisation de son contenu sont assujettis aux conditions présentées dans le site LISEZ CES CONDITIONS ATTENTIVEMENT AVANT D’UTILISER CE SITE WEB.
ICBEST 2010: International Conference on Building Envelope Systems and Technologies [Proceedings], pp. 133-140, 2010-06-27
READ THESE TERMS AND CONDITIONS CAREFULLY BEFORE USING THIS WEBSITE.
https://nrc-publications.canada.ca/eng/copyright
NRC Publications Archive Record / Notice des Archives des publications du CNRC :
https://nrc-publications.canada.ca/eng/view/object/?id=cf6db32d-b770-4185-b352-3c4ce410fe50 https://publications-cnrc.canada.ca/fra/voir/objet/?id=cf6db32d-b770-4185-b352-3c4ce410fe50
NRC Publications Archive
Archives des publications du CNRC
This publication could be one of several versions: author’s original, accepted manuscript or the publisher’s version. / La version de cette publication peut être l’une des suivantes : la version prépublication de l’auteur, la version acceptée du manuscrit ou la version de l’éditeur.
Access and use of this website and the material on it are subject to the Terms and Conditions set forth at
Effect of the air and vapor permeance of exterior insulation on the flow of moisture in wood frame walls in a cold climate
http://www.nrc-cnrc.gc.ca/irc
Effe c t of t he a ir a nd va por pe rm e a nc e of e x t e rior insula t ion on t he flow of m oist ure in w ood fra m e w a lls in a c old c lim a t e
N R C C - 5 3 2 6 0
A r m s t r o n g , M . M . ; M a r e f , W ; R o u s s e a u , M . ; L e i , W . ; N i c h o l l s , M .
J u n e 2 7 , 2 0 1 0
A version of this document is published in / Une version de ce document se trouve dans:
ICBEST 2010 - International Conference on Building Envelope Systems and Technologies, Vancouver, Canada, June 27, 2010, pp. 133-140
The material in this document is covered by the provisions of the Copyright Act, by Canadian laws, policies, regulations and international agreements. Such provisions serve to identify the information source and, in specific instances, to prohibit reproduction of materials without written permission. For more information visit http://laws.justice.gc.ca/en/showtdm/cs/C-42
Les renseignements dans ce document sont protégés par la Loi sur le droit d'auteur, par les lois, les politiques et les règlements du Canada et des accords internationaux. Ces dispositions permettent d'identifier la source de l'information et, dans certains cas, d'interdire la copie de documents sans permission écrite. Pour obtenir de plus amples renseignements : http://lois.justice.gc.ca/fr/showtdm/cs/C-42
EFFECT OF THE AIR AND VAPOR PERMEANCE OF
EXTERIOR INSULATION ON THE FLOW OF MOISTURE IN
WOOD FRAME WALLS IN A COLD CLIMATE
M.M. Armstrong
1, 2, W.Maref
1, M. Rousseau
1, W. Lei
1, M. Nicholls
11 Institute for Research in Construction, National Research Council, Ottawa,
2
Marianne.Armstrong@nrc-cnrc.gc.ca Corresponding author
ABSTRACT
During winter and spring 2008, National Research Council Canada researchers in partnership with Natural Resources Canada and Canada Mortgage and Housing Corporation compared the hygrothermal performance of three RSI 3.5 (R20) 38 mm x140 mm (2x6) wood frame wall assemblies in a field exposure facility in Ottawa, Canada. Two of the walls were retrofitted with RSI 1.76 (R10) exterior insulation: one with mineral fibre, and the second with extruded polystyrene (XPS). During this first year of the field study, the potential for moisture accumulation behind the XPS insulation at the surface of the wood-based sheathing board was observed. To further study this phenomenon, the wood frame wall without retrofit and the wall with XPS insulation were left in place and monitored for a second year. This paper discusses the results from the two years of the field trial, with particular attention on the flow of moisture across the wall assemblies, and the resulting humidity of air at the exterior surface of the sheathing board.
1. INTRODUCTION
As energy costs rise, homeowners and industry are seeking ways to improve home energy performance. One common retrofit method is to add thermal insulation to the exterior of existing shells to increase the wall R-value, while not disturbing the interior of the home. A variety of materials can be used, and their hygrothermal properties vary: some exhibit low air and vapour permeance (e.g. extruded polystyrene), while others have higher air and vapour permeance (e.g. mineral fibre). These properties can affect the potential of the wall assemblies to get wet by condensation (in wintertime) and to dry out (in spring and summertime), hence having the potential to affect negatively the durability of the assembly.
During winter and spring 2008, NRC-IRC researchers in partnership with NRCan and CMHC compared the hygrothermal performance of three RSI 3.5 (R20) 38 mm x 140 mm (2x6) wood frame wall assemblies side by side in a field exposure of walls facility (FEWF) in Ottawa, Canada. Two of the walls were retrofitted with RSI 1.76 (R10) exterior insulation: one with mineral fibre, and the second with extruded polystyrene (XPS). The purpose of this field trial was to determine the effect of low and high air and vapour permeance of the exterior insulation materials on moisture transport through the assemblies.
During the first year of the field study, the potential for moisture accumulation behind the XPS insulation at the surface of the wood-based sheathing board was observed. To further study this phenomenon, the wood frame wall without insulation retrofit and the wall with XPS insulation were left in place and monitored for a second year.
General results from the first year of the retrofit study were described by Maref et al. [1]. This paper focuses on the effect of air and vapour permeance of the external insulation
layer on the flow of moisture across the wall assemblies, and the resulting humidity of air at the exterior of the sheathing board. The impact of air and vapour permeance is examined during:
a) winter conditions – with both dry exterior and interior conditions,
b) challenging interior moisture conditions – with cold dry exterior conditions and forced exfiltration of humid interior air, and
c) early summer conditions – with conditioned interior air and hot humid exterior conditions.
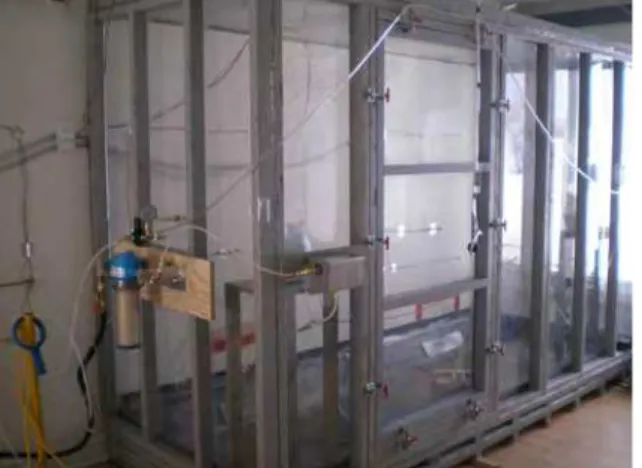
Figure 1. Field Exposure of Walls Facility on the west façade of the Test House. From left to right: W3, W2, W1.
2. EXPERIMENT PROCEDURE
2.1 Field Exposure of Walls Facility (FEWF)
The Field Exposure of Walls Facility (FEWF) is located on the NRC campus is Ottawa, Canada. It features a west-facing test bay in which wall specimens are exposed to naturally occurring exterior conditions (Figure 1). The FEWF also features a climate controlled indoor chamber to expose the walls to a
constant temperature, and challenging humidity and pressure conditions (Figure 2).
3 8
Figure 2. A chamber provides climate control for the two retrofit wall assemblies only (W2 and W3).
2.2 Wall Construction
Prior to the retrofit insulation project, three identical walls 1727 mm x 1219 mm (5ft8in x 4ft) in size were constructed with conventional glass fiber batt insulated 38mm x 140mm (2X6) stud cavity wood-frame construction. The hygrothermal performance of these walls was compared for one year, as documented by Armstrong et al. [2].
In Year 1 of the retrofit insulation project, Wall 1 (W1) remained a benchmark wall, without retrofit insulation. Wall 2 (W2) featured a low air/vapour permeance exterior retrofit with RSI 1.76 (R10) XPS insulation. Wall 3 (W3) featured a high air/vapour permeance exterior retrofit with RSI 1.76 (R10) mineral fibre insulation and an exterior spun bonded polyolefin weather resistance barrier (see Figure 3 for vertical cross sections of the three walls). The walls were separated by insulated stud cavities to prevent the transfer of heat between wall assemblies, and flashing membranes to prevent air and moisture transfer.
In Year 2 of the retrofit study, W1 and W2 remained in place to continue to study the
potential for moisture accumulation behind the XPS insulation. W3 was replaced by a different wall assembly for a separate project.
Wall Cross-Section #2
Wall Cross-Section #1 Wall Cross-Section #3
Exterior Interior
W1 W2 W3
Figure 3. Wall specimen vertical cross sections
Table 1. Description of wall specimens
Wall 1 Wall 2 Wall 3
Vinyl Siding Vinyl Siding Vinyl Siding
Sheathing Membrane 50 mm (2 in.) XPS Rigid Foam Insulation, 600 mm (24 in.) wide sections installed horizontally, square edge 19 mm x 38mm (¾ in. x 1½ in.) Vertical Strapping @ 400 mm (16 in.) o.c. mounted on blocks, with 64 mm (2.5 in.) Mineral Fibre Insulation Batts installed horizontally Sheathing Membrane Sheathing Membrane Sheathing Membrane Sheathing board (OSB) Sheathing board (OSB) Sheathing board (OSB) 38 mm x 140 mm (2x6) Stud Cavity with Fiberglass Insulation 38 mm x140 mm (2x6) Stud Cavity with Fiberglass Insulation 38 mm x140 mm (2x6) Stud Cavity with Fiberglass Insulation Poly Air/Vapour Barrier Poly Air/Vapour Barrier Poly Air/Vapour Barrier
Drywall Drywall Drywall
2.3 Instrumentation
The three walls were instrumented with thermocouples, humidity & temperature (RH&T) sensors, and liquid detection tape at interstitial locations throughout the wall assembly. This paper will concentrate on the results from the RH&T sensors located at a) the layer between the sheathing board and the sheathing membrane and b) the exterior surface of the retrofit insulation layer. Humidity in % (+ 2%) and temperature in °C (+ 0.5°C) was measured every minute and average data was recorded every 15-minutes.
2.4 Test Protocol
4 8
The three walls were exposed to the exterior climate, and also controlled indoor conditions. In the first year of the retrofit study, W2 and W3 were exposed to chamber conditions, while W1 was exposed to room side conditions. Generally, room conditions were dry and cooler than the controlled chamber conditions. Chamber temperature was maintained at ~21°C, and pressure and humidity were controlled to provide challenging conditions for the two walls. Test protocol also called for a deficiency to be introduced in the drywall and polyethylene air/vapour barrier. For all three walls, a 3 mm slit was created the full width of the centre stud cavity near the base of the wall, 260 mm above the bottom plate, to create a path for the exfiltration of chamber air.
The protocol for the first year included three phases: Phase 1 – preconditioning period; Phase 2 – challenging interior humidity and pressure conditions in six subphases referred to as A2 through F2; and Phase 3 – the post experiment period. The full test protocol for year 1 is described by Maref et al. [1]. Four periods were chosen for discussion in this paper and are listed in Table 2.
In the second year, the chamber was rebuilt to accommodate all three specimens – and both
W1 and W2 were exposed to challenging conditions (W3 was replaced for another study).
Table 2. Subset of Year 1 test conditions
Test Phase Dates And Temperature range Opening in air/vapour barrier (mm) Chamber Setting (for W2 and W3 only) RH (%) P (Pa) B2 29-Feb-08 to 18-Mar-08 -17.0°C to 9.6°C 3 x 320 50% 0 E2 27-Mar-08 to 09-Apr-08 -11.7°C to 12.5°C 3 x 320 50% 10 F2 17-Apr-08 to 27-Apr-08 4.8°C to 25.4°C 3 x 320 50% 0 End of Phase 3 22-Jun-08 to 05-Jul-08 11.1°C to 27.0°C 3 x 320 --- 0 3. RESULTS 3.1 Year 1
Due to the identical R-values of the retrofit insulation, temperatures measured at interstitial layers in the two retrofit walls were similar throughout year 1, as reported by Maref et al. [1]. However, the distribution of moisture differed – particularly at the exterior surface of the wood-based sheathing board.
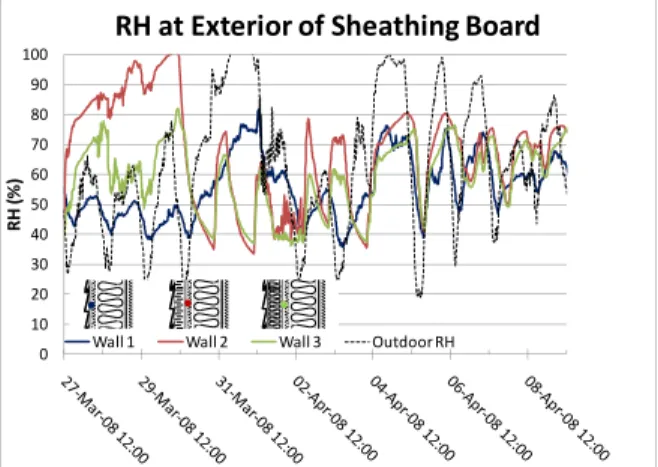
Phase B2: Dry winter conditions
Page of During Phase B2, outdoor temperature ranged from -17.0°C to 9.6°C. Despite having an opening in the air/vapour barrier and increased humidity in the chamber (50%), the air in the stud cavity remained dry due to the lack of exfiltration of air across the assembly [1]. Figure 4 shows the relative humidity of air at the exterior of the sheathing board during this period. Because the retrofit layer resulted in warmer temperatures inboard of the retrofit insulation, the RH at the exterior of the sheathing board of both W2 and W3 was lower than W1. With the dry conditions in the stud cavity, there was only a small difference (~5 percentage points) in the relative humidity
of air at the exterior of the sheathing board for the two retrofit walls. The change in humidity ratio of air across the retrofit insulation (shown in Figure 5) was also small: less than 2 gv/kgda during most of the period. Even under
these dry conditions, W3 showed slightly smaller drop in humidity across the retrofit insulation than W2. This is evidence of the higher air/vapour permeance of W3’s mineral fibre retrofit insulation.
0 10 20 30 40 50 60 70 80 90 100 RH (% ) RH at Exterior of Sheathing Board
Wall 1 Wall 2 Wall 3 Outdoor RH
Figure 4. RH at the exterior of the sheathing board during Phase B2 (dry winter)
‐8 ‐6 ‐4 ‐2 0 2 4 6 8 De lt a hum idit y ra ti o , w (gv /k gda ) Delta w across the Retrofit Insulation (Interior ‐ Exterior) Wall 2 Wall 3 Interior more humid than Exterior Exterior more humid than Interior
Figure 5. Difference in humidity ratio across the retrofit insulation during Condition B2 (dry winter)
Phase E2: Challenging moisture conditions
5 8
During Phase E2, W2 and W3 were challenged by the pressurized chamber forcing warm chamber air at 50% RH into the stud cavity. The relative humidity of air at the surface of the sheathing board for phase E2 is plotted in Figure 6. For the duration of phase
E2, the average relative humidity of air at this location was over 10% higher in W2 than W3. The XPS wall (W2) experienced higher peaks in relative humidity, at one point reaching 100%, while relative humidity at the same location in the mineral fibre wall (W3) never exceeded 82%. While this could suggest that the wall assembly retrofitted with XPS could be more prone to moisture accumulation at the surface of the sheathing board than the wall retrofitted with mineral fibre insulation, no wetting was detected on the exterior of the sheathing board by the liquid detection tape during this test period.
0 10 20 30 40 50 60 70 80 90 100 RH (% ) RH at Exterior of Sheathing Board
Wall 1 Wall 2 Wall 3 Outdoor RH
Figure 6. RH at the exterior of the sheathing board during Phase E2 (wet challenging) – note Wall 1 was not exposed to high chamber humidity ‐8 ‐6 ‐4 ‐2 0 2 4 6 8 De lt a hum idit y ra ti o , w (gv /k gda ) Delta w across the Retrofit Insulation (Interior ‐ Exterior) Wall 2 Wall 3 Interior more humid than Exterior Exterior more humid than Interior
Figure 7. Difference in humidity ratio across the retrofit insulation during Phase E2 (wet challenging)
However, under these conditions of exfiltration and high indoor humidity, the effect of the low vapour and air permeance of the XPS insulation was apparent. The change in moisture content of air across the retrofit insulation of W2 and W3 is plotted in Figure 7. While conditions behind the mineral fibre layer of W3 were never more than 4 gv/kg da wetter than the exterior conditions, the air adjacent to the interior side of the XPS insulation in W2 was up to 7 gv/kgda wetter
than air at the exterior. More extensive testing would be required to verify whether the XPS wall retrofitted assembly can be more prone to moisture accumulation at the exterior surface of the sheathing board.
0 10 20 30 40 50 60 70 80 90 100 RH (% ) RH at Exterior of Sheathing Board
Wall 1 Wall 2 Wall 3 Outdoor RH
Figure 8. RH at the exterior of the sheathing board during Phase F2 (spring)
‐8 ‐6 ‐4 ‐2 0 2 4 6 8 De lt a hum idit y ra ti o , w (gv /k gda ) Delta w across the Retrofit Insulation (Interior ‐ Exterior) Wall 2 Wall 3 Interior more humid than Exterior Exterior more humid than Interior
Figure 9. Difference in humidity ratio across the retrofit insulation during Phase F2 (spring)
0 10 20 30 40 50 60 70 80 90 100 RH (% ) RH at Exterior of Sheathing Board
Wall 1 Wall 2 Wall 3 Outdoor RH
Figure 10. RH at the exterior of the sheathing board during the end of Phase 3 (cooling)
‐8 ‐6 ‐4 ‐2 0 2 4 6 8 De lt a hum idit y ra ti o , w (gv /k gda ) Delta w across the Retrofit Insulation (Interior ‐ Exterior) Wall 2 Wall 3 Interior more humid than Exterior Exterior more humid than Interior
Figure 11. Difference in humidity ratio across the retrofit insulation during the end of Phase 3 (cooling).
Phase F2: Spring conditions
6 8
During phase F2, the walls transitioned into spring conditions – with daily temperatures rising to 20°C and descending below 10°C at night. The chamber was not pressurized for this phase of the project. The relative humidity at the exterior surface of the sheathing board was higher in W2 than W3 (see Figure 8). As in phase E2, there was evidence of the difference between the air and vapour permeability of the two retrofitted walls. Figure 9 shows the difference in humidity ratio measured across the retrofit insulation. While there was rarely more than a 1 gv/kgda
difference across the mineral fibre insulation of W3, W2 showed daily peaks, where the moisture in the air on the interior side of the
insulation was up to 4 gv/kda wetter than the air on the exterior side.
End of Phase 3: Transition to Cooling
With the transition into cooling season at the end of Phase 3, the climate indoors was on average less humid than the climate outdoors. The air at the exterior of the sheathing board of W3 followed the outdoor moisture conditions more closely than the air behind the XPS of W2 (Figure 10). Because of the low air and vapour permeability of the XPS, the conditions behind the retrofit insulation were often dryer in W2 than W3. Air at the interior side of the XPS insulation was over 4 gv/kgda
dryer than air at the exterior side on multiple occasions (Figure 11). ‐40 ‐30 ‐20 ‐10 0 10 20 30 40 50 60 70 80 90 100 P re ssu re (P a), Te m p e ra tu re (° C), RH (% ) Year 2: Chamber Conditions and Outdoor Temperature Chamber RH Chamber Temperature Chamber Pressure Outdoor Temperature
Figure 12. Chamber conditions and outdoor temperature during Year 2
3.2 Year 2
In the second year of this project (2009), W1 and W2 were again monitored from January to July. The walls were exposed to the naturally occurring outdoor conditions, and various controlled interior conditions (as shown in Figure 12). Relative humidity at the exterior surface of the sheathing board of W2 peaked on February 6th, reaching a maximum of 92% (Figure 13). On the previous day, the wall had been exposed to 70% humidity and up to 10 Pa pressure for a brief period of time. As a result, high humidity and condensation was detected at the interior surface of the OSB (see
detail in Figure 14). Despite this challenging event, air at the exterior surface of the OSB remained below 100% humidity and no surface condensation was detected.
The difference in humidity ratio across the XPS retrofit insulation for the entire Year 2 experiment period is plotted in Figure 15. As with Year 1, air on the interior side of the XPS insulation did not follow exterior humidity conditions closely. Air at this location was up to 4.8 gv/kgda wetter than the exterior
conditions, and up to 6.0 gv/kgda dryer than the
exterior conditions. 0 10 20 30 40 50 60 70 80 90 100 RH (% ) RH at Exterior of Sheathing Board Wall 1 Wall 2
Figure 13. RH at the exterior of the sheathing board during Year 2.
0 10 20 30 40 50 60 70 80 90 100 RH (% ) RH at Exterior of Sheathing Board Wall 1 ‐ Exterior of Sheathing Board Wall 2 ‐ Exterior of Sheathing Board Wall 2 ‐ Interior of Sheathing Board
Figure 14. Detail of high humidity event in Wall 2 during Year 2
‐8 ‐6 ‐4 ‐2 0 2 4 6 8 De lt a w (gv /k gda ) Delta w across the Retrofit Insulation (Interior ‐ Exterior) Wall 2 Interior more humid than Exterior Exterior more humid than Interior Page 8 of 8 Figure 15. Difference in humidity ratio across
the XPS retrofit insulation during Year 2.
4. SUMMARY AND DISCUSSION
Comparison of the performance of two exterior retrofit materials with different air/vapour permeance at the Field Exposure of Wall Facility revealed differences in moisture content of air at interstitial layers in the assembly. While both retrofit methods resulted in similar temperatures across the assembly, humidity levels of air at the exterior surface of the wood-based sheathing board differed. Generally, air behind the retrofit insulation layer, at the exterior of the sheathing board, responded to changes in exterior conditions faster in the mineral fibre wall than in the XPS wall (W2). For the mineral fibre wall (W3), moisture content of air at this location was within 2 gv/kgda of the
exterior conditions on all but the most challenging occasions (up to 3.5 gv/kgda for
Year 1 Phase E2). Air behind the XPS retrofit layer showed greater differences across the layer than the mineral fibre wall throughout Year 1, and reached differences of up to 6 gv/kgda under challenging conditions.
As a result, air humidity levels were generally higher in the XPS wall at the surface of the exterior sheathing board than in the mineral
fibre wall in winter and spring, and lower during cooling season.
Trapping of moisture and peaks in humidity at the exterior of the sheathing board only occurred on occasions when there was an influx of moisture from the room (or this case chamber) to the wall cavity. For this to occur, a number of coincident factors need to be present: a pressure driving force for exfiltration across the assembly, a deficiency in the air/vapour barrier, high room-side humidity, and cool exterior conditions.
Despite air at the exterior surface of the sheathing board in the XPS retrofitted wall approached saturation in both Year 1 and Year 2, when challenged with exfiltration of moist air and cold exterior conditions, no condensation was detected by the liquid detection strips on the exterior surface of the sheathing board. Controlled experimentation and modeling is suggested to further explore this phenomenon.
5. REFERENCES
[1] Maref. W., Armstrong. M.M., Rousseau. M. and Lei, W. (2010), " A Field Monitoring Investigation of the Effect of Adding Different Exterior Thermal Insulation Materials on the Hygrothermal Response of Wood-Frame Walls in a Cold Climate", Proceedings of the Second Building Enclosure Science and Technology Conference, Portland, April 12-14 2010, in press.
[2] Armstrong. M.M., Maref. W., Rousseau. M., Lei. W. and Nicholls. M. (2009) “A field monitoring study of interstitial condensation in wood-frame walls in cold climate”, Proceedings of the 12th Canadian Conference on Building Science and Technology, Montréal, Quebec, May 6 2009.