Supporting Information
Causes and consequences of large clonal assemblies in a
poplar hybrid zone
David Macaya-Sanz, Myriam Heuertz, Dorothea Lindtke, Giovanni G.
Vendramin, Christian Lexer and Santiago C. González-Martínez
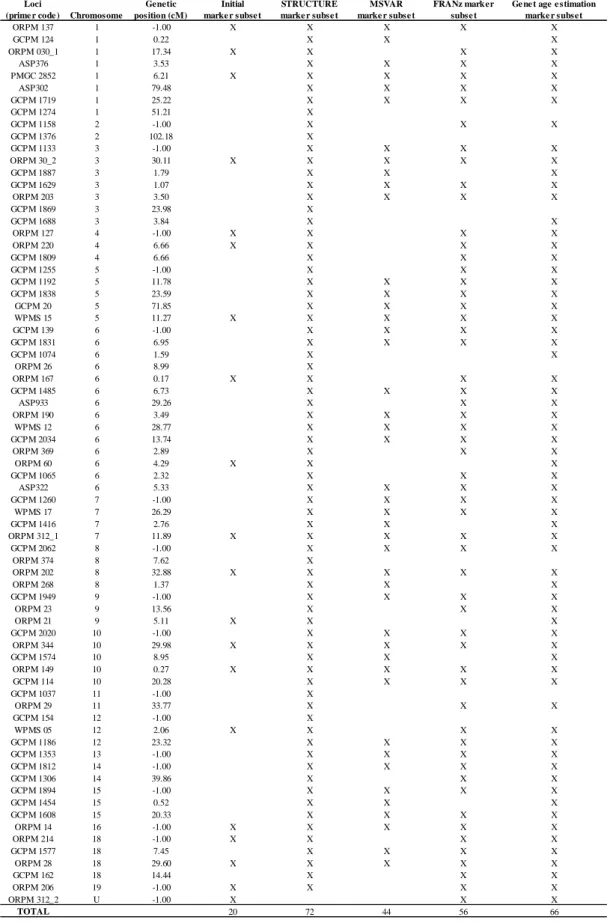
Table S1 Nuclear microsatellites, including locus code, chromosome and genetic position,
and the marker subsets used in the different data analyses.
Loci
(prime r code )
Chromosome
Genetic
position (cM)
Initial
marke r subse t
STRUCTURE
marke r subse t
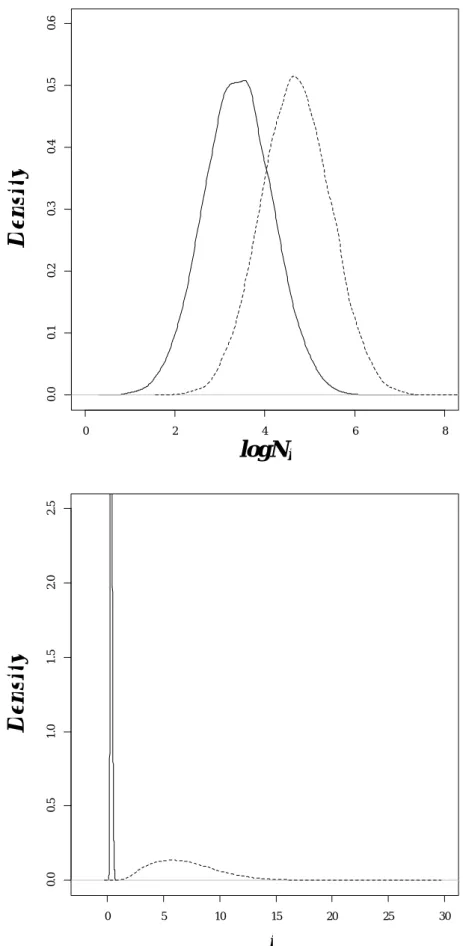
MSVAR
marke r subse t
COLONY and
FRANz marker
subse t
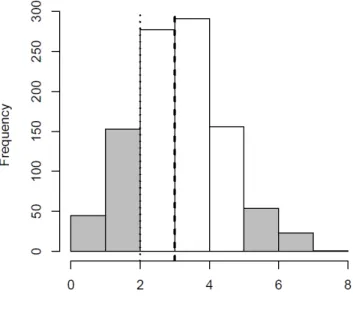
Ge ne t age e stimation
marke r subset
ORPM 137
1
-1.00
X
X
X
X
X
GCPM 124
1
0.22
X
X
X
ORPM 030_1
1
17.34
X
X
X
X
ASP376
1
3.53
X
X
X
X
PMGC 2852
1
6.21
X
X
X
X
X
ASP302
1
79.48
X
X
X
X
GCPM 1719
1
25.22
X
X
X
X
GCPM 1274
1
51.21
X
GCPM 1158
2
-1.00
X
X
X
GCPM 1376
2
102.18
X
GCPM 1133
3
-1.00
X
X
X
X
ORPM 30_2
3
30.11
X
X
X
X
X
GCPM 1887
3
1.79
X
X
X
GCPM 1629
3
1.07
X
X
X
X
ORPM 203
3
3.50
X
X
X
X
GCPM 1869
3
23.98
X
GCPM 1688
3
3.84
X
X
ORPM 127
4
-1.00
X
X
X
X
ORPM 220
4
6.66
X
X
X
X
GCPM 1809
4
6.66
X
X
X
GCPM 1255
5
-1.00
X
X
X
GCPM 1192
5
11.78
X
X
X
X
GCPM 1838
5
23.59
X
X
X
X
GCPM 20
5
71.85
X
X
X
X
WPMS 15
5
11.27
X
X
X
X
X
GCPM 139
6
-1.00
X
X
X
X
GCPM 1831
6
6.95
X
X
X
X
GCPM 1074
6
1.59
X
X
ORPM 26
6
8.99
X
ORPM 167
6
0.17
X
X
X
X
GCPM 1485
6
6.73
X
X
X
X
ASP933
6
29.26
X
X
X
ORPM 190
6
3.49
X
X
X
X
WPMS 12
6
28.77
X
X
X
X
GCPM 2034
6
13.74
X
X
X
X
ORPM 369
6
2.89
X
X
X
ORPM 60
6
4.29
X
X
X
GCPM 1065
6
2.32
X
X
X
ASP322
6
5.33
X
X
X
X
GCPM 1260
7
-1.00
X
X
X
X
WPMS 17
7
26.29
X
X
X
X
GCPM 1416
7
2.76
X
X
X
ORPM 312_1
7
11.89
X
X
X
X
X
GCPM 2062
8
-1.00
X
X
X
X
ORPM 374
8
7.62
X
ORPM 202
8
32.88
X
X
X
X
X
ORPM 268
8
1.37
X
X
X
GCPM 1949
9
-1.00
X
X
X
X
ORPM 23
9
13.56
X
X
X
ORPM 21
9
5.11
X
X
X
GCPM 2020
10
-1.00
X
X
X
X
ORPM 344
10
29.98
X
X
X
X
X
GCPM 1574
10
8.95
X
X
X
ORPM 149
10
0.27
X
X
X
X
X
GCPM 114
10
20.28
X
X
X
X
GCPM 1037
11
-1.00
X
ORPM 29
11
33.77
X
X
X
GCPM 154
12
-1.00
X
WPMS 05
12
2.06
X
X
X
X
GCPM 1186
12
23.32
X
X
X
X
GCPM 1353
13
-1.00
X
X
X
X
GCPM 1812
14
-1.00
X
X
X
X
GCPM 1306
14
39.86
X
X
X
GCPM 1894
15
-1.00
X
X
X
X
GCPM 1454
15
0.52
X
X
X
GCPM 1608
15
20.33
X
X
X
X
ORPM 14
16
-1.00
X
X
X
X
X
ORPM 214
18
-1.00
X
X
X
X
GCPM 1577
18
7.45
X
X
X
X
ORPM 28
18
29.60
X
X
X
X
X
GCPM 162
18
14.44
X
X
X
ORPM 206
19
-1.00
X
X
X
X
ORPM 312_2
U
-1.00
X
X
X
TOTAL
20
72
44
56
66
Primer sources: loci coded GCPM and PMGC, from http://www.ornl.gov/sci/ipgc/ssr_resource.htm; loci coded ORPM, from Tuskan et al. (2004; Can J Forest Res);
Table S2 Basic statistics per sample for GBS data: number of reads, coverage and number of stacks.
Genet First trimmed 60-bp reads Second trimmed 60-bp reads
MLL009 Ramet UTM X UTM Y Illumina reads (a) Number trimmed reads Stacks Coverage (mean) Coverage (sd) Utilized reads (b) Utilized reads (c) Number trimmed reads Stacks Coverage (mean) Coverage (sd) Utilized reads (b) Utilized reads (c)
A087 433478 4600385 669457 587583 18322 17.0814 139.961 312966 344771 239824 8738 13.4973 146.329 117939 129084 A195 406620 4603949 733333 677245 22958 15.5252 128.485 356427 402043 287163 10603 13.1857 161.46 139808 155480 A240 412985 4596131 758800 698266 26734 14.0928 93.0963 376756 428426 268683 11544 10.6861 112.326 123360 139507 A268 442660 4613326 614751 540147 14179 20.1961 177.619 286360 311809 207005 5893 17.4682 184.019 102940 110999 A272 461216 4607852 597606 532461 15763 15.0238 104.339 236820 264905 227972 8209 12.0118 116.427 98605 110109 A272 (rep) NA NA 687666 609579 19882 14.8621 106.763 295488 329195 266373 10646 11.7255 118.152 124830 138897 A337 419077 4611995 701978 616141 22676 13.2436 179.879 300312 342594 280591 12150 10.9984 235.568 133630 150729 A358 453532 4608936 560326 499853 16528 13.1199 96.573 216846 245992 215469 8803 10.4905 117.28 92348 104886 C033 467898 4586658 644721 588032 11466 25.7127 238.642 294822 317697 281708 6504 22.6479 262.544 147302 157332 C049 492681 4589532 501720 464978 9438 20.5804 151.946 194238 211363 210040 5530 16.883 160.161 93363 100863 MLL006 A052 423681 4614886 634721 566619 8659 27.6631 249.357 239535 259403 277887 5891 22.1526 255.518 130501 139947 A052 (rep) NA NA 792795 702529 16944 20.8941 214.152 354030 390385 305265 8623 17.4752 236.969 150689 163486 A082 434462 4598318 804971 718576 20062 16.4746 131.364 330514 375835 300753 10833 12.0582 123.69 130627 147187 A244 442907 4612671 886440 774376 25272 15.2595 114.386 385639 440611 295436 11493 11.7389 130.301 134915 151545 C004 381399 4660402 810028 721412 11629 31.709 313.693 368744 396324 315887 6096 26.7726 311.921 163206 173333 C038 475166 4576950 594138 532310 6780 34.1819 256.824 231753 250714 231986 4118 25.5986 238.024 105415 113007 C055 512215 4614202 666809 591159 6733 41.6124 317.724 280176 300440 263315 3688 35.1643 312.899 129686 137808 C059 455835 4655330 587148 532071 5146 50.9246 450.253 262058 276778 251748 3053 42.357 463.393 129316 135147 C066 491584 4616554 590371 529466 3801 66.6911 445.361 253493 267424 249420 2570 50.163 422.948 128919 135364 C081 497545 4584454 587812 529105 8694 23.9829 183.998 208507 229071 243569 5633 19.2413 192.965 108386 117497
(a) After preliminary filtering (using process_radtags from Stack software) (b) Before matching remainder reads