HAL Id: pasteur-01744767
https://hal-pasteur.archives-ouvertes.fr/pasteur-01744767
Submitted on 27 Mar 2018
HAL is a multi-disciplinary open access
archive for the deposit and dissemination of
sci-entific research documents, whether they are
pub-lished or not. The documents may come from
teaching and research institutions in France or
abroad, or from public or private research centers.
L’archive ouverte pluridisciplinaire HAL, est
destinée au dépôt et à la diffusion de documents
scientifiques de niveau recherche, publiés ou non,
émanant des établissements d’enseignement et de
recherche français ou étrangers, des laboratoires
publics ou privés.
Distributed under a Creative Commons Attribution| 4.0 International License
Proteomic analysis of plasma extracellular vesicles
reveals mitochondrial stress upon HTLV-1 infection
Patricia Jeannin, Thibault Chaze, Quentin Gianetto, Mariette Matondo,
Olivier Gout, Antoine Gessain, Philippe Afonso
To cite this version:
Patricia Jeannin, Thibault Chaze, Quentin Gianetto, Mariette Matondo, Olivier Gout, et al..
Pro-teomic analysis of plasma extracellular vesicles reveals mitochondrial stress upon HTLV-1 infection.
Scientific Reports, Nature Publishing Group, 2018, 8, pp.5170 - 5170. �10.1038/s41598-018-23505-0�.
�pasteur-01744767�
Proteomic analysis of plasma
extracellular vesicles reveals
mitochondrial stress upon HTLV-1
infection
Patricia Jeannin
1,2, Thibault Chaze
3, Quentin Giai Gianetto
3,4, Mariette Matondo
3, Olivier
Gout
5, Antoine Gessain
1,2& Philippe V. Afonso
1,2Extracellular vesicles (EVs) can participate in intercellular communication and pathogenesis. EVs contain many cargos, including proteins, and the composition of EVs differs between cell-types and activation levels. Thus, plasma EVs can be used as a biomarker of systemic response to infection and/ or disease progression. In this study, we aimed at describing alterations in the protein content of plasma EVs upon infection with the human T-lymphotropic retrovirus type 1 (HTLV-1). HTLV-1 is the etiological agent of a lymphoproliferative disease (ATL) and a series of inflammatory diseases, including a neurodegenerative inflammatory disease (HAM/TSP). We found that plasma EVs are more abundant and smaller in HTLV-1 asymptomatic carriers or HAM/TSP patients when compared to uninfected healthy donors. Moreover, EVs from HTLV-1 infected donors contain markers of metabolic and mitochondrial stress.
Cells release vesicles that can participate in intercellular communication1. Indeed, extracellular vesicles (EVs)
con-tain biologically active material, which may alter the biology of recipient cells. EVs have been shown to modu-late immune response, inflammation, and viral-induced pathogenesis2,3. The composition of EVs differs between
cell-types and activation levels; plasma EVs have been used as biomarker of infection or disease4. Besides these
func-tions, EVs can also be a cellular means to remove misfolded or aggregated proteins, and non-functional organelles5.
The human T-lymphotropic virus type 1 (HTLV-1) is estimated to infect 5–20 million people worldwide6.
Among HTLV-1 infected individuals, 90–95% remain asymptomatic throughout their lives. Nevertheless, HTLV-1 is the etiological agent of many severe diseases, ranging from an aggressive lymphoproliferation, the adult T-cell leukemia/lymphoma (ATL), to inflammatory syndromes, such as a neurodegenerative disease called HTLV-1 associated myelopathy or tropical spastic paraparesis (HAM/TSP). Although EV composition is often altered upon viral infection and may participate in inflammation, alterations in EV cargoes have not been addressed in the context of HTLV-1 infection in vivo. Indeed, until now, exosome alteration upon HTLV-1 infec-tion has only been characterized for vesicles released in vitro, in the supernatant of chronically infected cell lines7.
Herein, we aimed to describe the alterations in the protein composition of plasma EVs that occur upon HTLV-1 infection in vivo. We found that EVs are more abundant and smaller in the plasma of HTLV-1 infected individuals. These EVs contain proteins derived from mitochondria and lysosomes; they are markers of metabolic and mitochondrial stress.
Results
Increased number of small EVs in the plasma of HTLV-1 infected individuals.
Extracellular ves-icles (EVs) were isolated from the plasma of 5 healthy non-infected individuals (NI), 6 HTLV-1 asymptomatic carriers (HACs), and 5 HAM/TSP patients (Table 1).1Unité d’Epidémiologie et Physiopathologie des Virus Oncogènes, Département de Virologie, Institut Pasteur,
Paris, F-75015, France. 2Centre National de la Recherche Scientifique (CNRS) UMR 3569, Paris, F-75015, France. 3Proteomics platform, Mass Spectrometry for Biology, Institut Pasteur; CNRS USR 2000, Paris, F-75015, France. 4Bioinformatics and Biostatistics Hub, C3BI, Institut Pasteur; CNRS USR 3756, Paris, F-75015, France. 5Service
de Neurologie, Fondation Ophtalmologique Adolphe de Rothschild, Paris, F-75019, France. Correspondence and requests for materials should be addressed to P.V.A. (email: [email protected])
Received: 27 October 2017 Accepted: 14 March 2018 Published: xx xx xxxx
www.nature.com/scientificreports/
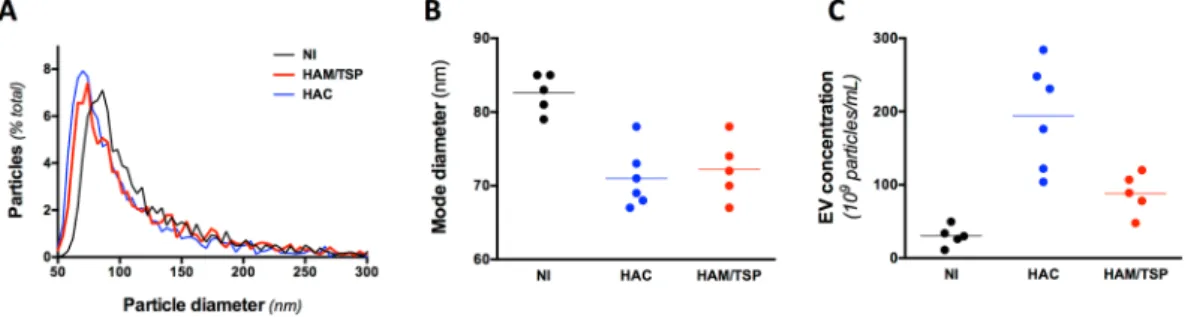
We collected by size exclusion chromatography the plasma EVs with a size comprised between 50 and 150 nm in diameter (Fig. 1A). On average, the size of the EVs isolated from the plasma of HTLV-1 infected individuals was significantly smaller than those of NI donors (Fig. 1A,B).
We also found that plasma from HTLV-1 infected individuals contained significantly more EVs than those from NI donors (Fig. 1C). The plasma EV concentration was the highest for HACs.
Proteome distinguished between infected and non-infected donors.
EV protein content was ana-lyzed by mass spectrometry. For each sample, a large number of peptides (more than 20,000) was detected, which correspond to more than 2,000 identified proteins per sample. A large overlap in exosome protein composition was observed among samples from individuals with similar clinical status (Supplementary Figure 1), demonstrat-ing that inter-individual variations are minor.Almost a third of all the identified proteins (32,5%) was annotated as belonging to extracellular exosomes (Gene ontology GO:0070062, false discovery rate (FDR) = 10−88). Similarly, we detected 92 of the top 100 most
frequently identified exosomal proteins, as defined by the Exocarta database. Viral proteins were not detected in any sample.
Next, the LFQ intensities of the EV protein content from the different samples were examined by pairwise correlation (Fig. 2A). Samples from NI individuals displayed high correlation values among them, and presented lower correlation coefficients with samples from HTLV-1 infected individuals. Intriguingly, high correlation val-ues were obtained for the samples derived from HTLV-1 infected individuals, irrespective to the clinical status.
NAME AGE STATUS ORIGIN PVL (%)
NI1 20 NI African 0
NI2 62 NI African 0
NI3 67 NI Caucasian 0
NI4 61 NI Caucasian 0
NI5 40 NI Caucasian 0
HAC1 47 HAC Caribbean <0.05
HAC2 50 HAC Caucasian 0.48
HAC3 48 HAC Caucasian n.d.
HAC4 52 HAC Caucasian <0.05
HAC5 30 HAC Caucasian 0.6
HAC6 68 HAC Caucasian n.d.
TSP1 68 HAM/TSP Caucasian 6.7
TSP2 47 HAM/TSP Caribbean n.d.
TSP3 50 HAM/TSP Caucasian n.d.
TSP4 66 HAM/TSP Caucasian 1.2
TSP5 51 HAM/TSP Caribbean 6.2
Table 1. Description of plasma donors. The 11 donors were female: 5 were non-infected (NI), 6 were HTLV-1
asymptomatic carriers (HAC), and 5 were HAM/TSP patients. The proviral load (PVL) was determined by quantitative PCR and presented as the number of copies of tax per 100 PBMCs. n.d. means non-determined (due to absence of DNA).
Figure 1. EVs are more abundant and smaller in the plasma of HTLV-1 infected individuals. (A) Size
distribution of the EV populations. Plasma EVs were isolated on qEV columns and the collected vesicles were studied for size on qNANO. The mean particle size distribution is presented. HD is for healthy donors, HAC for HTLV-1 asymptomatic carriers, and HAM/TSP for patients with HAM/TSP. (B) Mode size of plasma EVs. EVs are smaller in the plasma of HTLV-1 infected individuals when compared to NI (p-value = 0,002, Kruskal-Wallis test, Dunn’s post-hoc test). (C) EV concentration of the different EV samples. EV concentration was determined with the qNANO device. EV concentration was significantly higher in HAC when compared to NI (p-value < 10−3, Kruskal-Wallis test, Dunn’s post-hoc test).
Similarly, a hierarchical cluster analysis using Ward’s method and a correlation-based distance was not able to seg-regate samples from HTLV-1 infected individuals according to the clinical status (HAC vs HAM/TSP) (Fig. 2B).
Together, our data analysis of the LFQ intensities suggests that there is a significant protein signature of HTLV-1 infection in the collected EVs. The differences between EV protein composition in HACs and HAM/ TSP patients are subtler. Indeed, the strong correlation among samples from HTLV-1 infected individuals indi-cates that quantified proteins that move specifically in HAC or HAM/TSP represent a small proportion of all the quantified proteins.
EV protein signature of HTLV-1 infection.
We found that 32 proteins were quantified only in samples from NI, while 455 proteins were quantified only in HTLV patients (Fig. 3A and Supplementary Tables 1, 2). Among the 2339 proteins quantified in both cases (NI and HTLV+), 189 were downregulated and 77 upregulated upon HTLV-1 infection (Fig. 3B and Supplementary Tables 1, 2).Proteins involved in blood coagulation (25 proteins present in GO:0007596, FDR = 1.5 10−10) and
comple-ment activation (10 proteins present in GO:0006956, FDR = 3.6 10−9) were more abundant in samples from NI
(Fig. 3C). These proteins are also components of platelet granules (GO:0031091), suggesting that the decrease we observe was due to a lower proportion of platelet granules among plasma EVs. This hypothesis was supported by the fact that 97 out of 221 proteins that are more abundant in NI had been previously described in platelet-derived vesicles (as presented by Exocarta database). Interestingly, the deficit in platelet-derived proteins is most prevalent in HACs than in HAM/TSP, which mirrors the variations in exosome count (Supplementary Figure 2A).
Among the proteins enriched in samples from HTLV-1 infected individuals, proteins composing plasma lipoproteins (12 proteins in GO:0034358, FDR = 5 10−9), lysosomes (85 proteins in GO:0005764, FDR = 1.3
10−27) and mitochondria (122 proteins in GO:0005739, FDR = 1.3 10−27) were overrepresented (Fig. 3D). Most
of the lysosomal and mitochondrial proteins were not quantified in the samples isolated from NI individuals (Supplementary Figure 2B). Moreover, these proteins are often more abundant in samples from HACs than of HAM/TSP patients.
As this trend follows the overall number of EVs, our data suggest that lysosomal and mitochondrial proteins are present together in the small EVs observed upon HTLV-1 infection.
Discussion
We found that, in HTLV-1 carriers, small EVs are accumulated in the blood stream. These vesicles are enriched in mitochondrial and lysosomal proteins.
It is very likely that these mitochondria- and lysosome-rich EVs are not released from the infected cells, but rather from uninfected cells (or hematopoietic origin or not) in response to viral detection or inflammation. First, HTLV-1 infected cells represent a small portion of the circulating cells (ranging from <0,05 to 10%), and would not be responsible for such an alteration in vesicles count. Moreover, there is no correlation between the amount of altered EVs and the HTLV-1 proviral load (the amount of vesicles in lower in HAM/TSP patients when com-pared to HTLV-1 carriers). Finally, the composition of these vesicles does not correspond to the composition of EVs secreted by infected cells, as previously determined7.
Viral proteins were not detected. The absence of detection of viral proteins was anticipated: HTLV-1 viral expression in vivo is low, and, as most of the isolated EVs may have other origins (e.g. platelets, neutrophils, uninfected lymphocytes). However, a meeting abstract suggested that both Tax and HBZ could be detected in exosomes from HAM/TSP patients (but not HACs)8. It is unclear whether Tax was not detected in exosomes in
our study because of lower proviral loads, differences in disease progression, or technique sensitivity limits. High levels of EVs are often described upon viral infection. For example, an increase in EV concentration has been reported in HIV viremic individuals9. We have also found that EVs present in the plasma of HTLV-1
infected individual are smaller than in NI donors. Changes in the size of an EV population are not uncommon. Smaller EVs have been previously observed in the context of inflammation, cellular stress and tissue damage10,11.
Figure 2. Protein cargo composition distinguishes between HTLV-1 infected donors and non-infected donors.
(A) Pair-wise correlations between samples. Shades of blue represent correlation values. (B) Hierarchical cluster analysis between replicates using Ward’s method with a correlation-based distance.
www.nature.com/scientificreports/
These smaller vesicles could be either secreted by a particular cell type (that remains to be identified) or corre-spond to a change in secretion pattern by cells that otherwise secrete larger vesicles. Indeed, a given cell type can release subpopulations of exosomes with different morphology, and properties12,13; the relative proportion of
these EVs subpopulations may be modified in response to alterations in the microenvironment.
The proportion of platelet-derived vesicles was found diminished on HTLV-1 infection. The decrease in plate-let granules is astonishing as HTLV-1 infection has been associated with increased plateplate-let count14. Thus, we
believe that the apparent diminution in platelet-derived proteins is not due to a deficit in the secretion by platelets, and is rather due to a dilution of these vesicles among virus-induced smaller EVs. This is consistent with the fact that the apparent depletion of platelet-associated proteins is more important for plasma from HAC than of HAM/ TSP. Of note, the apparent overexpression of complement and coagulation in HAM/TSP compared to HAC had been previously suggested8.
Lipoproteins have been found enriched, when compared to control donors. This is reminiscent of a previous study that found elevated levels of triglyceride and very low-density lipoproteins (VLDL) in HTLV-1 infected women compared with uninfected individuals15. Our cohort is mostly composed of female donors. It is unclear
whether the fluctuations in lipoproteins occur within exosomes: VLDL overlaps with the size range of EVs or may be adsorbed at the surface of EVs in vitro16.
The most important protein signature in HTLV-1 infected individuals corresponded to mitochondrial pro-teins. Such enrichment has not been previously reported, neither on samples from HIV-infected patients17 nor
in the context of inflammatory diseases (e.g. inflammatory bowel disease, multiple sclerosis)11,18. Of note, Dutta
et al. have not reported such alterations in the context of HTLV infection, likely because they compared the
com-position of exosomes isolated from the serum of HACs, HAM/TSP and ATL patients, but did not consider the composition of exosomes from NI healthy donors8.
Functional mitochondria have been shown to be transferable from cell to cell through vesicles both in vitro and in vivo. The transfer can occur in stress conditions, and can rescue mitochondrial functions19. However, this
transfer is usually mediated through large vesicles19. In our case, the EVs are much smaller and they also contain
lysosomal proteins. Thus, we speculate that these vesicles correspond to extruded mitochondrial in response to inflammation, or cellular stress. In vitro it has been reported that, under TNFα-stimulation, Jurkat cells release mitochondria like vesicles, which can be later recognize by innate immune cells and act as a danger signal20.
This may occur in HTLV-1 infected individuals as they display high plasma levels of inflammatory cytokines21.
Additionally, oxidative stress may participate in such mitochondrial extrusion: on the one hand, Hela cells
Figure 3. Alterations in protein composition of EVs upon HTLV-1 infection. (A) Venn diagram showing the
overlap of proteins identified in EVs from NI and HTLV-1 infected individuals. (B) Volcano plot representing the quantitative analysis of protein composition of EV from NI and HTLV-1 infected donors. Blue and red dots correspond to proteins more abundant in EVs from HD and HTLV-1 infected individuals, respectively. (C) Functional analysis of proteins enriched in EVs from NI. The list of enriched proteins was analyzed with FUNRICH and STRING softwares. The pie chart represents the proportion of proteins associated with coagulation, complement, or the other proteins composing platelet granules. (D) Functional analysis of proteins enriched in EVs from HTLV-1 infected donors. The pie chart represents the proportion of proteins present in lipoproteins, lysosomes or mitochondria.
extrude fragments of mitochondria under oxidative stress in vitro22; on the other hand, serum antioxidant
capac-ity is reduced in HTLV-1 infected patients23.
However, these mechanisms do not fully explain mitochondrial extrusion in our case. Indeed, while HAM/TSP patients display higher levels of inflammatory cytokines, the concentration in mitochondria- and lysosome-rich EVs is lower in HAM/TSP patients. This suggests that, during HAM/TSP pathogenesis, mitochondrial extrusion is inhibited, or some sort of exhaustion occurs, which eventually counteract inflammatory-induced mitochondria extrusion.
In conclusion, we have demonstrated that EV protein cargo is altered in vivo upon HTLV-1 infection, and that they may mirror cellular stress. Such alteration may participate in pathogenesis.
Methods
Samples and ethic statement.
Plasmas were obtained in the context of a Biomedical Research Program approved by the Committee for the Protection of Persons, Ile-de-France II, Paris (2012-10-04 SC). All individuals gave informed consent. Experiments were performed in accordance with guidelines and regulations.Vesicle isolation and characterization.
Extracellular vesicles (EVs) were isolated from 1 mL of human plasma by size exclusion chromatography (SEC), using qEV columns (Izon, UK)24. Fractions 7 to 9 were pooled,as recommended by the manufacturer. The retrieved vesicles were characterized for concentration and size by Tunable Resistive Pulse Sensing technology, using the qNANO device (IZON)25.
Peptide preparation and Mass Spectrometry.
Protein samples were solubilized in urea 8 M, Tris 100 mM pH7.5, then disulfide bonds were reduced with 5 mM dithiothreitol (DTT) for 30 min at 23 °C and alky-lated with 20 mM iodoacetamide for 30 min at room temperature in the dark. Subsequently, LysC (Promega) was added for the first digestion step (500 ng) for 3 h at 30 °C. Then the sample was diluted to 1 M urea with 100 mM Tris pH 7.5, and trypsin (Promega) was added to the sample (1 µg for 16 h at 37 °C, then 500 ng for 3 h). Proteolysis was stopped by adding 2% formic acid. Resulting peptides were desalted using Sep-Pak SPE cartridge (Waters) according to manufactures instructions.LC-MS/MS analysis of digested peptides was performed on an Orbitrap Q Exactive Plus mass spec-trometer (Thermo Fisher Scientific, Bremen) coupled to an EASY-nLC 1000 (Thermo Fisher Scientific). Peptides were loaded and separated at 250 nl.min−1 on a home-made C18 50 cm capillary column picotip
sil-ica emitter tip (75 μm diameter filled with 1.9 μm Reprosil-Pur Basic C18-HD resin, (Dr. Maisch GmbH, Ammerbuch-Entringen, Germany)) equilibrated in solvent A (0.1% FA). Peptides were eluted using a gradi-ent of solvgradi-ent B (ACN,0.1% FA) from 2% to 5% in 5 min, 5% to 22% in 150 min, 22% to 45% in 60 min (total duration of the chromatographic run was 250 min including high ACN level steps and column regeneration). Mass spectra were acquired in data-dependent acquisition mode with the XCalibur 2.2 software (Thermo Fisher Scientific, Bremen) with automatic switching between MS and MS/MS scans using a top-10 method. MS spectra were acquired at a resolution of 70,000 (at m/z 400) with a target value of 3 × 10⁶ ions. The scan range was limited
from 300 to 1,700 m/z. Peptide fragmentation was performed using higher-energy collision dissociation (HCD) with the energy set at 28 NCE. Intensity threshold for ions selection was set at 1 × 10⁶ ions with charge exclusion
of z = 1 and z > 7. The MS/MS spectra were acquired at a resolution of 17,500 (at m/z 400). Isolation window was set at 1.6 Th. Dynamic exclusion was employed within 45 s.
Data were searched using MaxQuant (version 1.5.3.8) (with the Andromeda search engine) against a human database (20,202 entries, downloaded from UniProt the 2016.05.25), HTLV-1 viral proteins were searched against a set of 11 entries (including GAG, PRO, POL, REX, TAX, ENV, HBZ, P13, P12, P30 and usHBZ proteins, down-loaded from UniProt the 2015.03.12).
The following search parameters were applied: carbamidomethylation of cysteines was set as a fixed modifica-tion, oxidation of methionine and protein N-terminal acetylation were set as variable modifications. The mass tol-erances in MS and MS/MS were set to 5 ppm and 20 ppm respectively. Maximum peptide charge was set to 7 and 7 amino acids were required as minimum peptide length. A false discovery rate of 1% was set up for both protein and peptide levels. A match between run features was selected between biological replicates with a matched time window set at 1 min and alignment time window set at 20 min. Proteins identified in the reverse and contaminant databases were discarded from the list of identified proteins.
Quantification of the identified proteins was performed using the label free quantification (LFQ) algorithm in MaxQuant26.
Statistical Analysis.
The pairwise correlation matrix represents the Pearson correlation coefficients between each pair of samples computed using all complete pairs of LFQ intensity values measured in these samples. The hierarchical cluster analysis has been conducted via multiscale boostrap resampling (1000 bootstrap replications) with the Ward’s method and a correlation-based distance measure thanks to the pvclust function of the R packagepvclust27, after log2 transformation of the LFQ intensities, imputation of the missing values with the imp.norm
function of the R package norm and a standardization of the values.
For the statistical analysis of one condition versus another, proteins exhibiting fewer than 3 LFQ values in both conditions were discarded from the list to avoid misidentified proteins. Thus a protein is later referred as quantified in a condition when LFQs have been measured in at least 3 samples of the given condition. After log2 transformation of the leftover proteins, LFQ values were normalized by median centering within conditions (normalizeD function of the R package DAPAR)28. Remaining proteins without any LFQ value in one condition
have been considered as proteins quantitatively present in a condition and absent in another. They have therefore been set aside and considered as differentially abundant proteins. Next, missing values were imputed using the
www.nature.com/scientificreports/
imp.norm function of the R package norm. Proteins with a log2 (fold-change) inferior to 1 have been considered
as proteins with no significant difference in abundance. Statistical testing of the remaining proteins (having a log2 (fold-change) superior to 1) was conducted using a limma t-test29, thanks to the R package limma30. An adaptive
Benjamini-Hochberg procedure was applied on the resulting p-values thanks to the function adjust.p of R pack-age cp4p31 using the robust method of Pounds and Cheng32 to estimate the proportion of true null hypotheses
among the set of statistical tests. The proteins associated to an adjusted p-value inferior to a FDR level of 1% have been considered as significantly differentially abundant proteins. Finally, the proteins of interest are therefore the proteins that emerge from this statistical analysis supplemented by those being quantitatively absent from one condition and present in another.
Funtional Enrichement analysis.
Enrichment in molecular functions or cellular localization of cargos was analyzed using Funrich33 and STRING34 databases. The lists of proteins composing exosomes and plateletgranules were from Exocarta35.
References
1. Hessvik, N. P. & Llorente, A. Current knowledge on exosome biogenesis and release. Cell Mol Life Sci, https://doi.org/10.1007/ s00018-017-2595-9 (2017).
2. Raab-Traub, N. & Dittmer, D. P. Viral effects on the content and function of extracellular vesicles. Nature reviews. Microbiology,
https://doi.org/10.1038/nrmicro.2017.60 (2017).
3. Thery, C., Ostrowski, M. & Segura, E. Membrane vesicles as conveyors of immune responses. Nature reviews. Immunology 9, 581–593, https://doi.org/10.1038/nri2567 (2009).
4. Properzi, F., Logozzi, M. & Fais, S. Exosomes: the future of biomarkers in medicine. Biomarkers in medicine 7, 769–778, https://doi. org/10.2217/bmm.13.63 (2013).
5. Eitan, E., Suire, C., Zhang, S. & Mattson, M. P. Impact of lysosome status on extracellular vesicle content and release. Ageing research reviews 32, 65–74, https://doi.org/10.1016/j.arr.2016.05.001 (2016).
6. Gessain, A. & Cassar, O. Epidemiological Aspects and World Distribution of HTLV-1 Infection. Front Microbiol 3, 388, https://doi. org/10.3389/fmicb.2012.00388 (2012).
7. Jaworski, E. et al. Human T-lymphotropic virus type 1-infected cells secrete exosomes that contain Tax protein. The Journal of biological chemistry 289, 22284–22305, https://doi.org/10.1074/jbc.M114.549659 (2014).
8. Dutta, S. et al. Circulating exosomes as an enriched source for adult T cell leukemia biomarkers. Retrovirology 12, P33 (2015). 9. Hubert, A. et al. Elevated Abundance, Size, and MicroRNA Content of Plasma Extracellular Vesicles in Viremic HIV-1+ Patients:
Correlations With Known Markers of Disease Progression. J Acquir Immune Defic Syndr 70, 219–227, https://doi.org/10.1097/ QAI.0000000000000756 (2015).
10. Emanueli, C. et al. Coronary Artery-Bypass-Graft Surgery Increases the Plasma Concentration of Exosomes Carrying a Cargo of Cardiac MicroRNAs: An Example of Exosome Trafficking Out of the Human Heart with Potential for Cardiac Biomarker Discovery. PLoS One 11, e0154274, https://doi.org/10.1371/journal.pone.0154274 (2016).
11. Moyano, A. L. et al. Sulfatides in extracellular vesicles isolated from plasma of multiple sclerosis patients. Journal of neuroscience research 94, 1579–1587, https://doi.org/10.1002/jnr.23899 (2016).
12. Zabeo, D. et al. Exosomes purified from a single cell type have diverse morphology. Journal of extracellular vesicles 6, 1329476,
https://doi.org/10.1080/20013078.2017.1329476 (2017).
13. Willms, E. et al. Cells release subpopulations of exosomes with distinct molecular and biological properties. Scientific reports 6, 22519, https://doi.org/10.1038/srep22519 (2016).
14. Bartman, M. T. et al. Long-term increases in lymphocytes and platelets in human T-lymphotropic virus type II infection. Blood 112, 3995–4002, https://doi.org/10.1182/blood-2008-05-155960 (2008).
15. Carvalho, L. D. et al. Are lipid disorders involved in the predominance of human T-lymphotropic virus-1 infections in women? Rev Soc Bras Med Trop 48, 759–761, https://doi.org/10.1590/0037-8682-0068-2015 (2015).
16. Sodar, B. W. et al. Low-density lipoprotein mimics blood plasma-derived exosomes and microvesicles during isolation and detection. Scientific reports 6, 24316, https://doi.org/10.1038/srep24316 (2016).
17. Chettimada, S., Lorenz, D., Misra, V. & Gabuzda, D. Characterization of Plasma Exosome Protein Cargo in HIV Patients on ART. (2016).
18. Wong, W. Y. et al. Proteomic profiling of dextran sulfate sodium induced acute ulcerative colitis mice serum exosomes and their immunomodulatory impact on macrophages. Proteomics 16, 1131–1145, https://doi.org/10.1002/pmic.201500174 (2016). 19. Hayakawa, K. et al. Transfer of mitochondria from astrocytes to neurons after stroke. Nature 535, 551–555, https://doi.org/10.1038/
nature18928 (2016).
20. Maeda, A. & Fadeel, B. Mitochondria released by cells undergoing TNF-alpha-induced necroptosis act as danger signals. Cell Death Dis 5, e1312, https://doi.org/10.1038/cddis.2014.277 (2014).
21. Starling, A. L. et al. Immunological signature of the different clinical stages of the HTLV-1 infection: establishing serum biomarkers for HTLV-1-associated disease morbidity. Biomarkers: biochemical indicators of exposure, response, and susceptibility to chemicals 20, 502–512, https://doi.org/10.3109/1354750X.2015.1094141 (2015).
22. Lyamzaev, K. G. et al. Novel mechanism of elimination of malfunctioning mitochondria (mitoptosis): formation of mitoptotic bodies and extrusion of mitochondrial material from the cell. Biochim Biophys Acta 1777, 817–825, https://doi.org/10.1016/j. bbabio.2008.03.027 (2008).
23. Shomali, S., Avval, F. Z., Boostani, R., Jarahi, L. & Youssefi, M. Serum total antioxidant capacity status of HTLV-1 infected patients. Acta virologica 59, 199–203 (2015).
24. Lobb, R. J. et al. Optimized exosome isolation protocol for cell culture supernatant and human plasma. Journal of extracellular vesicles 4, 27031, https://doi.org/10.3402/jev.v4.27031 (2015).
25. Vogel, R. et al. A standardized method to determine the concentration of extracellular vesicles using tunable resistive pulse sensing. Journal of extracellular vesicles 5, 31242, https://doi.org/10.3402/jev.v5.31242 (2016).
26. Cox, J. et al. Accurate proteome-wide label-free quantification by delayed normalization and maximal peptide ratio extraction, termed MaxLFQ. Molecular & cellular proteomics: MCP 13, 2513–2526, https://doi.org/10.1074/mcp.M113.031591 (2014). 27. Suzuki, R. & Shimodaira, H. Pvclust: an R package for assessing the uncertainty in hierarchical clustering. Bioinformatics 22,
1540–1542, https://doi.org/10.1093/bioinformatics/btl117 (2006).
28. Wieczorek, S. et al. DAPAR & ProStaR: software to perform statistical analyses in quantitative discovery proteomics. Bioinformatics
33, 135–136, https://doi.org/10.1093/bioinformatics/btw580 (2017).
29. Smyth, G. K. In Bioinformatics and Computational Biology Solutions Using R and Bioconductor (ed Springer New York) (2005). 30. Ritchie, M. E. et al. limma powers differential expression analyses for RNA-sequencing and microarray studies. Nucleic acids research
31. Giai Gianetto, Q. et al. Calibration plot for proteomics: A graphical tool to visually check the assumptions underlying FDR control in quantitative experiments. Proteomics 16, 29–32, https://doi.org/10.1002/pmic.201500189 (2016).
32. Pounds, S. & Cheng, C. Robust estimation of the false discovery rate. Bioinformatics 22, 1979–1987, https://doi.org/10.1093/ bioinformatics/btl328 (2006).
33. Pathan, M. et al. FunRich: An open access standalone functional enrichment and interaction network analysis tool. Proteomics 15, 2597–2601, https://doi.org/10.1002/pmic.201400515 (2015).
34. Szklarczyk, D. et al. The STRING database in 2017: quality-controlled protein-protein association networks, made broadly accessible. Nucleic acids research 45, D362–D368, https://doi.org/10.1093/nar/gkw937 (2017).
35. Keerthikumar, S. et al. ExoCarta: A Web-Based Compendium of Exosomal Cargo. Journal of molecular biology 428, 688–692, https:// doi.org/10.1016/j.jmb.2015.09.019 (2016).
Acknowledgements
We would like to thank Camille Roesch (Izon) for her help in measuring the samples composition. This work was supported by Ville de Paris [Programme Emergence(s)] and Ligue Contre le Cancer/Comité de Paris (RS18/75-5).
Author Contributions
P.J. performed exosome isolation. T.C. performed the Mass Spectrometry Analysis and participated in paper writing. Q.G.G. performed statistical analysis and participated in paper writing. M.M. supervised Mass Spectrometry and participated in paper writing. A.G. and O.G. collected samples. A.G. participated in the paper writing. P.V.A. designed the project, obtained the funding, analyzed the data and wrote the paper.
Additional Information
Supplementary information accompanies this paper at https://doi.org/10.1038/s41598-018-23505-0.
Competing Interests: The authors declare no competing interests.
Publisher's note: Springer Nature remains neutral with regard to jurisdictional claims in published maps and
institutional affiliations.
Open Access This article is licensed under a Creative Commons Attribution 4.0 International
License, which permits use, sharing, adaptation, distribution and reproduction in any medium or format, as long as you give appropriate credit to the original author(s) and the source, provide a link to the Cre-ative Commons license, and indicate if changes were made. The images or other third party material in this article are included in the article’s Creative Commons license, unless indicated otherwise in a credit line to the material. If material is not included in the article’s Creative Commons license and your intended use is not per-mitted by statutory regulation or exceeds the perper-mitted use, you will need to obtain permission directly from the copyright holder. To view a copy of this license, visit http://creativecommons.org/licenses/by/4.0/.