Lock-in Thermography as an Analytical Tool for Magnetic
Nanoparticles: Measuring Heating Power and Magnetic Fields
Christophe A. Monnier,1* Federica Crippa,1* Christoph Geers,1 Evelyne Knapp,2 BarbaraRothen-Rutishauser,1 Mathias Bonmarin2, Marco Lattuada,3# and Alke Petri-Fink1,3#
1
Adolphe Merkle Institute, University of Fribourg, Chemin des Verdiers 4, 1700 Fribourg, Switzerland
2
Institute of Computational Physics, Zurich University of Applied Sciences, Technikumstrasse 9, 8400 Winterthur, Switzerland
3
Chemistry Department, University of Fribourg, Chemin du Musée 9, 1700 Fribourg, Switzerland
* These authors contributed equally to this work
#
These authors contributed equally to this work
Iron oxide nanoparticles – Synthesis and characterization
Iron oleate complex:8.66 g of iron (III) chloride hexaydrate (FeCl3·6H2O, pur. 99≥% Sigma-Aldrich) and 29.792 g
of sodium oleate (pur. >97% TCI) were dissolved in a mixture of 64 mL of ethanol, 48 mL of distilled water and 112 mL of hexane. The reaction mixture was heated at 70°C and kept at reflux for four hours under magnetic stirring. Following this, the organic phase was washed 3 times with 50 mL of distilled water in a separatory funnel, the hexane was evaporated and the final iron oleate-complex was stored in glass flasks at 4 °C.
Synthesis of iron oxide nanoparticles, d = 20 nm:
Oleic acid coated SPIONs were synthetized as followed: 14.51 g of freshly prepared iron oleate complex and 2.31 mL of oleic acid (pur. 90%, Sigma-Aldrich) were dissolved in 105.3 mL of trioctylamine (pur. >97%, boiling point:367 °C, TCI) and degassed at 50 °C for 2 hours. Then, the solution was heated up to 320 °C under a constant flow of argon with an automated two-step heating process (Thermostat T Huber). The temperature was quickly increased to 120 °C (speed rate 10 °C/min), after the heating rate was decreased to 3 °C/min and this speed was kept constant until 320 °C. The reaction was then maintained for 60 minutes at the final temperature to allow crystal growth. After cooling, hexane and ethanol were added to precipitate the SPIONs, which were then washed multiple times by centrifugation.
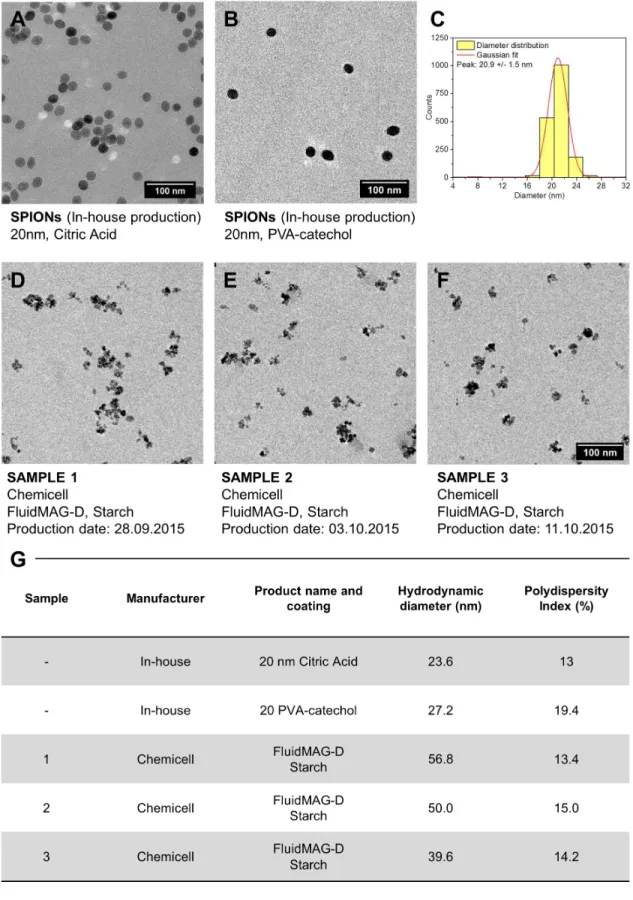
Figure S1. Details on SPIONs characterization. All used nanoparticles were investigated prior to measurements by transmission electron microscopy (TEM, A-F), as well as by
dynamic light scattering (DLS, G). The particle size histogram was created using the Sturges’ relation.1,2 Then the size distribution was obtained with the Gaussian fit.
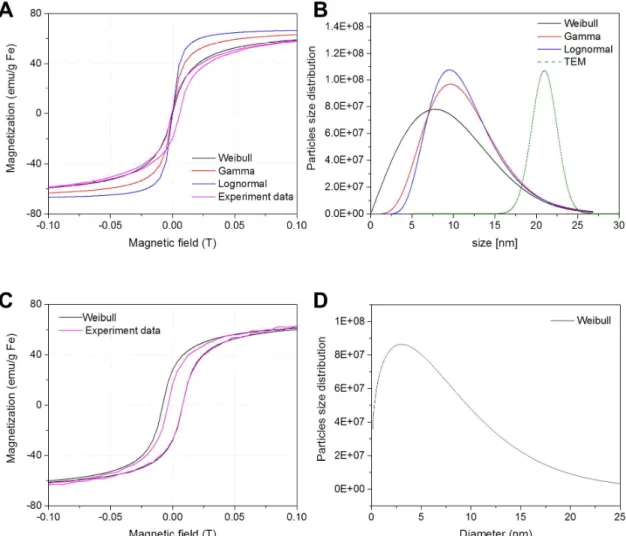
Figure S2. Magnetization and Magnetic Size distribution of in house synthesized SPIONs. Experimental and fitted magnetization curves are reported in (A) for citrate-coated SPIONs. (A) and in (C) for PVA-catechol SPIONs. Magnetic size distributions obtained from the different fits together with the TEM distribution for citrate-coated SPIONs are displayed in (B). In (D) the magnetic size distribution of PVA-catechol SPIONs obtained by fitting the Weibull distribution is reported.
The functional form of the size distributions used is:
Gamma distribution (Γ(a) is Euler’s Gamma function):
( )
( )
1 x a b a x P x e a b − − = Γ Lognormal distribution:( )
( )2 2 log 2 1 2 x a b P x e b xπ
− − ⋅ = ⋅ ⋅ Weibull distribution:( )
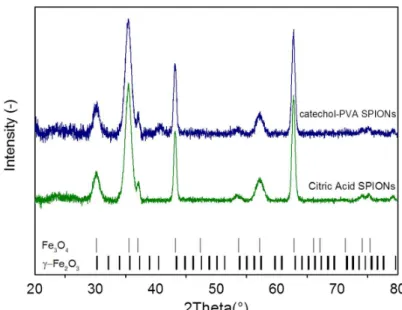
1 b b x a b x P x e a a − − = Figure S3. X-ray diffraction patterns of in-house produced SPIONs. Experimental X-ray diffraction profiles of citric acid coated and PVA-catechol SPIONs along with maghemite (γ- Fe2O3) and magnetite (Fe3O4) reference patterns (respectively COD 9012692 and COD
9005841).
Figure S4. Magnetic field inhomogeneity. The magnetic field inside the magnetic coil was calculated using a pick-up coil along the Z axis and in the XY plane. Here we report a comparison between the values obtained by LIT and the ones calculated from the pick-up coil. As shown the correlation is not perfect and the reason behind these discrepancies can be related to the limited sensitivity of the pick-up coil (± 0.4 kA/m).
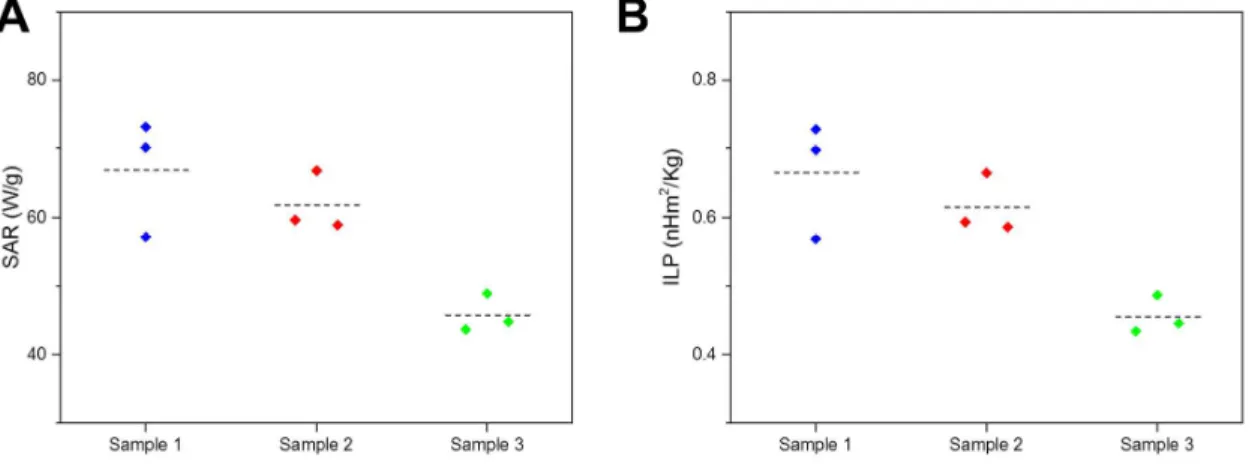
Figure S5. FOC measurements on in-house produced SPIONs. SAR (A) and ILP (B) values were obtained from standard calorimetric measurements with fiber optic at different magnetic field strengths at a constant frequency (f: 523.5 kHz). The obtained values are generally slightly lower than the ones obtained from LIT due to heat dissipation occurring during the measurements. These effects are accentuated at higher field strengths. Experimental values are shown individually (n=9) and expressed in terms of their average (dashed line).
Figure S6. FOC measurements on commercial SPIONs. SAR (A) and ILP (B) values were obtained from standard calorimetric measurements with fiber optic cables (f: 523.5 kHz, H: 13.9 kA/m). The results confirm the batch-to-batch variations already observed with LIT.
Experimental values are shown individually (n=3) and expressed in terms of their average (dashed line).
References
(1) Sturges, H.A. The choice of a class interval. J. Am. Stat. Assoc. 1926, 21, 65-66.
(2) Aragon, F.H.; Coaquira, J.A.H.; Villegas-Lelovsky, L.; da Silva, S.W.; Cesar, D.F.; Nagamine, L.C.C.M.; Cohen, R.; Menéndez-Proupin, E.; Morais P.C.Evolution of the doping regimes in the Al-doped SnO2 nanoparticles prepared by a polymer precursor method. J. Phys. Cond. Matter. 2015, 27, 095301.