2008/50
Femoral stiffness and strength critically depend on loading
angle: a parametric study in a mouse-inbred strain
Romain Voide, G. Harry van Lenthe and Ralph Mu¨ller*
Institute for Biomedical Engineering, University and ETH Zu¨rich, Zu¨rich, Switzerland
Abstract
Biomechanical tests of human femora have shown that small variations of the loading direction result in signifi-cant changes in measured bone mechanical properties. However, the heterogeneity in geometrical and bone tis-sue properties does not make human bones well suited to reproducibly assess the effects of loading direction on stiffness and strength. To precisely quantify the influence of loading direction on stiffness and strength of femora loaded at the femoral head, we tested femora from C57BL/6 inbred mice. We developed an image-based alignment protocol and investigated the loading direction influence on proximal femur stiffness and strength. An aluminum femoral phantom and C57BL/6 femora were tested under compression with different loading direc-tions. Both tests, with the aluminum phantom and the murine bones, showed and quantified the linear depend-ence of stiffness on loading direction: a 58 change in loading direction resulted in almost 30% change in stiff-ness. Murine bone testing also revealed and quantified the variation in strength due to loading direction: 58 change in loading direction resulted in 8.5% change in strength. In conclusion, this study quantified, for the first time, the influence of misalignment on bone stiffness and strength for femoral head loading. We showed the extreme sensitivity of this site regarding loading direction.
Keywords: aluminum phantom; biomechanical testing;
loading direction; mouse strain; proximal femur.
Introduction
Many elderly people suffer from osteoporosis, a skeletal disorder characterized by compromised bone strength leading to an increased risk of fracture. Osteoporosis pri-marily induces bone fragility resulting from decreased bone mass, altered microarchitecture and impaired bone quality w45x. Any bone can be affected, but of special concern are fractures of the hip, the spine and the wrist. Vertebral fractures have serious consequences, including loss of height, severe back pain and deformity. A hip
frac-*Corresponding author: Ralph Mu¨ller, Institute for Biomechanics, ETH Zu¨rich, HCI E357.2, Wolfgang-Pauli-Strasse 10, 8093 Zu¨rich, Switzerland
Phone: q41-44-632-4592 Fax: q41-44-632-1214 E-mail: [email protected]
ture almost always requires hospitalization and major surgery. It can impair a person’s ability to walk unassisted and may cause prolonged or permanent disability and even death w12, 13, 19x. Fractures of the femoral neck mainly occur in two situations. The first and most com-mon one is under impact loading during a fall w22x. The second situation is under non-traumatic loading w4x. In both situations, fracture risk is much higher for people suffering from osteoporosis w13x.
As the femoral neck is a relevant and sensitive site for studying the degree of osteopenia, many researchers have investigated this location w4, 13, 19, 22x. The gold standard to determine bone strength associated with susceptibility to fractures is ex vivo biomechanical testing w7, 8, 14–16, 40, 42x. It has been shown that, in addition to bone structural parameters, such as bone density, bone architecture and bone geometry, the loading con-figuration also plays a non-negligible role in determining bone competence. The direction of the externally applied load on the femur may be an important factor in the eti-ology of hip fractures. In an ex vivo study on human fem-ora, Pinilla et al. w37x showed that a moderate variation in the fall-related loading angle significantly reduced the failure load of the proximal femur. They found that failure load decreased by 24% as the loading angle changed from 08 to 308. Using in vivo quantitative computed tomography (QCT)-based modeling of human femora, similar findings w10x showed that the bending strength of the femoral neck varied significantly for different external loading directions.
Although tests on human bones are the most pertinent when studying human bone properties and diseases, such as osteoporosis, the heterogeneity of the popula-tions does not make them well suited to precisely assess the effects of loading direction on bone strength experi-mentally w2, 11, 14, 30, 31, 37x. The results are affected by differences in geometry and material properties between the samples. Indeed, the mechanical and mate-rial properties variability in human samples is often high, as they originate from people having different sizes, dif-ferent ages, difdif-ferent lifestyles and difdif-ferent genetic back-grounds w33, 35, 39x. This heterogeneity can be largely avoided using animal models, especially when using inbred strains w3, 6, 17, 23, 29, 34, 41x. Animal models complement and extend human studies by allowing close control of environmental factors, by expanding the characterization of phenotypes underlying bone strength and by facilitating breeding strategies to identify genetic linkage w44x. Rat and mouse inbred strains with relevant biological phenotypes related to disease models may provide important genetic clues that will improve the effi-ciency of identifying genes underlying bone strength. Raising inbred strains for mechanical studies allows hav-ing populations with exactly the same age, identical geno-types and constant environmental factors, including diet
Figure 1 (Left) Aluminum phantom of a murine femur. (Right) Phantom embedded in PMMA and mounted on the ball-socket joint support. Here, the phantom is tested under a positive load-ing angle of 208. The alignment in the second plane is neutral. (Bottom) 3D visualization of the phantom with two projections. The phantom geometry is an extrusion along the anteroposterior axis of a 2D shape.
and daily activity. This results in very low variability in bone properties. Consequently, the difference in mechanical properties as measured in experimental test-ing can be assumed to mostly depend on variations in the boundary conditions. As an illustration of the concept of using inbred strains, Wergedal et al. quantified the var-iations for bone properties within several inbred strains, including the B6 strain, and showed that they were very small w47, 48x. Furthermore, Jamsa et al. and Mashiba et al. also performed similar femoral head loading tests on B6 and other inbred strains femora and their results also showed small variations in measured mechanical prop-erties, as well as in bone geometry w23, 32x.
Although engineering principles convey that loading direction will affect bone stiffness and will most likely affect bone strength, this has never been quantified. Therefore, the aim of this study was to quantify the influ-ence of sample positioning on stiffness and strength in the proximal femur. Specifically, we investigated inbred female C57BL/6He mice. This inbred strain is commonly used in bone phenotype studies w1, 9, 20, 24, 25, 27, 28, 32, 38, 45x.
Materials and methods
Overall description
Femoral head loading tests were performed to quantify the effect of loading direction on biomechanical para-meters of the proximal femur. First, we tested an alumi-num phantom of the murine femur, in which the femoral head was loaded under different directions. The alumi-num phantom permitted an excellent control of the test-ing variability, because this test was not affected by variations in material properties or geometry. Second, we developed an alignment device as well as a new posi-tioning protocol for murine femora. After developing this protocol, we performed identical tests, as with the alu-minum phantom, to investigate the influence of loading directions on real proximal femur stiffness and strength.
Mechanical testing of the aluminum phantom
An aluminum phantom of a mouse femur was machined using laser technologies (Figure 1). The phantom geom-etry was an extrusion along the anteroposterior axis of a 2D shape (Figure 1, bottom). The phantom was embed-ded in polymethylmethacrylate (PMMA) and mounted on a ball-socket joint support, which was locked during loading. This support allowed compressive tests of the proximal femur loaded at the femoral head with different angles of inclination in frontal and sagittal planes (Figure 1). Before testing the aluminum sample, the compliance of the fixture was tested. The deformation of the fixture during testing was two orders of magnitude smaller than the phantom deformation and therefore negligible. The tests were performed on a materials testing machine (model 1456, Zwick GmbH and Co., Zwick GmbH, Ulm, Germany). We preloaded the sample with 1 N, the load-ing rate was 0.5 mm/s and the maximal load was limited to 25 N in order not to exceed the elastic limit of the phantom and to prevent permanent damage while
repeating the loading test for each angular configuration. For each orientation of the phantom, tests were repeated three times. During the compressive loading of the alu-minum phantoms, we measured force and displacement from which stiffness was computed. Due to the sym-metry in the geosym-metry of the aluminum phantom (Figure 1, bottom), along the anteroposterior direction in the sag-ittal plane, only inclination angles were tested from 08 to 458 with 58 increments in this direction. In the frontal plane, the inclination was varied from -408 to 408, with 58 increments.
We also analytically computed the maximal bending moment along the midshaft of the phantom relatively to the loading angle. In the analytical model, the phantom was modeled as two beams, one for the midshaft and one for the neck.
Sample alignment
For sample alignment, we dissected left and right femora from 19 fresh frozen 16-week-old C57BL/6He (B6) female mice. Use of mice in this research project was reviewed and approved by the local Institutional Animal
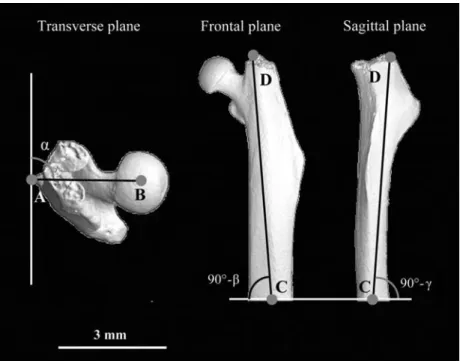
Figure 3 The angular alignment of each femur was measured in three planes.
(Left) Angular alignment a in the transverse plane. (Center) Angular alignment b in the frontal plane. (Right) Angular alignment g in the sagittal plane. Anatomical landmarks were used as reference points to define femur orientation. A: Third trochanter; B: center of the femoral head sphere; C: center of the femoral shaft at the cut position; D: top of the trochanter.
Figure 2 (Left) Exploded view of the alignment device with 10 murine femora ready to be aligned and 10 aluminum cylinders where the femora will be glued. (Right) Detail of the alignment device with aligned bones clamped between the two upper Plexiglas plates.
Care and Use Committee (IACUC). Femora were cut above the condyles, resulting in a length of 11"0.5 mm. Using a stereomicroscope, the femora were positioned in a custom-made Plexiglas alignment device (developed and manufactured in-house) (Figure 2). Online registra-tion of the bones in the alignment device was made with a CCD camera (Canon, Tokyo, Japan) attached to the stereomicroscope and connected to a personal comput-er. Then, using a template that we applied directly on the computer screen, we checked and corrected the sample alignment until it matched the template.
We quantified bone alignment from the camera image on the computer screen. Quantitative assessment of bone alignment was performed in three measurements. First, we measured the angle a in the transverse plane of the femoral neck in the alignment device (Figure 3). The reference points to define this angle were the third trochanter and the center of the femoral head. Then, we determined the angles b and g of the femoral shaft in the frontal and sagittal planes, respectively. To measure
these two angles, we used as reference points the top of the main trochanter and the center of the shaft diam-eter at the cut position (Figure 3). Finally, the absolute angle d between the vertical axis and the femoral shaft was trigonometrically computed from b and g. After the bones were positioned, they were embedded with cya-noacrylate glue (Superglue, UHU Schweiz AG, Scho¨nen-werd, Switzerland) into aluminum bone holders which could then be rigidly fixed in the testing device.
Biomechanical testing of murine proximal femur
For biomechanical testing, we dissected left and right femora from 29 fresh frozen 16-week-old B6 female mice. The animals were stored at -208C and thawed at room temperature just before dissection of the femora. Left and right femora were meticulously prepared in exactly the same way as described in the ‘‘Sample align-ment for mechanical testing’’ section. On the magnified images of the camera, we measured the femoral
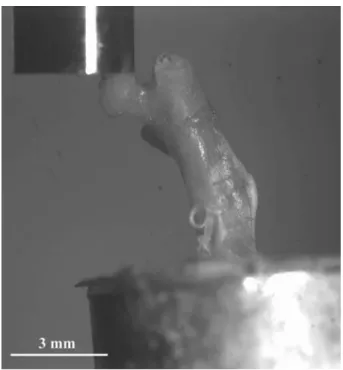
neck-Figure 4 One B6 right femur positioned in the materials testing machine under a negative loading angle of -58 in the frontal plane.
The alignment in the second plane was neutral.
Figure 5 Stiffness of the aluminum phantom in the sagittal plane (top) and in the frontal plane (bottom).
The reproducibility of the measurements was so good that the error bars fall within the data point. (Top) The data were linearly distributed (R2s1.00, p-0.01). Due to symmetry of the
alumi-num phantom, measurements were performed only for positive angles. (Bottom) The data were linearly distributed around the neutral position w-58; 108x (R2s0.99, p-0.01). Stiffness was
maximal at 208 inclination.
shaft angle (NSA angle) of the 58 B6 femora. The femora were then mounted on a ball-socket joint support, which allowed compressive tests of the proximal femur with dif-ferent angles of inclination in the frontal plane (Figure 4). The ball-socket joint was locked during loading. Similarly as for aluminum phantom tests, the deformation of the fixture during testing was two orders of magnitude small-er than the bone deformation and thsmall-erefore negligible. The 58 samples were divided into five groups. Each group was tested with a different inclination angle in the frontal plane ranging from -108 to 108, with 58 incremen-ting. The samples were randomly distributed to each group. Originally, each group had similar numbers of left and right femora, but due to loss of samples during the experiments, the population in each group varied finally from 8 to 13 samples. Some samples were broken during the positioning preparation and others were excluded from the testing results due to poor embedding. The mechanical tests consisted of loading the femoral heads until fracture of the femoral neck occurred, using the same materials testing machine as for the aluminum phantom tests. The samples were pre-loaded with 1 N and load-displacement curves were recorded at a cross-head speed of 0.5 mm/s w43x until failure of the femoral neck. Stiffness was calculated as the slope of the linear part of the load-displacement curve. Strength was also measured as the maximum of the load-displacement curve.
Statistical analysis
In both aluminum phantom and murine bone testing, regression lines were computed to show the linear rela-tionship between stiffness and angular position. In murine bone testing, such a regression line was also computed to illustrate the relationship between bone
strength and angular position. The error in positioning alignment using the newly developed device was calcu-lated with the root mean square (RMS) formula. Stiffness and strengths were compared between the five murine bone groups, with inclination angles ranging from -108 to 108, by one-way analysis of variance (ANOVA) with a least significant difference (LSD) post-hoc analysis. All statistical analysis was performed with the statistical program SPSS 13.0 (The Apache Software Foundation, Chicago, USA).
Results
The compressive loading tests of the aluminum phantom showed an excellent reproducibility of the three meas-urements for each angle wcoefficient of variation (CV) s0.4%x. The relationship between stiffness and angular position in the sagittal plane was linear (Figure 5, R2s1, p-0.01); 58 off-axis loading resulted in a stiffness loss of 8.5%. In the frontal plane, the stiffness had a maximum at 208 inclination (Figure 5). Around the neutral position of 08, between -58 and 108, the stiffness related linearly to inclination angle (R2s0.99, p-0.01) and a change in inclination of 58 indicated a change in stiffness of 50%.
The Plexiglas alignment device was developed to simultaneously align 10 left or 10 right murine femora. Using this new device, the angle in the transverse plane was as908"3.28 (mean"SD) and the axial angle rela-tively to vertical was ds89.68"1.58 (mean"SD). The reproducibility errors (RMS) of a and d were 3.28 and 1.58, respectively.
Figure 6 (Top) Stiffness of aluminum phantom plotted against the loading angle b in the frontal plane. The data are linearly distributed around the neutral position w-58; 108x (R2s0.99,
p-0.01). (Center) B6 proximal femur stiffness plotted for the five tested loading angles b in the frontal plane. The data were lin-early distributed around the neutral position (R2s0.98, p-0.01).
(Bottom) B6 femoral neck strength plotted for the five tested loading angles b in the frontal plane. The data were linearly dis-tributed around the neutral position (R2s0.86, p-0.01).
Table 1 Femoral stiffness and strength of the proximal femur measured in five groups loaded under five different angles in the frontal plane.
Groups (loading directions) -108 -58 08 58 108
Stiffness Mean"SD (N/mm) 29.9"3.7 37"4.3 51.7"6.3 60"7.8 65.9"7.4 CV (%) 12.5 11.6 12.3 13 11.2 Strength Mean"SD (N/mm) 13.2"1.3 12.8"0.8 16"1.7 15.9"1.5 17.5"1.8 CV (%) 10.1 6.5 10.5 9.3 10.3 Population (n) 8 8 9 13 10
Stiffness and strength of the murine bones depended strongly on loading direction. All groups were significantly different for stiffness (p-0.05), as assessed by one-way ANOVA with LSD post-hoc analysis.
Measuring the NSA angle in 58 C57BL/6 femora, we found an average angle of 119.178"1.968 and a CV of 1.64%.
The murine femora showed a significant influence of the inclination angle on the measured bone stiffness and strength in the frontal plane. Stiffness was significantly different between each group (p-0.05) (Table 1). The relationship between stiffness and angular position showed a strong linearity (R2s0.98, p-0.01), just as for
the aluminum phantom. Thus, the bones and the alumi-num phantom demonstrated similar linear trends. The proximal femur stiffness rose linearly with the absolute femoral shaft angle d (Figure 6). A 58 inclination in axial positioning around the neutral position of the B6 femora caused a 28.5% change in stiffness.
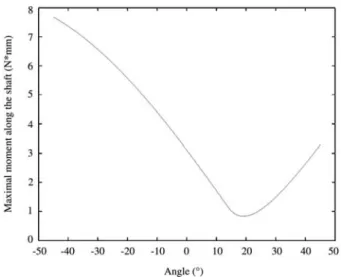
The maximal bending moment along the femoral shaft is illustrated in Figure 7.
Further, all the samples fractured at the femoral neck. Bone strength also showed a linear relationship with angular position (R2s0.86, p-0.01). A 58 inclination in
axial position around the neutral position of the B6 fem-ora caused an 8.5% change in strength. So, strength was also affected by change in angular position, but less than stiffness. Further, strength was less variable than stiff-ness and ranged from 12.8 to 17.5 N, with a maximum CV of 10.5% at the neutral position 08 (Figure 6, Table 1).
Discussion
The aim of this study was to investigate the influence of sample alignment on experimentally determined bone stiffness and strength. We showed that accurate align-ment is of utmost importance for accurate and precise determination of bone stiffness and strength; a 58 ation from perfect vertical alignment led to a 28.5% devi-ation in estimated stiffness. The effects on strength were less dramatic, but with a change of 8.5% per 58 still remained considerable. To limit alignment errors, we developed and designed a new sample alignment pro-tocol which was able to position murine femora with an absolute error (RMS) of only 1.58.
For our parametric analyses, we used a mouse-inbred strain, which has the advantage that the individuals are genetically identical; hence, the femora are very similar.
As an example of the low variability in inbred strains, we measured the NSA angle. This measurement showed lower variety of geometrical properties in B6 inbred
strains than in human populations (B6: 119.178"1.968 and a CV of 1.64%, human: 1278"78 and a CV of 5.5% w46x). Therefore, NSA of B6 is lower than the general
Figure 7 Maximal bending moment along the femoral shaft.
human population average; this is expected considering the differences in the human and mouse morphology and gait. Even more striking is the difference in the standard deviations. The variability is reduced almost four times compared to human populations. This further illustrates the lower variability in an inbred strain model than in human populations and the advantages that come with using this model.
But even femora from inbred mice show some biolog-ical variability. To exclude any variability, we also used an aluminum phantom of a mouse femur. Its material prop-erties are well known and remain constant through a whole test series, as long as the deformations stay within the elastic domain. Therefore, the variations in the test results were only dependent on the changes in loading direction and were not disturbed by any other parameters.
The head of the aluminum phantom was loaded under different directions. The direction range was not chosen to address any physiological relevancy. Our testing setup allowed testing our samples in these extreme conditions. Testing between -208 and q208 would have been enough to observe the misalignment effects. Nevertheless, we presented the whole set of data for the sake of com-pleteness. As expected, reproducibility of the phantom tests was close to perfection. The changes in stiffness due to variations of the loading direction were remarkably pronounced. For the same inclinations, the metallic phantom showed more marked variations in stiffness than the murine bones. Its custom-machined geometry as well as its different material properties made it stiffer than murine bones. Nevertheless, the phantom showed very similar behavior to different loading configuration as real bones. Furthermore, the perfect reproducibility of the tests on one unique sample made this model a very use-ful tool for our parametric research. Indeed, the changes in stiffness were directly related to changes in loading directions without any additional disturbance due to dif-ferences of geometry or material properties from one test to the other.
Stiffness was maximum when the phantoms were test-ed under 208 (Figure 5) The existence of a maximum coincides well with theories which maintain that femoral
geometry and structures are optimized for very precise loading configurations w5, 21, 26, 49x, and suggest that overall geometry of the femur is adapted to best resist physiological loading. At this maximum stiffness angle, the maximal bending moment along the femoral shaft had a minimum (Figure 7). This supports the hypothesis that anatomy and function of the hip mechanical system is optimized in a way that limits the highest bending stresses in the femoral shaft w5, 18, 36x. Moreover, Berg-mann et al. w5x showed that the loading directions in the human femur for all daily activities varied in a very small range. In this study, we demonstrated a somewhat dif-ferent view; the femur seems to have an optimized geom-etry for one specific loading direction. For this loading direction, the femur behaves stiffer and bending stresses in the whole bone are lower.
The angular error in the transverse plane, using the alignment device, is not so important for typical vertical compressive tests of the proximal femur, because, in this configuration, the femur is vertically oriented and the mechanical setup is axis-symmetric around the vertical axis. Of much more importance is the error (RMS) in the axial alignment angle d of 1.58. Taking the linear regres-sion equation as calculated from stiffness against b (Fig-ure 6), a 1.58 axial error resulting from the alignment procedure was then responsible for a 5% error in ness. This means that when testing proximal femur stiff-ness, variability of 5% is explained by the misalignment and the rest of the variability comes from actual differ-ences in bone geometry and material properties. The use of our alignment device showed clear improvements in reproducibility as compared to other studies. The stiff-ness CV of the bone mechanical tests was between 11% and 13% for the different inclination groups (Table 1). These values mean that variability of 6–8% (11–13% minus 5%) comes from differences in bone geometry and material properties between the samples, as 5% are due to sample misalignment in the mechanical setup. This CV of 11–13% is much lower, hence, better than previously reported for this site in mice from the same inbred strain w43x. This previous study reported a CV of 27.5%, more than two times higher than in our study. Not only the stiffness, but also the strength had a smaller CV in our study (Table 1). For different loading angles, the CV of the strength was between 6.5% and 10.5%, which was better than the 13.5% in the aforementioned study w43x. These numbers demonstrate that a good alignment sig-nificantly lowers variability in stiffness and strength measurements.
We tested our bone samples from -108 to q108 of incli-nation in the frontal plane. Physiologically, it would make more sense to test from -58 to q158. Nevertheless, this study did not aim to have any physiological meaning but strictly concentrated on possible misalignments during in
vitro testing. Hence, we tried to show the influence of
misalignment when testing the proximal femur under compression. We decided to test symmetrical misalign-ment, as during experiments, misalignment angles can randomly be either positive or negative. Our experimental tests revealed that small variations in alignment induced large changes in the measured stiffness. Around the neu-tral position of 08, we measured a change in stiffness of
almost 30% for 58 axial inclination in the frontal plane (Figure 6). Small variations in alignment also provoked significant changes in bone strength. This narrow rela-tionship between loading directions and stiffness or strength is particularly relevant, as femoral bone com-petence in inbred mice is a phenotype that is widely assessed. In such studies, large populations of mice are usually experimented within the same strain or between different strains. Comparing results between predefined groups and showing significant differences between treated or untreated animals, between different strains or between different models is often the main goal of these studies. Reducing variability in the results within each group makes the results more powerful, increases the significance of the study and therefore its impact. In the case of femoral bone testing, it is exactly what we achieved in reducing the variability caused by poor sam-ple positioning.
Additionally, this study showed a predictable influence of the loading angle on sample stiffness. In the sagittal plane, the phantom showed a linear dependence between stiffness and loading angle (Figure 5). In the frontal plane, around the neutral position from -58 to 108, stiffness also linearly correlated to inclination angle (Fig-ure 5). Similar linear correlations were found for B6 prox-imal femur stiffness and loading angle around the neutral position (Figure 6). Strength also linearly correlated to inclination. Hence, we are now able to predict the influ-ence of loading direction on femoral stiffness and strength. We showed this predictable influence for murine bone testing.
Because it is not possible to perform such a parametric study on human bones for population heterogeneity rea-sons, we proposed, in this study, to show and quantify the effects of misalignment, when testing the proximal femur, using a femur phantom and an animal model. These models permitted to drastically decrease the var-iations of most factors (morphometry and material prop-erties) influencing the mechanical parameters so that the effect of misalignment could only be directly quantified. We do not claim that our results are directly relevant to human femoral testing. Nevertheless, our model dem-onstrated a linear relationship between misalignment and proximal femur stiffness and strength and indicated that such an influence should also be possible when testing other types of bone, e.g., human bone. Indeed, with the commonly accepted hypothesis that the murine model is an excellent model for bone testing and phenotyping w1, 9, 20, 24, 25, 27, 28, 38, 43, 45x, such a predictable influence of loading inclination on bone stiffness is also likely to exist in the case of human femora.
Future studies, determining bone mechanical proper-ties of healthy and osteoporotic human femora, should therefore include very accurate and reproducible sample preparation and alignment protocols, similar to the ones presented in this publication. In combination with results from Carpenter et al. or Pinilla et al. w10, 37x, this study highlights the importance of loading direction in proximal femur mechanical testing. Changes in loading direction lead to drastic but predictable changes of bone structural capacity. Exact angles therefore need to be reported to be able to compare different studies.
In summary, the proximal femur is a very sensitive site regarding load direction in femoral head compressive tests. Small alignment errors generate significant chang-es in the femoral stiffnchang-ess and strength. Furthermore, loading direction on the femoral head showed a very pre-dictable influence on femoral stiffness. This influence plays a key role in femoral biomechanical testing, as dif-ferent loading directions can potentially have higher effects on mechanical results than intrinsic differences in bone mechanical and material properties. This study was able to quantify these effects in a murine model and also highlighted the importance of accurate control of loading direction also in other bones, such as human femora.
Acknowledgements
This work was supported by ETH Intramural Funding (TH 00124/ 41-2631.5) and the Swiss National Science Foundation (FP 620-58097.99 and PP-104317/1). We thank Paul Lu¨thi and Martin Vogt for machining several parts indispensable for our alignment and testing devices.
References
w1x Akhter MP, Iwaniec UT, Covey MA, Cullen DM, Kimmel DB, Recker RR. Genetic variations in bone density, histomor-phometry, and strength in mice. Calcif Tissue Int 2000; 67: 337–344.
w2x Backman S. The proximal end of the femur: investigations with special reference to the etiology of femoral neck frac-tures; anatomical studies; roentgen projections; theoretical stress calculations; experimental production of fractures. Acta Radiol Suppl 1957; 146: 1–166.
w3x Beamer WG, Donahue LR, Rosen CJ, Baylink DJ. Genetic variability in adult bone density among inbred strains of mice. Bone 1996; 18: 397–403.
w4x Beck TJ, Ruff CB, Warden KE, Scott WW Jr, Rao GU. Pre-dicting femoral neck strength from bone mineral data. A structural approach. Invest Radiol 1990; 25: 6–18. w5x Bergmann G, Deuretzbacher G, Heller M, et al. Hip contact
forces and gait patterns from routine activities. J Biomech 2001; 34: 859–871.
w6x Bonadio J, Saunders TL, Tsai E, et al. Transgenic mouse model of the mild dominant form of osteogenesis imper-fecta. Proc Natl Acad Sci USA 1990; 87: 7145–7149. w7x Bouxsein ML, Courtney AC, Hayes WC. Ultrasound and
densitometry of the calcaneus correlate with the failure loads of cadaveric femurs. Calcif Tissue Int 1995; 56: 99– 103.
w8x Britton JR, Walsh LA, Prendergast PJ. Mechanical simu-lation of muscle loading on the proximal femur: analysis of cemented femoral component migration with and without muscle loading. Clin Biomech (Bristol, Avon) 2003; 18: 637–646.
w9x Brodt MD, Ellis CB, Silva MJ. Growing C57Bl/6 mice increase whole bone mechanical properties by increasing geometric and material properties. J Bone Miner Res 1999; 14: 2159–2166.
w10x Carpenter RD, Beaupre GS, Lang TF, Orwoll ES, Carter DR. New QCT analysis approach shows the importance of fall orientation on femoral neck strength. J Bone Miner Res 2005; 20: 1533–1542.
w11x Cheng XG, Lowet G, Boonen S, et al. Assessment of the strength of proximal femur in vitro: relationship to femoral bone mineral density and femoral geometry. Bone 1997; 20: 213–218.
w12x Cooper C, Atkinson EJ, Jacobsen SJ, O’Fallon WM, Mel-ton LJ III. Population-based study of survival after osteo-porotic fractures. Am J Epidemiol 1993; 137: 1001–1005. w13x Cooper C, Campion G, Melton LJ III. Hip fractures in the elderly: a world-wide projection. Osteoporos Int 1992; 2: 285–289.
w14x Courtney AC, Hayes WC, Gibson LJ. Age-related differ-ences in post-yield damage in human cortical bone. Experiment and model. J Biomech 1996; 29: 1463–1471. w15x Courtney AC, Wachtel EF, Myers ER, Hayes WC. Age-related reductions in the strength of the femur tested in a fall-loading configuration. J Bone Joint Surg Am 1995; 77: 387–395.
w16x Courtney AC, Wachtel EF, Myers ER, Hayes WC. Effects of loading rate on strength of the proximal femur. Calcif Tissue Int 1994; 55: 53–58.
w17x Di Masso RJ, Font MT, Capozza RF, Detarsio G, Sosa F, Ferretti JL. Long-bone biomechanics in mice selected for body conformation. Bone 1997; 20: 539–545.
w18x Duda GN, Heller M, Albinger J, Schulz O, Schneider E, Claes L. Influence of muscle forces on femoral strain distribution. J Biomech 1998; 31: 841–846.
w19x Faulkner KG, Cummings SR, Black D, Palermo L, Gluer CC, Genant HK. Simple measurement of femoral geometry predicts hip fracture: the study of osteoporotic fractures. J Bone Miner Res 1993; 8: 1211–1217.
w20x Ferguson VL, Ayers RA, Bateman TA, Simske SJ. Bone development and age-related bone loss in male C57BL/6J mice. Bone 2003; 33: 387–398.
w21x Ford CM, Keaveny TM, Hayes WC. The effect of impact direction on the structural capacity of the proximal femur during falls. J Bone Miner Res 1996; 11: 377–383. w22x Hayes WC, Myers ER, Morris JN, Gerhart TN, Yett HS,
Lipsitz LA. Impact near the hip dominates fracture risk in elderly nursing home residents who fall. Calcif Tissue Int 1993; 52: 192–198.
w23x Jamsa T, Tuukkanen J, Jalovaara P. Femoral neck strength of mouse in two loading configurations: method evaluation and fracture characteristics. J Biomech 1998; 31: 723– 729.
w24x Jepsen KJ, Akkus OJ, Majeska RJ, Nadeau JH. Hierar-chical relationship between bone traits and mechanical properties in inbred mice. Mamm Genome 2003; 14: 97– 104.
w25x Jepsen KJ, Pennington DE, Lee YL, Warman M, Nadeau J. Bone brittleness varies with genetic background in A/J and C57BL/6J inbred mice. J Bone Miner Res 2001; 16: 1854–1862.
w26x Junqueira L, Carneiro J. Lehrbuch der Cytologie, Histolo-gie und mikroskopischen Anatomie des Menschen. Berlin: Springer 1986.
w27x Kodama Y, Umemura Y, Nagasawa S, et al. Exercise and mechanical loading increase periosteal bone formation and whole bone strength in C57BL/6J mice but not in C3H/Hej mice. Calcif Tissue Int 2000; 66: 298–306. w28x Koller DL, Schriefer J, Sun Q, et al. Genetic effects for
femoral biomechanics, structure, and density in C57BL/6J and C3H/HeJ inbred mouse strains. J Bone Miner Res 2003; 18: 1758–1765.
w29x Kuro-o M, Matsumura Y, Aizawa H, et al. Mutation of the mouse klotho gene leads to a syndrome resembling age-ing. Nature 1997; 390: 45–51.
w30x Lang TF, Keyak JH, Heitz MW, et al. Volumetric quantitative computed tomography of the proximal femur: precision and relation to bone strength. Bone 1997; 21: 101–108. w31x Lotz JC, Hayes WC. The use of quantitative computed
tomography to estimate risk of fracture of the hip from falls. J Bone Joint Surg Am 1990; 72: 689–700.
w32x Mashiba T, Hirano T, Turner CH, Forwood MR, Johnston CC, Burr DB. Suppressed bone turnover by bisphospho-nates increases microdamage accumulation and reduces some biomechanical properties in dog rib. J Bone Miner Res 2000; 15: 613–620.
w33x Mikhail MB, Vaswani AN, Aloia JF. Racial differences in femoral dimensions and their relation to hip fracture. Osteoporos Int 1996; 6: 22–24.
w34x Mikic B, van der Meulen MC, Kingsley DM, Carter DR. Long bone geometry and strength in adult BMP-5 deficient mice. Bone 1995; 16: 445–454.
w35x Nakamura T, Turner CH, Yoshikawa T, et al. Do variations in hip geometry explain differences in hip fracture risk between Japanese and white Americans? J Bone Miner Res 1994; 9: 1071–1076.
w36x Pauwels F. Geasmmelte Abhandlungen zur funktionellen Anatomie der Bewegungsapparates. Berlin: Springer 1965. w37x Pinilla TP, Boardman KC, Bouxsein ML, Myers ER, Hayes WC. Impact direction from a fall influences the failure load of the proximal femur as much as age-related bone loss. Calcif Tissue Int 1996; 58: 231–235.
w38x Silva MJ, Ulrich SR. In vitro sodium fluoride exposure decreases torsional and bending strength and increases ductility of mouse femora. J Biomech 2000; 33: 231–234. w39x Silverman SL, Madison RE. Decreased incidence of hip fracture in Hispanics, Asians, and blacks: California Hospital Discharge Data. Am J Public Health 1988; 78: 1482–1483.
w40x Simoes JA, Vaz MA, Blatcher S, Taylor M. Influence of head constraint and muscle forces on the strain distribu-tion within the intact femur. Med Eng Phys 2000; 22: 453–459.
w41x Simske SJ, Broz JJ, Fleet ML, Schmeister TA, Gayles EC, Luttges MW. Contribution of dietary and loading changes to the effects of suspension on mouse femora. J Exp Zool 1994; 269: 277–285.
w42x Turner CH, Burr DB. Basic biomechanical measurements of bone: a tutorial. Bone 1993; 14: 595–608.
w43x Turner CH, Hsieh YF, Mu¨ller R, et al. Genetic regulation of cortical and trabecular bone strength and microstructure in inbred strains of mice. J Bone Miner Res 2000; 15: 1126–1131.
w44x Turner CH, Roeder RK, Wieczorek A, Foroud T, Liu G, Pea-cock M. Variability in skeletal mass, structure, and bio-mechanical properties among inbred strains of rats. J Bone Miner Res 2001; 16: 1532–1539.
w45x Turner CH, Sun Q, Schriefer J, et al. Congenic mice reveal sex-specific genetic regulation of femoral structure and strength. Calcif Tissue Int 2003; 73: 297–303.
w46x Walton NP, Wynn-Jones H, Ward MS, Wimhurst JA. Fem-oral neck-shaft angle in extra-capsular proximal femFem-oral fracture fixation; does it make a TAD of difference? Injury 2005; 36: 1361–1364.
w47x Wergedal JE, Sheng MH, Ackert-Bicknell CL, Beamer WG, Baylink DJ. Genetic variation in femur extrinsic strength in 29 different inbred strains of mice is dependent on varia-tions in femur cross-sectional geometry and bone density. Bone 2005; 36: 111–122.
w48x Wergedal JE, Sheng MH, Ackert-Bicknell CL, Beamer WG, Baylink DJ. Mouse genetic model for bone strength and size phenotypes: NZB/B1NJ and RF/J inbred strains. Bone 2002; 31: 670–674.
w49x Wolff J. Das Gesetz der Transformation der Knochen. Reprints Medizinhistorischer Schriften. Vol. 4. Stuttgart: Schattauer 1892.
Received June 14, 2007; accepted February 20, 2008; online first May 22, 2008