Sebastian Clauß, Corina Pescatore and Peter Niemz*
Anisotropic elastic properties of common ash
(Fraxinus excelsior L.)
Abstract: Hardwoods in principle show a similar
ortho-tropic behavior as softwoods; however, the ratios of
the mechanical parameters between the three
anatomi-cal directions and their magnitudes are different and
depend strongly on the individual microstructure of the
species. The aim of the current study was to characterize
the 3-D elastic behavior of common ash (Fraxinus
excel-sior L.) by tensile, compression, and shear tests in the
three anatomical directions and stepwise in between,
by means of a universal testing machine in combination
with a digital image correlation technique. Young’s
mod-uli, shear modmod-uli, and Poisson’s ratios have been
deter-mined for the different load directions. From studies on
the radial-tangential plane of other wood species, it is
known that the elastic moduli in the principal directions
and the off-axis elastic moduli vary in a nonlinear
cor-relation, depending on density gradients between
early-wood and lateearly-wood. This angular dependency has been
experimentally and theoretically proven for ash.
Further-more, the dependency of mechanical parameters on the
fiber-load angle has been experimentally determined.
The measurements for principal and off-axis load
direc-tions provide a sound basis for modeling of hardwood
structures.
Keywords: anisotropy, ash, grain angle, orthotropic
prop-erties, ring angle, shear modulus, Young’s modulus
*Corresponding author: Peter Niemz, Institute for Building Materials, ETH Zurich, Stefano-Franscini-Platz 3, CH-8093 Zurich, Tel.: (+41) 44-63-25230, Fax: (+41) 44-63-21174,e-mail: [email protected]
Sebastian Clauß and Corina Pescatore: Institute for Building Materials, ETH Zurich, Switzerland
Introduction
In general, the material behavior of wood has been widely
investigated. Based on solid state physics, the 3-D elastic
material behavior can be described based on the
com-pliance matrix for orthotropic materials (Eq. 1) with the
engineering elastic parameters ε
iiand γ
ijbeing the normal
and shear strains, σ
iiand τ
ijbeing the normal and shear
stresses, E
iiand G
ijbeing moduli of elasticity (MOE) and
shear, and finally the Poisson’s ratios ν
ij, respectively. In
the case of wood, the mechanical properties differ
signifi-cantly within the longitudinal (L), radial (R), and
tangen-tial (T) directions. However, the anisotropic behavior of
wood is individual and depends strongly on its
anatomi-cal structure.
1
0 0 0
1
0 0 0
0 0 0
1
1
0
0
0 0 0
1
0 0 0
0
0
0 0 0
1
0
0
LR LT L R T RL RT L L R T L R TL TR R T L R T T LR LR LT LR LT RT RT LT RTE
E
E
E
E
E
E
E
E
G
G
G
ν
ν
ν
ν
ε
σ
ε
ν
ν
σ
ε
σ
γ
τ
γ
τ
γ
τ
−
−
−
−
−
−
=
(1)
First and foremost, the difference between the L
direc-tion and the direcdirec-tions perpendicular to the grain is
evident, whereas the stiffness in the L direction is about
10–20 times higher than in the R and T directions. As
the L direction predominantly determines most kinds
of structural applications of wood, information about
values of strength and stiffness in that direction is well
available in the literature. Selected parameters of ash
and other hardwoods have been published by Baumann
(1922), Stamer (1935), Kollmann (1941, 1951), Kühne
(1951), Leclerco (1975), Bodig and Jayne (1993), Sliker
and Yu (1993), Szalai (1994), Wagenführ (1996), Pozgaj
et al. (1997), Sell (1997), DIN 68364 (2003), Bonoli et al.
(2005), amongst others. A few authors also presented
results obtained for the traverse directions of individual
softwood and hardwood species, such as Hörig (1933),
Wommelsdorf (1966), Neuhaus (1983), Keunecke et al.
(2008), Hering et al. (2012), and Ozyhar et al. (2012).
However, especially in the case of hardwoods,
com-plete data sets for the three main anatomical directions
rarely exist that are sufficient for static calculations and
modeling in wood construction, and for calculations on
multilayered boards, parquet, or musical instruments
with the finite element (FE) method. Several studies
about grain angle dependencies were published, for
example, by Hearmon and Barkas (1941), Suzuki and
Sasaki (1990), Kabir et al. (1997), Reiterer and
Stanzl-Tschegg (2001), Liu (2002), and Yoshihara (2009). A
comprehensive work about grain and ring angle
depend-ent compression strength and elasticity was presdepend-ented
by Lang et al. (2002), and the angle dependent elastic
behavior within the RT plane of softwoods was
inves-tigated by Hearmon (1948), Kennedy (1968), and Garab
et al. (2010).
It was demonstrated that softwood species in
par-ticular have a strong anisotropic behavior in the RT
plane with the lowest stiffness in between the
anatomi-cal directions. The maximum values of compliance are
reached at an angle of about 45° because of a
compara-ble low shear modulus in the RT plane. However, yew
wood reveals a different behavior with a much lower
degree of anisotropy (Garab et al. 2010), comparable
to theoretically determined values by Grimsel (1999),
Hering et al. (2012), and Ozyhar et al. (2012), for
hard-woods like beech. The calculations were conducted
according to an approach described in Bodig and Jayne
(1993), on the basis of works by Voigt (1928), and Hörig
(1933). The greater variations in the density between
ear-lywood and latewood are most likely responsible for the
distinctive anisotropy of spruce and other comparable
softwood species.
The drawback of previous approaches, however, was
that results of different studies, or dynamic and static
methods were combined to access the data needed for a
comparison of numerical and experimental results. Mostly
dynamic methods, measuring the ultrasound velocities,
as described in Bucur (2006), were used to determine
the shear moduli, and static tests were used to determine
MOEs and Poisson’s ratios.
In the current study, the stiffness of the material
should be determined with increments of 15° in and
between the anatomical directions in the fiber or growth
ring angle, respectively, in tension and compression tests
of the same samples, in the linear elastic region. In
addi-tion, the Poisson’s ratios should be determined in all
loading cases for the individual sectional planes.
Fur-thermore, the shear moduli will be statically determined
by an Arcan testing device for all configurations in the
main anatomical directions. The expectation is that an
objective comparison of numerical and experimental
results will be possible from the data obtained.
Materials and methods
Tension and compression tests
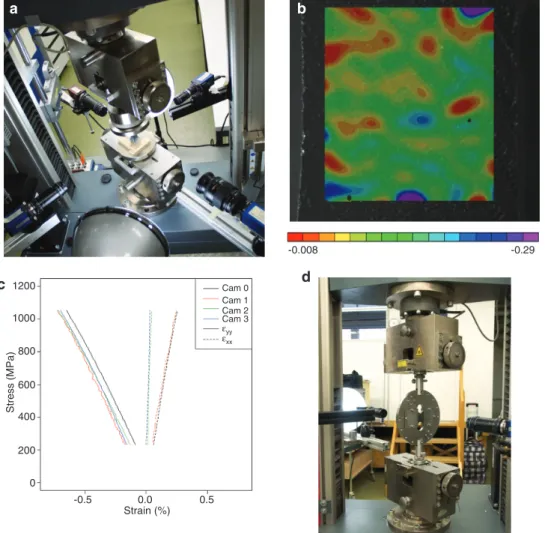
The quasi-static determination of the MOE was performed under ten-sion and compresten-sion load with the same specimens on a Zwick 100 (Zwick GmbH & Co. KG, Ulm, Germany) universal testing machine equipped with a 100 kN load cell (Figure 1a). A displacement-controlled test was performed with a testing speed of about 1 mm min-1. In the
compression test, a simply supported pressure plate was used to avoid bending effects on the specimen. The central load transmission in ten-sion test for both configurations was achieved with conical clamp jaws. For the strain measurement, an optical video image correlation system (VIC 2D, Correlated Solutions Inc., Columbia, SC, USA) was applied that allows an evaluation of the strain distribution over the complete specimen surface. To this purpose, an optimized correla-tion algorithm was available, which provided full-field displacement and strain data for mechanical testing on planar specimens. The in-plane movement was determined as a mean strain in the load direc-tion and across this direcdirec-tion for the selected measurement area of interest with a size of about 11 × 11 mm2 (Figure 1b), in between the
parallel section of the specimen. The system can measure in-plane displacements and strains from 50 microstrains to 2000% strains and above. In the actual measurements, lateral strains in the L direc-tion reach values under T load of about 0.015%. The specimen prepa-ration only requires the application of a random speckle pattern.
The displacement data from each side of the specimen during the tension and compression measurements (in the same run) were determined by three cameras with a resolution of 2048 × 2048, and one with 1628 × 1236 pixels (models AVT Pike F421B and Dolphin F201b, Allied Vision Technologies, Stadtroda, Germany) (Figure 1a). The image capturing was synchronized with the load signal via an A/D converter. After testing all samples, the calculation of the strain data was performed in the linear range of 12.5–50% of the actual force at 0.2% plastic deformation (F0.2) (Figure 1c), to ensure linear
elastic behavior of the material. These orientation dependent maxi-mum forces were determined in a preliminary test for the main direc-tions with F0.2(L) = 60.0 MPa, F0.2(R) = 18.8 MPa, and F0.2(T) = 13.2 MPa. The
forces in the LR and LT planes for the angles θ in between the main directions were calculated based on the Hankinson formula (Eq. 2) with an exponent n = 2.5. 0.2( ) 0.2 0.2( ) 0.2 . sin cos L R T n n L R T F F F F F θ θ θ = + (2)
The strength in the RT plane varies as a sinusoidal function (Eq. 3) described in Bodig and Jayne (1993). The maximum forces in the RT plane with the empirical constant K = 0.2 were calculated with this equation.
0.2( ) 0.2( ) 0.2( ) 0.2( )
2 ( R- T ) K2(-sin 2 )( R T ).
Fθ=π F F + θ F +F (3)
The MOEs for the individual specimens were calculated from the stress-strain data for each specimen surface individually. From these values, an outlier test was performed excluding individual speci-mens with values lying outside the one and a half interquartile range of the complete sample. In several cases, bending effects led to differ-ing values of the opposite cameras, however by averagdiffer-ing the values,
a
b
c
1200 Cam 0d
Cam 1 Cam 2 Cam 3 εyy εxx 1000 800 600 400 200 0 -0.5 0.0 0.5 Strain (%) Stress (MPa) -0.008 -0.29Figure 1 Test setup and data evaluation via video correlation.
(a) Tension-compression setup with four cameras. (b) Area of interest for VIC 2D analysis with strain distribution in percent. (c) Stress-strain diagram of a sample at compression load in the T direction with negative strain in T (εyy), and positive strain in the R and L directions (εxx). (d) Arcan test setup with two cameras.
the errors cancel out each other. From the reduced sample the mean value and variance was calculated.
Shear test
The measurement of the shear modulus was performed according to Arcan et al. (1978). The first application of this test was determin-ing material properties of deformable material by Goldenberg et al. (1958), and it is based on the known Iosipescu test (Iosipescu 1967). A test design analogue to that applied by Xavier et al. (2009), was constructed (Figure 1d). The device consists of two inverted mirrored semicircles made of steel with a thickness of 10 mm, which fits fric-tionless through a key and slot connection. Several circumferential holes allow different force transmissions. The test was performed with a Zwick testing machine with a speed of 1 mm min-1. The strain
meas-urement was performed with the optical method described above with the help of two cameras capturing front and back simultaneously. The measurements were performed on six configurations resulting from the three orientations in the orthotropic material model. A mean
was calculated for the three moduli of the compliance matrix from their corresponding values. The specimens were loaded in the linear elastic region up to the maximum force, which was determined in a preliminary test, where the specimens were loaded until failure. The maximum force for the RT and TR samples was 2 MPa, for the TL and
RL samples it was 5 MPa, and for LR and LT samples it was 4 MPa. The
shear strain was determined in an area of about 4 mm × 20 mm.
Materials
Common ash (Fraxinus excelsior L.) was harvested near Zurich, Switzerland, with an average raw density of 0.60 g cm-3, and an
aver-age moisture content (MC) of about 12%. All test specimens for the determination of the physical and mechanical properties were cut from the same trunk, however, only sapwood was taken for the inves-tigation. All knots or defects in the wood structure were excluded from testing in advance.
Between the anatomical directions, specimens were cut with step-wise increasing fiber and growth ring angles, with an interval of 15°. In
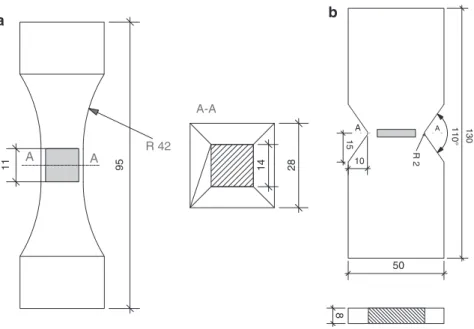
total, 21 different configurations resulted that were tested at a normal climate (20°C/65 RH) only. As the angles deviated sometimes from the target angles, all fiber and growth ring angles of the individual speci-mens were measured optically by image analysis. The tension and compression tests were conducted on 95 mm long, dog-bone shaped specimens (Figure 2a). This shape allows transferring the forces at the clamps to the specimen without deformation in the R and T directions under L tensile load. At least 10 specimens were tested per individual direction. It is hardly possible to gather specimens with straight align-ment of the growth rings over the whole length of the sample, espe-cially in the T direction, therefore supports were glued on the boards made out of beech wood to obtain the desired specimen dimensions.
For the Arcan test specimens of the shape displayed in Figure 2b, (dimensions of 50 × 130 mm2) with a thickness of 8 mm were prepared.
According to Hung and Liechti (1999), the notch was formed with an angle of about 110°, and a radius at the notch base of 2 mm. This geometry seems to be a good compromise for specimens of different orientations in the TR, LR, and LT planes.
Results and discussion
Modulus of elasticity
The results of the measurements are summarized for the
tension and compression tests in the anatomical
direc-tions, and between them in steps of 15° (Table 1). For
the three anatomical directions two mean values were
derived, which belong to samples from different parts
of the trunk. For the L and T orientations, these values
R 42 A A A-A 11 95 14 28
a
b
110° 50 8 A A 15 130 R 2 10Figure 2 Specimen type and dimensions with the optical analyzed area displayed in gray. The dimensions are in (mm). (a) Dog-bone specimen. (b) Arcan specimen.
correspond to each other with only small variations,
which indicates that the position in the trunk is of minor
importance, however, in the case of the radial samples
tested, the variation was about 18%, without showing a
difference in density or growth ring distance. The reason
can be found in angle deviations up to about 15° in the LR
plane of these samples that caused a decrease of the MOE
in the R direction. The number of samples slightly varies
in the different orientations caused by individual
outli-ers and available samples. The mean values in the fiber
directions reach MOEs of about 9.0 GPa in compression
load, and about 8.3 GPa in tension load. The radial
direc-tion shows values of about 1.0 GPa in compression and
tension load. The T direction reveals the lowest values
with 0.6 GPa in compression and tension load.
Accord-ing to the results, no significant variation between the
types of load was obtained which was already shown by
Baumann (1922).
Baumann (1922) obtained slightly higher values in the
L direction for the compression load. Comparing these
results to other studies on ash (Table 2), the currently
obtained values are significantly lower, depending on
individual wood specific parameters. As is well known,
the density particularly plays a major role regarding
the mechanical properties. The results of the displayed
values in Table 2 obviously show an increasing MOE with
increasing density in the L direction. The directions
per-pendicular to the grain do not follow this correlation. On
the whole, one can see a variation in the values of about
Table 1 Results of MOEs determined in tension and compression test with loading in and between the three anatomical directions L, R, T (ω = 12 ± 1%). α (°) Unit, n LT LR CompressionTR LT LR TensionTR 0 E (MPa) 9196 (11.6) 8792 (10.4) 578 (29.6) 8446 (9.9) 8235 (12) 625 (2.7) n 7 10 9 9 9 9 ρ (g cm-3) 0.601 (5) 0.606 (3) 0.577 (4.2) 0.601 (5) 0.608 (3) 0.573 (3.8) 15 E (MPa) 7004 17 7023 (32.9) 602 (12.5) 6106 (12.2) 6305 (18) 574 (14.5) n 8 10 10 10 9 10 ρ (g cm-3) 0.617 (2.6) 0.617 (1.1) 0.617 (1.8) 0.612 (2.8) 0.617 (1.1) 0.617 (1.8) 30 E (MPa) 2403 4 2970 (7.8) 559 (7) 2966 (11.8) 2901 (7.9) 523 (5.5) n 9 10 10 9 10 10 ρ (g cm-3) 0.615 (2.3) 0.624 (2.1) 0.592 (1.4) 0.615 (2.3) 0.624 (2.1) 0.592 (1.4) 45 E (MPa) 1488 10 1684 (7.7) 463 (2.2) 1620 (11.5) 1694 (8.3) 433 (3.2) n 9 10 10 9 9 9 ρ (g cm-3) 0.622 (1.9) 0.611 (3.8) 0.554 (0.5) 0.623 (1.9) 0.614 (3.7) 0.553 (0.4) 60 E (MPa) 984 14.4 1185 (4.8) 663 (4.4) 1052 (18.7) 1155 (6) 655 (2.9) n 10 10 10 10 10 10 ρ (g cm-3) 0.652 (8.1) 0.617 (3.2) 0.599 (0.5) 0.652 (8.1) 0.617 (3.2) 0.599 (0.5) 75 E (MPa) 704 7.2 880 (3.6) 1002 (6.2) 740 (8.4) 849 (3.1) 995 (8.6) n 10 10 10 10 10 10 ρ (g cm-3) 0.608 (2.3) 0.597 (5.9) 0.603 (0.8) 0.608 (2.3) 0.597 (5.9) 0.603 (0.8) 90 E (MPa) 696 4.9 838 (2.9) 1143 (2.3) 637 (6.9) 866 (3.1) 1193 (3.9) n 9 10 9 10 10 9 ρ (g cm-3) 0.62 (1.8) 0.589 (0.7) 0.563 (1.4) 0.62 (1.8) 0.589 (0.7) 0.565 (1.4)
Eij MOE for each orientation in MPa in the ij-plane where the i-orientation has an angle of 0° and the j-orientation has an angle of 90°;
varia-tion coefficient in % in brackets; ρ, raw density in g cm-3; n, number of samples.
Table 2 MOEs for common ash from the literature.
ρ (g cm-3) ω (%) E
L (MPa) ER (MPa) ET (MPa)
Pozgaj et al. (1997) Compression – 10–12 15,798 1875 1268
Niemz (1993) – 0.69 12 13,000 1500 820 Hearmon (1948) – 0.67 9 15,800 1510 800 Szalai (1994) – 0.80 14 15,000 1640 970 Stamer (1935) Compression 0.67 12 16,406 1567 833 Baumann (1922) Compression 0.56–0.61 – 10,336 1669 1062 Baumann (1922) Tension 0.56–0.61 – 8947 1590 1033
25% in the literature, which is not unusual for wood. The
ratios between the individual directions do not spread
in that magnitude. The mean ratio between L:R:T equals
about 13.4:1.6:1.0, which is in accordance with our own
measurements.
In Figure 3, the MOE from tension and compression
tests are displayed in and between the anatomical
direc-tions. In general, the dependency of the MOE on the
orien-tation is particularly pronounced. The modulus decreases
to about one third of the maximum value up to 30°
deflec-tion from the L direcdeflec-tion. In principle, the gradient can be
described with the Hankinson’s formula (Eq. 2), with an
exponent of n = 2.5 for the description of the obtained data
in the LT plane, and 2.25 in the LR plane, for tension as
well as for compression. The data for the RT plane are in
good accordance with the fitted curve obtained by (Eq. 3)
with the empirical factor K = 0.4. The values of MOE in the
main directions for calculation of the fit were taken from
the results obtained in the individual plane.
An off-axis modulus minimum is revealed in the RT
plane at about 45° between the R and T directions as
demonstrated for common spruce by Garab et al. (2010),
who compared experimental results with those
calcu-lated by a tensor transformation in the quest whether it is
admissible to treat the wood species as orthotropic
mate-rials. Lang et al. (2002) investigated several hardwood
species by the same approach and found a significantly
less distinctive anisotropy in the RT plane for all of them.
The comparison and assessment of the common ash
under consideration against the wood specific features
of ring porous hardwood shows, however, a very similar
behavior to spruce.
Poisson’s ratio
The Poisson’s ratios obtained in this research (Table 3)
show typical occurrence for wood with the highest values
in the RT plane, and the lowest values if the lateral
exten-sion is oriented in the L direction. In this case, caused by
the minimal strain in the L direction, the measuring error
has the most extensive influence on the result, evidenced
by the high coefficient of variation. However, the method
also revealed plausible results for these configurations.
A statistically significant difference between tension and
compression values is not detectable on the 5% level of
significance. The only abnormality considering values
from the literature (Table 4) is the Poisson’s ratio in the
TL configuration that is about twice as high as the own
result.
Shear modulus
The results of shear moduli measurements (Table 5)
reveal that the values G
LRand G
RLas well as the values
G
TRand G
RTcorrespond to each other to a high degree,
whereas the values of G
TLand G
LTreveal a remarkable
difference, which is apparent by the higher variation
coefficient for the LT plane. Significantly higher values
were obtained if the load was applied in the T direction.
Higher values were obtained in the LR than in the LT
plane because of the reinforcing effect of the wood rays in
the R direction. The ratio between LR to LT is about 1.2:1.
Significantly lower values were obtained in the RT plane,
because the geometry of the wood cells in this plane abets
shear deformation. Comparison values of shear moduli
in the literature reveal a high variation, caused by
dif-ferent methods used, variations in wood density, and
further influencing factors. In the LR plane, the literature
10 000 8000 6000 4000 2000 0 10 000 8000 6000 500 1000 2000 1500 0 500 1000 2000a
b
c
d
1500 0 4000 2000 0 0 L L RT L L RT T R R T 15 30 45 60 75 90 0 15 30 45 60 75 90 0 15 30 45 60 75 90 0 15 30 45 60 Orientation (°) Orientation (°) 90 75Modulus of elasticity, MOE (MPa)
Figure 3 MOE in different planes under compression or tension load.
(a) Compression modulus from L to T direction. (b) Compression modulus from T to R direction. (c) Tension modulus from L to T direction. (d) Tension modulus from T to R direction.
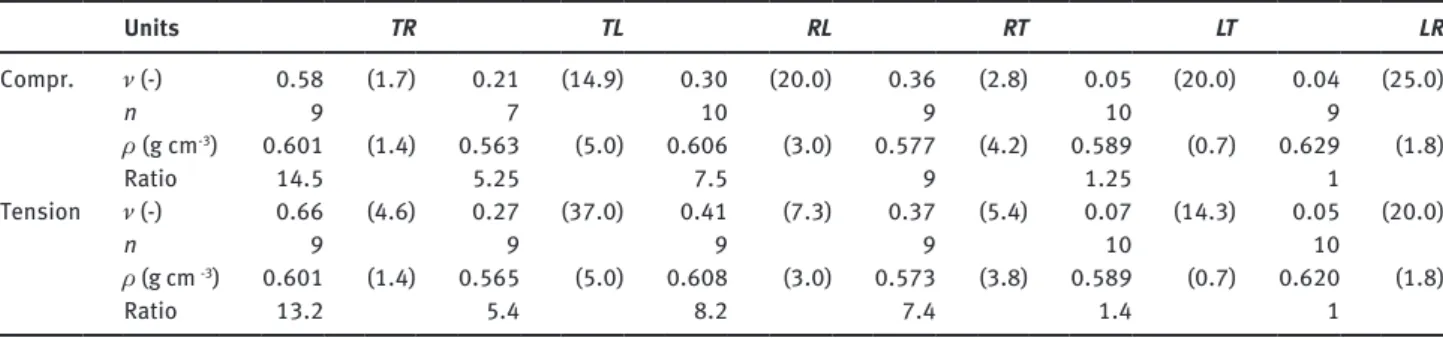
Table 3 Results of Poisson’s ratios for common ash. Units TR TL RL RT LT LR Compr. ν (-) 0.58 (1.7) 0.21 (14.9) 0.30 (20.0) 0.36 (2.8) 0.05 (20.0) 0.04 (25.0) n 9 7 10 9 10 9 ρ (g cm-3) 0.601 (1.4) 0.563 (5.0) 0.606 (3.0) 0.577 (4.2) 0.589 (0.7) 0.629 (1.8) Ratio 14.5 5.25 7.5 9 1.25 1 Tension ν (-) 0.66 (4.6) 0.27 (37.0) 0.41 (7.3) 0.37 (5.4) 0.07 (14.3) 0.05 (20.0) n 9 9 9 9 10 10 ρ (g cm -3) 0.601 (1.4) 0.565 (5.0) 0.608 (3.0) 0.573 (3.8) 0.589 (0.7) 0.620 (1.8) Ratio 13.2 5.4 8.2 7.4 1.4 1
Table 4 Poisson’s ratios for common ash from the literature.
Literature ρ (g cm-3) ω (%) ν TR νTL νRL νRT νLT νLR Pozgaj et al. (1997) – – – 0.73 0.57 0.51 0.47 0.06 0.04 Niemz (1993) – 0.690 12 0.70 0.52 0.30 0.37 0.05 0.03 Hearmon (1948) – 0.670 9 0.71 0.51 0.46 0.36 0.05 0.03 Hearmon (1948) – 0.800 14 0.66 0.65 0.53 0.39 0.06 0.04 Stamer (1935) Compression 0.670 9 0.71 0.51 0.46 0.36 0.05 0.03 Stamer (1935) – 0.560 10 0.70 0.52 0.30 0.37 0.05 0.03
Table 5 Results of shear moduli for common ash.
Units (n) LR LT TR
G (MPa) 1468 (4.7) 1234 (16.5) 302 (6.2)
n 22 24 18
ρ (g cm-3) 0.616 (5.9) 0.601 (7.7) 0.617 (2.0)
Ratio 4.9 4.1 1
values are in the range between 860 and 1410 MPa, and
measurements obtained in this study are nearly
identi-cal with the highest values obtained by Keunecke et al.
(2008). The obtained results in the LT plane are clearly
higher compared to the literature values (Table 6) that are
caused by the extremely high values in the TL samples. In
this plane, the literature values range from about 415 to
1030 MPa, however, a correlation between shear modulus
and density is not evident. In the RT plane, the
meas-ured values are in between the literature data that range
Table 6 Shear moduli for common ash from the literature.Literature Method ρ (g cm-3) ω (%) G
LR (MPa) GLT (MPa) GTR (MPa)
Stamer (1935) – – 9.2 1073 415 500
Hearmon (1948) – 0.670 9 1340 890 270
Hearmon (1948) – 0.800 14 860 619 250
Keunecke et al. (2008) Ultrasound 0.648 – 1410 1030 511
Bucur (2006) Ultrasound 0.670 – 1340 890 270
from about 270 to 511 MPa. The comparison of the results
obtained on the front and back side of the specimens
revealed nearly identical values with a mean coefficient
of variation of about 3.8%.
3-D-description
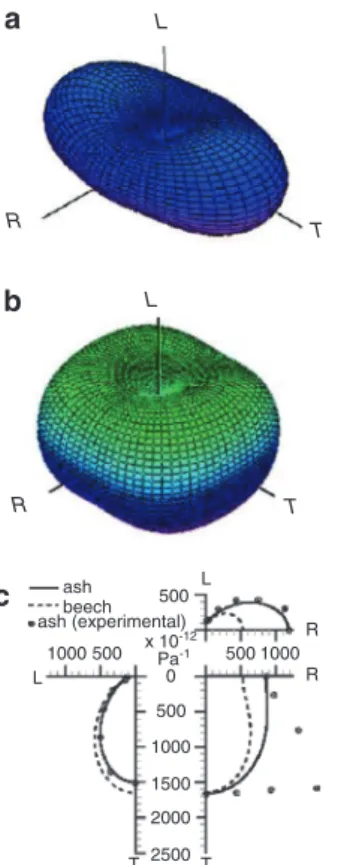
Resulting from the obtained material properties,
defor-mation bodies based on the work of Grimsel (1999), were
created by a theoretical transformation of stress-strain
equations to a 3-D coordinate system. Comparing the shape
(Figure 4a) to displays of several different softwood and
hardwood species by Grimsel (1999), Lang et al. (2002),
Keunecke et al. (2008), Hering et al. (2012), and Ozyhar
et al. (2012), only a small degree of anisotropy was visible
in the case of ash; very comparable to the deformation
bodies of beech or mahogany with the highest
deformabil-ity in the T direction. Under torsion loading (Figure 4b),
ash shows nearly isotropic behavior, also very
compara-ble to the deformation bodies of the hardwoods like beech
or mahogany. Comparing the theoretical results against
stiffness measurements in the individual polar diagrams
for the principal planes of anisotropy (Figure 4c), one
significant inconsistency is visible in the RT plane. Here,
the measurement result reveals a much stronger
anisot-ropy compared to the theoretical compliance, which is
significantly influenced by the shear modulus in the RT
plane.
Conclusion
Compression, tension, and shear tests on common ash
(F. excelsior), with various orientations of the fiber, and
growth ring orientation were conducted. The off-axis
MOE, shear moduli, and Poisson’s ratios were obtained
and used for a comparison of experimental and
theoreti-cal data based on tensor transformations. The
depend-ency on the fiber direction obtained by the experiments
coincided well with the calculated deformations in the
off-axis fiber angles, however, ash showed a significantly
higher degree of anisotropy in the RT plane compared to
the estimated curve progression. It is anticipated that the
ring porous structure of ash with its density variations
along the annual ring progression reveals a similar result
as found for softwoods such as spruce.
Acknowledgments: The authors thank Mr. Thomas
Sch-nider for his accurate preparation of the specimens and
Dr. Stefan Hering for his support with the tensor
trasfor-mation algorithms.
Received September 29, 2013; accepted March 24, 2014; previously published online May 9, 2014
References
Arcan, M., Hashin, Z., Voloshin, A. (1978) A method to produce uni-form plane-stress states with applications to fiber-reinforced materials. Exp. Mech. 18:141–146.
Baumann, R. (1922) Die bisherigen Ergebnisse der Holzprüfungen in der Materialprüfungsanstalt an der TH Stuttgart. Verlag des Vereins Deutscher Ingenieure, Berlin.
Bodig, J., Jayne, A. Mechanics of Wood and Wood Composites. Krieger Publishing Company, 1993.
Bonoli, C., Niemz, P., Mannes, D. (2005) Investigation into certain mechanical properties of ash. Schweizer Zeitschr. Forstwesen. 156:432–437.
Bucur, V. Acoustics of Wood. 2nd edn, Springer-Verlag, Berlin, Heidelberg, Germany, 2006.
DIN 68364 (2003) Properties of wood species – Density, modulus of elasticity and strength, Beuth-Verlag, Berlin.
Garab, J., Keunecke, D., Hering, S., Szalai, J., Niemz, P. (2010) Meas-urement of standard and off-axis elastic moduli and Poisson’s
ratios of spruce and yew wood in the transverse plane. Wood Sci. Technol. 44:451–464.
Grimsel, M. (1999) Mechanisches Verhalten von Holz: Struktur- und Parameteridentifikation eines anisotropen Werkstoffes. Disser-tation, Dresden, p. 89.
Goldenberg, N., Arcan, M., Nicolau, E. (1958) On the most suitable specimen shape for testing shear strength of plastics. Interna-tional Symposium on Plastics Testing and Standardization, Am. Soc. Testing Mats. 247:115–121.
Hearmon, R. The elasticity of wood and plywood. HM Stationery Office London, 1948.
Hearmon, R.F., Barkas W.W. (1941) The effect of grain direction on the Young’s moduli and rigidity moduli of beech and Sitka spruce. Proc. Phys. Soc. 53:674–680.
Hering, S., Keunecke, D., Niemz, P. (2012) Moisture-dependent orthotropic elasticity of beech wood. Wood Sci. Technol. 46:927–938. R T L R T ash beech ash (experimental) 1000 500 500 L R R 0 x 10-12 Pa-1 500 1000 500 1000 1500 2000 2500 L T T
a
b
c
LFigure 4 3-D compliance of common ash. (a) Deformation body under tension/compression load. (b) Deformation body under torsional load. (c) Polar diagrams for the principal planes under tension/compression load. Data for beech from Hering et al. (2012).
Hörig, H. (1933) Zur Elastizität des Fichtenholzes. 1. Folgerungen aus Messungen von H. Carrington an Spruce. Z. Tech. Phys. 12:369–379.
Hung, S.C., Liechti, K.M. (1999) Finite element analysis of the arcan specimen for fiber reinforced composites under pure shear and biaxial loading. J. Compos. Mater. 33:1288–1317.
Iosipescu, N. (1967) New accurate procedure for single shear testing of metals. J. Mater. 2:537–566.
Kabir, M.F., Sidek, H.A., Daud, W.M., Khalid, K. (1997) Effect of moisture content and grain angle on the ultrasonic properties of rubber wood. Holzforschung. 51:263–267.
Kennedy, R.W. (1968) Wood in transverse compression. For. Prod. J. 18:36–40.
Keunecke, D., Hering, S., Niemz, P. (2008) Three-dimensional elastic behaviour of common yew and Norway spruce. Wood Sci. Technol. 42:633–647.
Kollmann, F. Die Esche und ihr Holz. Verlag Julius Springer, Berlin, 1941. Kollmann, F. Technologie des Holzes und der Holzwerkstoffe.
Springer, Berlin, 1951.
Kühne, H. Untersuchung über einige Eigenschaften des Eschen- und Robinienholzes im Hinblick auf dessen Verwendbarkeit für Werkzeugstiele. Forschungsbericht Empa, 1951.
Lang, E.M., Bejo, L., Szalai, J., Kovacs, S., Anderson, R.B. (2002) Orthotropic strength and elasticity of hardwoods in relation to composite manufacture. Part II. Orthotropy of compression strength and elasticity. Wood Fiber Sci. 34:350–365. Leclerco, A. (1975) La qualité du bois de frêne. Bull. rech. Agron.
Gembloux. 10:497–526.
Liu, J.Y. (2002) Analysis of off-axis tension test of wood specimens. Wood Fiber Sci. 34:205–211.
Neuhaus, F.H. (1983) Über das elastische Verhalten von Fichtenholz in Abhängigkeit von der Holzfeuchtigkeit. Holz Roh. Werkst. 41:21–25.
Niemz, P. Physik des Holzes und der Holzwerkstoffe. DRW-Verlag, Leinfelden-Echterdingen, 1993.
Ozyhar, T., Hering, S., Niemz, P. (2012) Moisture-dependent elastic and strength anisotropy of European beech wood in tension. J. Mater. Sci. 47:6141–6150.
Pozgaj, A., Chovanec, D., Kurjatko, S., Babiak, M. (1997) Struktura a vlastnosti drevna. Priroda. Bratislava.
Reiterer, A., Stanzl-Tschegg, S.E. (2001) Compressive behaviour of softwood under uniaxial loading at different orientations to the grain. Mech. Mater. 33:705–715.
Sell, J. Eigenschaften und Kenngrössen von Holzarten. Baufachver-lag, Dietikon, 1997.
Sliker, A., Yu, Y. (1993) Elastic constants for hardwoods measured from plate and tension tests. Wood Fiber Sci. 25:8–22. Stamer, J. (1935) Elastizitätsuntersuchungen an Hölzern. Archive of
Applied Mechanics. 1:1–8.
Suzuki, H., Sasaki, E. (1990) Effect of grain angle on the ultrasonic velocity of wood. Mokuzai Gakkaishi 36:103–107.
Szalai, J. Anisotropic behaviour of wood and wood based materials (in Hungarian). Hillebrand Nyomda Kft., Sopron, 1994. Voigt, W. Lehrbuch der Kristallphysik. B.G. Teubner, Leipzig,
1928.
Wagenführ, R. Holzatlas. Fachbuchverlag, 4th edn, Leipzig, 1996.
Wommelsdorf, O. Dehnungs- und Querdehnungszahlen von Hölzern. Dissertation, Technische Hochschule Hannover, 1966.
Xavier, J., Oliveira, M., Morais, J., Pinto, T. (2009) Measurement of the shear properties of clear wood by the Arcan test. Holz-forschung 63:217–225.
Yoshihara, H. (2009) Prediction of the off-axis stress strain rela-tion of wood under compression loading. Eur. J. Wood Prod. 67:183–188.