Water Penetration into Micro-cracks in Reinforced Concrete
P. Zhang1,2, F. H. Wittmann1,3*, M. Haist2, H. S. Müller2, P. Vontobel4 and T. J. Zhao1
1Department of Civil Engineering, Qingdao Technological University, Qingdao 266033, China
2Institute of Concrete Structures and Building Materials, Karlsruhe Institute of Technology, Karlsruhe, Germany 3Aedificat Institute Freiburg, D-79100 Freiburg, Germany
4Neutron Imaging & Activation Group, Paul Scherrer Institute, CH-5232 Villigen, Switzerland
*Corresponding author: F. H. Wittmann, e-mail: wittmann@aedificat.de
Abstract
Cracks play a decisive role for durability and service life of reinforced concrete structures. In this contribu-tion very fine micro-cracks, which are usually neglected in durability design were induced mechanically into steel reinforced mortar and concrete elements. It turned out that even finest micro-cracks are immediately water filled whenever the surface comes in contact with liquid water. It can be concluded that micro-cracks have also to be taken into consideration in any realistic service life design. The penetration depth of micro-cracks in concrete plays a decisive role for service life. The role of micro-cracks for durability can be significantly reduced by water repellent treatment of the cracked surface. Further investigations will tell us to which degree and in which environment self-healing may reduce the influence of micro-cracks for durability of reinforced concrete.
1
Introduction
Service life of reinforced concrete structures is in many cases limited by penetration of water and aggressive compounds such as chlorides or sul-fates dissolved in water into the pore space. When-ever the penetration depth equals the thickness of the concrete cover and a critical concentration of chloride is reached in the pore liquid close to the surface of steel reinforcement, corrosion may be initiated. This event is usually considered to be the end of the designed service life. As the corrosion products have a significantly higher volume as compared to the volume of the corroding steel, an internal pressure is built up during the process of corrosion, which leads in many cases to crack for-mation and finally to spalling of the concrete cover. This well-known and widely investigated mechanism is at the origin of frequently observed serious damage, which often necessitates expen-sive repair measures at an early stage.
Today in many developed countries repair and maintenance costs of bridges and harbor construc-tions for instance have reached a critical level. The built infrastructure, which is an essential basis for the well-functioning of developed societies, cannot be maintained any more without slowing down progress in other areas. Therefore improvement of durability and extension of repair free service life has become mandatory.
There exist several recommendations how to deter-mine service life of reinforced concrete structures and how to design for required service life. In most cases predictions are based on diffusion of dis-solved ions in water. Under this extremely simpli-fying assumption penetration depth of chloride into concrete can be estimated by Fick’s second law. Traditionally it is assumed that cracks with a visible width on the surface of less than a critical value of for instance 0.2 mm or 0.3 mm can be neglected. One step to deal with the role of cracks in a more realistic way is to relate the crack width to the thick-ness of the concrete cover. Some papers also reported that there exists a threshold value for crack width associated with water permeability tests. This
critical value varies between 50 µm to 200 µm in different papers [1-5]. In strain-hardening cement-based cementitious composites (SHCC) it is also usually assumed that micro cracks with a width smaller than 50 µm or sometimes even 100 µm will not influence the transport processes, which may reduce service life. In the meantime measurements have clearly shown, that even with-out crack formation, a modest applied tensile stress increases the rate of chloride penetration signifi-cantly [6-8]. Then one may question, do very fine cracks in concrete really have no influence on chlo-ride penetration and on service life of reinforced concrete structures. If they have an influence on chloride penetration and rate of carbonation this must be considered in realistic service life design. In this contribution very fine cracks with a crack width at the surface between 20 µm and 130 µm have been created in reinforced mortar and concrete elements by mechanical loading. Then the surface with induced cracks was put in contact with water. The water penetration into the cracks and the adja-cent cementitious material has been followed quan-titatively by means of neutron radiography quanti-tatively.
2
Experimental
2.1 Preparation of Reinforced Elements with Micro-cracks
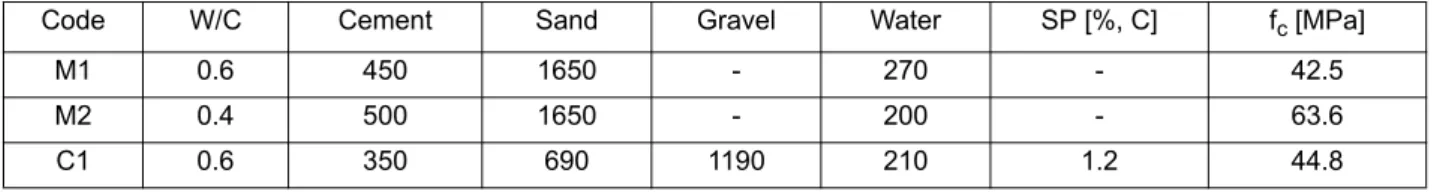
Reinforced concrete elements were prepared with two types of mortar M1 and M2 and one type of concrete C1. The composition and the compressive strength fc at an age of 28 days are given in Table 1. Ordinary Portland cement type CEM I 32.5 R and natural river sand with a maximum grain size of 2 mm were used for the production of mortar. For the production of concrete crushed limestone with a grain size between 2 and 8 mm (size distribution according to EN206) were added. In order to obtain the necessary workability of the fresh mix 1.2 % of a super plasticizer was added during the mixing process.
Table 1: Composition of mortars M1 and M2 and of concrete C1 and compressive strength at 28 days (mass is
indicated as kg/m3).
Code W/C Cement Sand Gravel Water SP [%, C] fc [MPa]
M1 0.6 450 1650 - 270 - 42.5
M2 0.4 500 1650 - 200 - 63.6
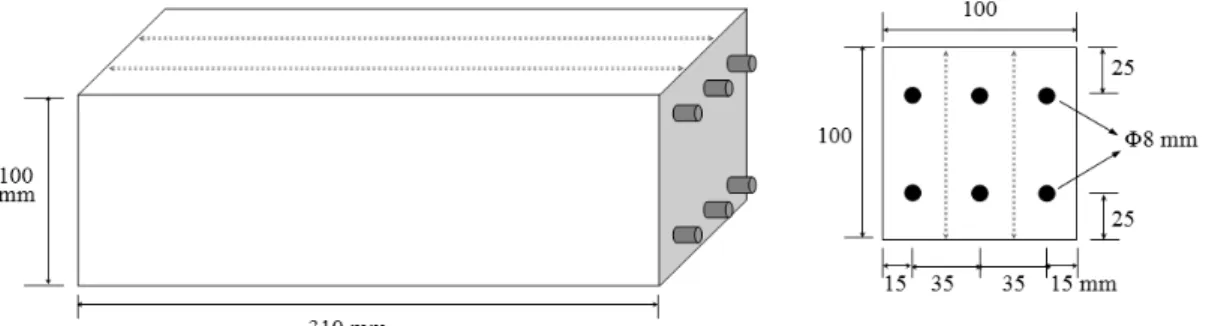
Mortar and concrete prisms with the following dimensions have been cast in steel forms with the following inner dimensions: 100 x 100 x 310 mm. After compaction the fresh concrete was covered with plastic sheets and cured in the laboratory for 24 hours. Then the steel forms were removed and the samples were further cured under water at 20 ± 2 °C until an age of 28 days. The dimensions of the prisms and the position of the steel reinforcement with a diameter of 8 mm are shown in Fig. 1. The cover thickness was chosen to be 21 mm. At an age of 28 days the prisms were cut with a diamond saw to obtain three identical reinforced prisms with the following dimensions: 30 x 100 x 310 mm.
Finally all reinforced slabs with the dimensions of 30 x 100 x 310 mm were loaded under three point bending. In this way cracks could be formed with predetermined crack width in the center of the prisms under well controlled conditions. The load-ing arrangement is schematically shown in Fig. 2. Photos were taken of the cracks with a high resolu-tion digital camera while the prisms were still under load. Photos of the cracks were taken again after unloading. From the photos the crack width could be determined. In this way partial closing of the cracks after unloading could be observed. The crack width on the bottom surface was measured successively every 3 mm as shown in Fig. 3. Then Figure 1: Geometry of reinforced mortar and concrete prisms. All prisms were cut into three identical slices along the dashed lines.
Figure 2: Reinforced beam under three point bending.
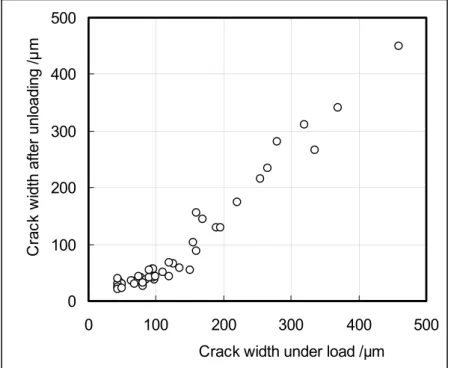
measur-an average value has been determined for each crack. The relation between the measured crack width under load and the crack width after unload-ing is shown in Fig. 4. It can be seen that if the crack width under applied load has been found to be below 100 µm, the crack width is reduced consider-ably after removal of the load. Cracks with a width
of 300 µm and higher remains essentially constant when the load is removed. At the same time the vis-ible crack length was measured on both sides of the reinforced beams under load and after unloading. The average value of the two readings was taken as crack length. The observed crack length is shown in Fig. 5.
Figure 4: The relation between crack width as determined on reinforced samples under applied load and the crack width after unloading.
Figure 5: Crack length as measured on reinforced samples under applied load and after unloading.
0 100 200 300 400 500 0 100 200 300 400 500
Crack width under load /µm
C rac k w idth after un lo adi ng /µ m 0 20 40 60 80 100 0 20 40 60 80 100
Crack length under load /mm
C rac k lengt h af te r unl oading / m m
From all cracked beams a slice with a width of approximately 100 mm was cut with the crack in the center (see Fig. 2). The different crack widths, which were obtained, are given in Table 2. Before measuring capillary absorption, all samples were dried in a ventilated oven at 60 °C for seven days in order to establish well-defined hygral conditions before the cracked surface was put in contact with water. After this drying period, constant weight had been achieved.
2.2 Neutron Radiography
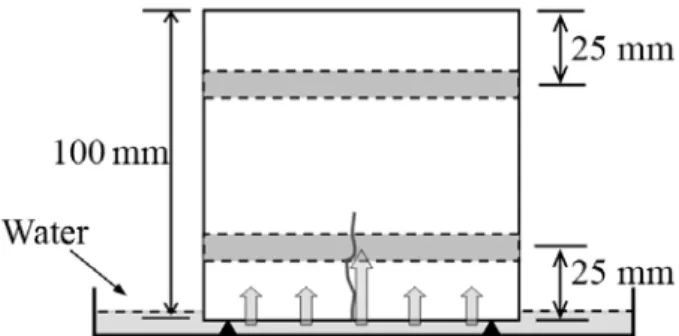
The pre-dried specimens were placed in a neutron beam at Paul Scherrer Institute (PSI) in Switzer-land. Details of the neutron facilities are described elsewhere [9, 10]. The experimental set up of the specimens in the neutron beam is shown schemati-cally in Fig. 6. The vertical square faces (100 x 100 mm) and two opposite side surfaces (30 x 100 mm) were covered with self-adhesive aluminum foil in order to impose unidirectional water migration after contact between water and the bottom surface. The specimens were placed on two knife supports to allow practically complete contact of the lower sur-face with water. First an image was taken in the dry state, which later served as reference. Then the alu-minum container was filled with water. The water level was kept constant at about 3 mm above the lower surface of the specimens.
The neutrons which passed the sample were con-verted into light by a 200 µm thick neutron sensi-tive 6Lif/ZnS scintillation screen. The light is then reflected by a mirror and recorded by a CCD cam-era (see for example [10-12]). During these tests the collimation ratio L/D, with L being the length of the collimator and D being the diameter of the entrance aperture, was 550. The diameter of the neutron beam at the position of the samples was 400 mm. The neutron flux was 5.1 x 106 cm-2 s-1 mA-1. The size of the images was 2160 pixels x 1600 pixels with each pixel having a size of 0.0109 mm2.
3
Results
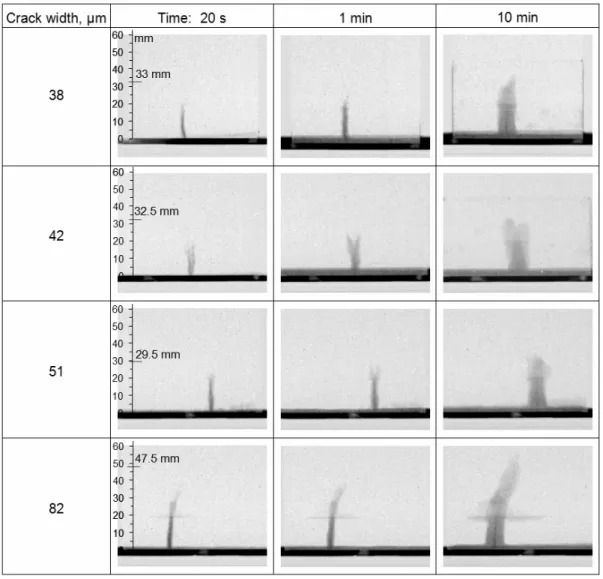
The penetration of water into mortar M1 and M2 in the first ten minutes after contact of the bottom surface with water is shown in Figures 7 and 8. The experiments have been continued for one hour at least (see Fig. 10). It can be seen that cracks in mortar M1with a crack width measured on the sur-face of 38 and up to 82 µm are filled within a few seconds. In Figs. 7 to 10 the height of capillary absorbed water in the cracks and in the neighbor-ing cementitious material can be seen by means of the length scale at the left side of the neutron images taken at 20 seconds after contact with water. On the length scale the length of the crack as it can be observed on the two opposite vertical side surfaces is indicated in mm. As soon as given crack is water filled, the water migrates by capil-lary action vertically and out of the water filled crack also horizontally into the neighboring porous mortar matrix. From fracture mechanics studies we know that ahead of the crack tip a fracture process zone is created. In this zone the imposed strain overcomes the tensile strength and finally the ten-sile strain capacity of the material. This is the proc-ess of crack formation and crack propagation in concrete. The strength decreases due to micro crack formation in the fracture process zone. As expected water absorption into this damaged zone, the fictitious crack, in the mortar is quicker than water absorption into the undamaged material along the crack surface.
The wider the crack, the further developed is the frac-ture process zone as can be seen in the case of the crack with a width of 82 µm as compared to the crack with a width of 38 µm. The length of the fracture process zone also increases with the crack width. Table 2: Width of cracks, which have been further
investigated, after unloading as formed in mortars M1 and M2 and in concrete C1.
Code Crack width, µm M1 38, 42, 51, and 82 M2 20, 55, 105, and 130 C1 20, 30, and 43
Figure 6: Experimental set up for the capillary absorption test of a cracked specimen in the neutron beam.
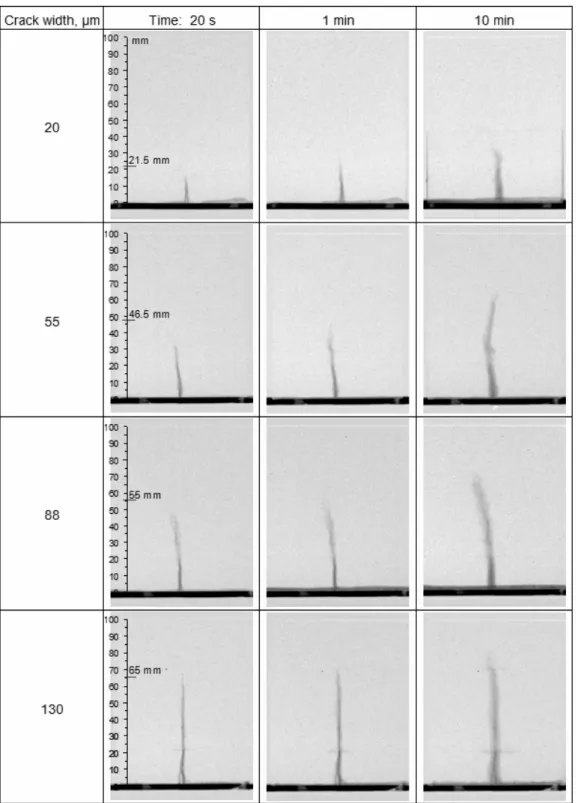
The apparent branching of the cracks, which can be observed in particular on the images taken on the two cracks with a width of 42 and 51 µm can be explained by the fact that the crack front is not exactly parallel to the bottom surface and the crack front is not exactly normal to the vertical square surfaces. Near the vertical square surfaces the crack runs slightly deeper into the material. It is of special interest to see that the interface between the steel and the mortar remains nearly undamaged if the crack width remains below 42 µm. If the crack width has reached values of 51 and 82 µm, how-ever, the interface obviously is damaged. That means the bond strength has been overcome. In the case of the crack width of 82 µm the interface is also water filled within a period of a few seconds. The water penetration into micro cracks in mortar M2 is shown in Fig. 8. It can be seen that micro cracks with a width as small as 20 µm are also water filled immediately if the surface of mortar get in
contact with water. Then the water is absorbed from the water filled crack horizontally by capillary action. It seems that in this mortar with a signifi-cantly higher strength the fracture process zone runs deeper into the material. This is a clear indica-tion that mortar M2 is more brittle than mortar M1. The interface between the mortar and the steel rein-forcement is damaged only at a crack width of 130 µm in mortar M2. The interface between mor-tar and steel obviously becomes stronger with decreasing water-cement ratio.
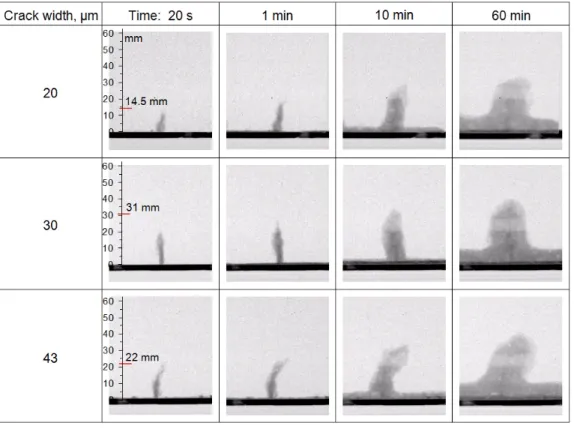
The water penetration into micro cracks in concrete C1 is shown in Figure 9. It can be seen that also in concrete water penetrates immediately into micro cracks with a width of not more than 20 µm. As has been observed on mortar specimens the water then migrates horizontally into the concrete and into the fictitious crack ahead of the real crack. Water migrates also out of the fictitious crack into the neighboring concrete normal to the crack surface. Figure 7: Visualization of water penetration into micro-cracks in mortar M1 with different crack widths.
From Figures 7 to 9 the rate of capillary penetration can be determined in the vertical direction and in the horizontal direction. As a first approximation and by neglecting the influence of gravity the pen-etration depth as function of time can be described by the following equation:
(1)
In this equation x stands for the penetration depth. x can be split in xh the penetration depth in horizon-tal direction and in xv the penetration depth in ver-tical direction, t is the time and B the coefficient of capillary penetration, which is usually indicated as m/h1/2 or mm/s1/2.
(2)
In equation (2) σ stands for the surface tension of the pore liquid, r is an effective pore radius repre-senting the pore size distribution of the porous material; Θ is the wetting angle, and η the viscosity of the penetrating liquid. B can be assumed to be practically equal in horizontal and in vertical direc-tion for small penetradirec-tion depth. For larger values of the penetration depth Bv in vertical direction becomes smaller than Bh in horizontal direction because of the influence of gravity.
From Figures 7 to 9 the coefficient of vertical water penetration Bv can be determined directly by plotting the water penetration depth as function of square root of time. The horizontal movement of capillary
absorbed water out of the water filled cracks is plot-ted in Figures 10 a to 10 c for mortar M1, mortar M2 and concrete C1. These figures indicate the horizon-tal progression of water with time. By means of Eq. (1) the coefficient of horizontal water penetration Bh can be determined from these data too.
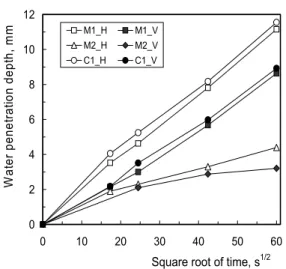
In Figure 11 the observed water penetration in hor-izontal and vertical direction is plotted as function of the square root of time. It can be seen that capil-lary penetration of mortar M1 and concrete C1 in the vertical and in the horizontal direction can be described very well by applying Eq. (1). The val-ues, which have been obtained for Bh and Bv from the data shown in Fig. 11 are presented in Table 3. Figure 9: Visualization of penetration of water into micro cracks in concrete C1.
a) Mortar M1 b) Mortar M2 c) Concrete C1
Figure 10: Water profiles as function of time as observed in mortar M1 (a), mortar M2 (b) and concrete C1(c) in
The capillary absorption of concrete is slightly higher than the corresponding value of mortar M1. As the volume concentration of dense aggregates is higher in Concrete C1, the capillary penetration after a given time should be significantly smaller. This apparent contradiction can be explained by the disturbance of the formation of a homogeneous matrix in presence of coarse aggregates. Some authors call this effect the interfacial transition zone. Due to the disturbance of the hydration in presence of aggregates, the mortar matrix in con-crete becomes more permeable. Capillary penetra-tion in the vertical direcpenetra-tion, however, is signifi-cantly smaller than in the horizontal direction. Most probably this is due to the influence of gravity. The penetration depth in mortar M2, however, is significantly smaller because of the lower water-cement ratio. From Fig 11 it can also be seen that the coefficients of capillary penetration into mortar M1 and concrete C1 remain practically con-stant during the total period of observation. The coefficient of capillary penetration into M2, in con-trast, decreases with time. From the data shown in Fig. 11 we can also determine the coefficients of horizontal and vertical capillary penetration Bh and Bv. If we neglect the comparatively high initial val-ues of the coefficient of capillary penetration, we obtain a nearly constant value after a penetration time of about 10 minutes. All values obtained are compiled in Table 3.
4 Conclusions
From the results described in this contribution we may conclude:
- Even very fine micro-cracks are filled with water immediately if the cracked surface of concrete is put in contact with water;
- With increasing water-cement ratio the coeffi-cient of capillary penetration into concrete increases as expected;
- Water filled cracks are internal water sources and the water penetrates from there further into the porous material ahead of the cracks and normal to the crack surface;
- Water penetrates preferentially into the dam-aged zone of the fictitious crack ahead of a real crack;
- Even finest micro-cracks have to be taken into consideration in realistic service life pre-diction and design.
- It has to be clarified now to which extent ions dissolved in water, such as chloride or sulfate ions, follow the water during capillary absorption.
- Further investigations will tell us under which conditions and to which degree fine micro-cracks can be closed again by self-healing.
Acknowledgement
The authors would like to thank Mr. J. Hovind of Neutron Imaging & Activation Group, PSI, Switzerland, for the assistance to operate the neu-tron facilities. The first author was enabled to work at KIT and at PSI due to a generous grant by Alex-ander von Humboldt (AvH) Foundation. Substan-tial support by National Natural Science Founda-tion of China (51278260) and Collaborative Inno-vation Center of Engineering Construction and Safety in Shandong Blue Economic Zone is also gratefully acknowledged.
Figure 11: Water penetration depth in mortar M1, M2
and concrete C1 as function of square root of time. 0 2 4 6 8 10 12 0 10 20 30 40 50 60
Square root of time, s1/2
W at er penet rat ion dept h, m m M1_H M1_V M2_H M2_V C1_H C1_V
Table 3: Coefficient of capillary penetration Bv and Bh in m/h1/2 as determined for mortar M1, mortar M2 and concrete C1 in vertical and horizontal direction.
Direction Mortar M1 Mortar M2 Concrete C1 Vertical, Bv 1.44 × 10⁻⁴ 0.30 × 10⁻⁴ 1.49 × 10⁻⁴
References
1. C. M. Aldea., S. P. Shah and A. Karr,
Perme-ability of cracked concrete, Materials and
Structures 32 (1999) 370-376.
2. S. S. Park, S. J. Kwon, S. H. Jung and S. W. Lee, Modeling of water permeability
in early aged concrete with cracks based on micro pore structure, Construction and
Building Materials 27 (2012) 597-604. 3. K. J. Wang, D. C. Jansen, S. P. Shah and
A. F. Karr, Permeability study of cracked
concrete, Cement and Concrete Research 27
(1997) 381-393.
4. S. T. Yi, T. Y. Hyun and J. K. Kim, The
effects of hydraulic pressure and crack width on water permeability of penetration crack-induced concrete, Construction and
Building Materials 25 (2011) 2576-2583. 5. C. Desmettre and J. P. Charron, Novel water
permeability device for reinforced concrete under load, Materials and Structures 44
(2011) 1713-1723.
6. F. Jiang, F. H. Wittmann and T. Zhao,
Influ-ence of mechanically induced damage on durability and service life of reinforced con-crete structures, Restoration of Buildings
and Monuments 17 (2011) 103-110.
7. P. Zhang, F. H. Wittmann, T. Zhao and
E. Lehmann, Penetration of water into
uncracked and cracked steel reinforced con-crete elements: visualization by means of neutron radiography, Restoration of
Build-ings and Monuments 15 (2009) 67-76.
8. P. Zhang, F. H. Wittmann, T. Zhao and
E. Lehmann, Neutron imaging of water
pen-etration into cracked steel reinforced con-crete, Physica B: Condensed Matter 405
(2010) 1866-1871.
9. P. Zhang, F. H. Wittmann, T. Zhao and
E. Lehmann, Observation and
Quantifica-tion of Water PenetraQuantifica-tion into Frost Dam-aged Concrete by Neutron Radiography,
Restoration of Buildings and Monuments 16 (2010) 195-210.
10. F. H. Wittmann, P. Zhang, E. Lehmann and T. Zhao, Visualization of Frost Damage in
Concrete by means of Neutron Radiography,
Basic Research on Concrete and Applica-tions, Proc. ASMES International Workshop, F. H. Wittmann and O. Mercier, editors, Aedificatio Publishers Freiburg, Germany (2011) 155-174.
11. B. Villmann, V. Slowik, F. H. Wittmann, P. Vontobel and J. Hovind, Time-dependent
Moisture Distribution in Drying Cement Mor-tars – Results of Neutron Radiography and Inverse Analysis of Drying Tests, Restoration
of Buildings and Monuments 20 (2014) 49-62; DOI 10.12900/RBM14.20.1-0004.
12. F. H. Wittmann, Porosität und
Feuchtigkeits-gehalt, in WTA Schriftenreihe Report No. 3,
Feuchtigkeitstransport und Dauerhaftigkeit von Beton, F. H. Wittmann editor (1992) 1-22.