HAL Id: inserm-02540074
https://www.hal.inserm.fr/inserm-02540074
Submitted on 10 Apr 2020
HAL is a multi-disciplinary open access
archive for the deposit and dissemination of
sci-entific research documents, whether they are
pub-lished or not. The documents may come from
teaching and research institutions in France or
abroad, or from public or private research centers.
L’archive ouverte pluridisciplinaire HAL, est
destinée au dépôt et à la diffusion de documents
scientifiques de niveau recherche, publiés ou non,
émanant des établissements d’enseignement et de
recherche français ou étrangers, des laboratoires
publics ou privés.
STAT3 Phosphorylation and Downregulate the
Metabolic Enzyme ETNPPL, a Negative Regulator of
Glioma Growth
Nicolas Leventoux, Meera Augustus, Safa Azar, Sébastien Riquier,
Jean-Philippe Villemin, Sophie Guelfi, Layal Falha, Luc Bauchet, Catherine
Gozé, William Ritchie, et al.
To cite this version:
Nicolas Leventoux, Meera Augustus, Safa Azar, Sébastien Riquier, Jean-Philippe Villemin, et al..
Transformation Foci in IDH1-mutated Gliomas Show STAT3 Phosphorylation and Downregulate the
Metabolic Enzyme ETNPPL, a Negative Regulator of Glioma Growth. Scientific Reports, Nature
Publishing Group, 2020, 10 (1), pp.5504. �10.1038/s41598-020-62145-1�. �inserm-02540074�
Transformation Foci in
IDH1-mutated Gliomas Show STAT3
phosphorylation and Downregulate
the Metabolic enzyme etnppL,
a negative Regulator of Glioma
Growth
n. Leventoux
1,2, M. Augustus
1, S. Azar
1, S. Riquier
3, J. p. Villemin
4, S. Guelfi
1, L. falha
1,
L. Bauchet
1,5, c. Gozé
1,6, W. Ritchie
4, t. commes
3, H. Duffau
1,5, V. Rigau
1,7,9&
J. p. Hugnot
1,8,9*IDH1-mutated gliomas are slow-growing brain tumours which progress into high-grade gliomas. The early molecular events causing this progression are ill-defined. Previous studies revealed that 20% of these tumours already have transformation foci. These foci offer opportunities to better understand malignant progression. We used immunohistochemistry and high throughput RNA profiling to characterize foci cells. These have higher pSTAT3 staining revealing activation of JAK/STAT signaling. they downregulate RnAs involved in Wnt signaling (DAAM2, SFRP2), eGfR signaling (MLC1),
cytoskeleton and cell-cell communication (EZR, GJA1). in addition, foci cells show reduced levels of RnA coding for Ethanolamine-Phosphate Phospho-Lyase (ETNPPL/AGXT2L1), a lipid metabolism enzyme. etnppL is involved in the catabolism of phosphoethanolamine implicated in membrane synthesis. We detected etnppL protein in glioma cells as well as in astrocytes in the human brain. its nuclear localization suggests additional roles for this enzyme. ETNPPL expression is inversely correlated to glioma grade and we found no etnppL protein in glioblastomas. overexpression of etnppL reduces the growth of glioma stem cells indicating that this enzyme opposes gliomagenesis. collectively, these results suggest that a combined alteration in membrane lipid metabolism and STAT3 pathway promotes IDH1-mutated glioma malignant progression.
Diffuse low-grade gliomas (DLGG, WHO grade II) is a subtype of glial brain tumours typically affecting young patients in their third or fourth decades1. Compared to glioblastomas, much less is known about these tumours.
They are mostly found in the brain white matter and are probably derived from transformation of oligodendro-cyte progenitors which are the main proliferative cell population in the brain. They are most often found in func-tional brain areas such as the motor cortex, Broca’s area, frontal lobe and insula. Histologically, diffuse low-grade 1Institute for Neurosciences of Montpellier, Institut National de la Santé et de la Recherche Médicale (INSERM).
U1051 - Hôpital Saint-Éloi, 80 Avenue Augustin Fliche - 34091 Montpellier cedex 5, Montpellier, France. 2Keio
University School of Medicine, Physiology Department. 35 Shinanomachi, Shinjuku-ku, Tokyo, 160-8582, Japan.
3Institute for Regenerative Medicine & Biotherapy, Hôpital Saint-Éloi, 80 Avenue Augustin Fliche - 34091 Montpellier
cedex 5, Montpellier, France. 4Institute of Human Genetics, Centre National de la Recherche Scientifique (CNRS).
UMR9002, 141 rue de la Cardonille, 34000, Montpellier, France. 5Neurosurgery Department. Hôpital Gui de Chauliac,
80 Avenue Augustin Fliche, 34295, Montpellier, France. 6Laboratory of Solid Tumors Biology. Hôpital Lapeyronie, 371
Avenue du Doyen Giraud, 34295, Montpellier, France. 7Department of Pathology and Oncobiology. Hôpital Gui de
Chauliac, 80 Avenue Augustin Fliche, 34295, Montpellier, France. 8University of Montpellier, Place Eugène Bataillon,
34095, Montpellier, Cedex 05, France. 9These authors jointly supervised this work: Rigau V. and Hugnot J. P. *email:
jean-philippe.hugnot@umontpellier.fr
gliomas are divided into astrocytomas and oligodendrogliomas as tumoral cells look like normal brain astrocytes or oligodendrocytes2. However, recent works based on single-cell RNA-sequencing approaches have revealed that
diffuse low-grade gliomas are in fact composed of at least two tumoral cell types with similarities to astrocytes and oligodendrocytes3,4. With regards to the mutational landscape, one recurrent DNA alteration found in 80%
of patients is a missense mutation for the IDH1 gene (isocitrate dehydrogenase) involved in metabolism and
epi-genetic regulations5. Astrocytomas have an additional mutation for the ATRX gene whereas oligodendrogliomas
show a 1p19q co-deletion. These mutations negatively influence the differentiation of progenitors which then accumulate in the brain. Treatment of these tumours consists of a maximal surgical resection often performed in awake-condition so as to preserve brain functional areas6. However, owing to the infiltrative nature of these
tumours, it is not possible to remove all tumoral tissue and the tumour inexorably relapses. After an initial slow growth (2 mm per year), diffuse low-grade gliomas inescapably progress into rapidly-growing tumours, namely grade III gliomas or glioblastomas. The mutational landscape of these high-grade gliomas derived from low-grade lesions has been fully explored recently7,8. This malignant transformation then leads to rapid patient death. The
duration of transition from low-grade to high-grade glioma is highly variable between patients. This can be very short (6 months) or very long (>15 years). Currently, there is no good predictive tool to evaluate this time and this poses important problems for clinicians to monitor the patients and give appropriate treatments. If patients could be identified with increased risk for progression, they might be offered early adjuvant treatment or targeted new therapeutic approaches. In order to do so, we need to understand in depth, the early molecular mechanisms by which an initial diffuse low-grade glioma progresses into a higher grade, a process which is still unclear. One major difficulty to characterize this initial malignant progression is to be able to capture the key transformation steps occurring in the tumour. We attempted to fill this gap by extensive examination of diffuse low-grade glioma sections. This led us to identify foci of hypercellularity in diffuse low-grade gliomas9. These foci are present in
20% of patients. Importantly, these patients have a worse prognosis compared to foci-free patients. We reported a first partial characterization of the cellular and DNA alterations found in these foci using IHC and FISH. We found that foci cells 1- have a higher mitotic index (Ki67+ cells) and vascular density, 2- can show sign of hypoxia (HIFα staining), 3- can have frequent chromosome 7 polysomy as well as higher intensity for EGFR and AKT stainings compared to the rest of the tumour. These alterations strongly suggest that these foci are composed of cells undergoing further transformation events.
In this article, we wanted to understand further how diffuse low-grade gliomas progress into high-grade gli-omas by characterizing early histological signs of transformation. We thus focused our study on these foci which are likely candidates of early transformation. Our objectives were 1/to study pathways which might allow for-mation of these foci, 2/to identify genes whose expression is dysregulated in these foci, 3/to perform functional analysis of one identified gene in vitro. We used IHC and high throughput RNA profiling to characterize these foci in 8 tumours. This led us to identify a metabolic enzyme (ETNPPL, Ethanolamine-Phosphate Phospho-Lyase) which was further studied at the functional level.
Material and Methods
Selection of patients.
All methods and all experimental protocols used in this article were carried out andapproved in accordance with relevant guidelines and regulations of the French “Institut National de la Santé et de la Recherche Médicale” (INSERM). Glioma samples were obtained from the “Centre de Ressources Biologiques” (Collection NEUROLOGIE (8) DC-2013-2027/DC-2010-1185/Authorization AC-2017-3055/Research Protocol P487) and our research approved by the Institutional Review Board (2019_IRB-MTP_10-15) of the Montpellier Hospital. Informed and written consents were obtained from the patients before using their samples. Gliomas were graded by a neuropathologist (Pr V. Rigau) and cases with foci were selected according to criteria reported in9 e.g. (1) higher cellular density compared to the rest of the tumour, (2) nuclear atypia with or without
anisocar-yosis, (3) enhanced vascularization of the foci with early signs of endothelial proliferation. Clinical and tumour pathological features are summarized in Table S1. For RNA extraction, samples were obtained from patients who had a first surgery and no pre-operative therapies. IDH1 mutation was established by immunohistochemistry against the IDH1 R132H epitope with at least 80% of positive cells in both DLGG and foci for each tumour. IDH1 mutation was then confirmed by sequencing of the IDH1 gene exon 4. 1p/19q mutation was identified by molecular detection of loss of heterozygosity using polymorphic markers to screen both whole 1p and 19q
chro-mosome arms as described in10. ATRX mutation was established by loss of nuclear staining with IHC using ATRX
polyclonal antibody (SIGMA Ref HPA001906). To explore the expression of ETNPPL by immunofluorescence in the non-tumoral human, we used a cortical sample removed during neurosurgical approach for meningioma resection.
Immunohistochemistry (IHC) and Immunofluorescence (IF).
All antibody references and dilutionsare indicated in Table S2. IHC for pSTAT3 and ETNPPL were performed on paraffin-embedded tumours fixed with formalin 37% (FFPE) for 1 day. Stainings were done using 4 μm sections and the Leica Biosystems’ Bond Polymer Refine Detection kit (DS9800) after suitable epitope retrieval with citrate buffer and according to man-ufacturer’s protocol. Immunofluorescences were done on frozen sections of tumours fixed with paraformalde-hyde 4% for 1 hour and cryopreserved in successive sucrose solutions (10%, 20%, 30%, 24 h each). Sections (10
μm) were permeabilized and saturated with 3% triton X-100 and 10% donkey serum diluted in PBS 1X and
then incubated overnight with primary antibodies. Secondary conjugated antibodies Alexa 488 or Cy3 (Jackson & Molecular Probe) were incubated for 90 minutes. Incubations without primary antibody or with antibodies against GFP were used as negative controls to avoid misinterpretation due to the presence of autofluorescent compounds (lipofuscin). To check ETNPPL antibody specificity, the blocking peptide (Novus NBP1-91655PEP) was incubated with the antibody (ratio of 10:1 peptide/antibody) at room temperature for one hour before the staining.
equipment and settings.
Bright field images were taken with a Nikon Eclipse microscope and a NIH-elements software using standard settings. Fluorescent images were taken with a Zeiss apotome Axio Imager 2 equipped with a Zeiss ZEN software. Main settings were: binning 2 × 2, apoptome mode: 5. Quantifications were obtained by two investigators (N.L., M.A.) on image captures and with ImageJ software manual cell count-ing tool. For western blots, proteins were detected uscount-ing an Odyssey CLx Li-Cor apparatus and accompanycount-ing software. Exposure times were 7 minutes.RNA profiling.
Tumours with foci of at least four millimeters in diameter, assessed by hematoxylin & eosinstainings and with at least 80% of IDH1 R132H positive cells were selected. Four drills (two in foci and two in the other part of the tumour – Fig. S2B) were performed in the FFPE tumour blocks using a two millimetres punch from a Tissue Micro Array apparatus (Master 3DHistech LTD, Hungary) in RNAse-free conditions. After the punches, the adequate selection of tumour areas was checked by hematoxylin & eosin stainings of sections (Fig. S2B). Total RNA was extracted using the Qiagen RNeasy FFPE kit, quantified with Nanodrop 1000 (Thermo Fisher) and the RNA integrity number (RIN) was determined using a Bioanalyzer 2100 (Agilent Technologies). The RIN was on average 2.5 thus indicating degraded RNA. This was expected using FFPE samples but the RNA were still suitable for labelling and hybridization on DNA chips according to the Affymetrix technical depart-ment. After amplification and labelling with an Affymetrix WT Pico Kit, cDNA were hybridized on Human Gene 2.1 ST chips. Arrays CEL files were processed with Affymetrix Expression Console software (GC-RMA (Robust Multiarray Average) algorithm) and Affymetrix Transcriptome Analysis Console (TAC 3.1.0.5) softwares. Array CEL files were also analyzed in parallel using R software 3.6. In that case, files were preprocessed by RMA algo-rithm from the Oligo R Package version 1.48.0. Then Limma package version 3.40.6 was used to identify genes differentially expressed. Genes identified both by Transcriptome Analysis Console 3.1.0.5 and Limma algorithms and with a p-value ≤ 0.05 (unpaired tests) and a fold change ≥1.3 (DLGG/foci) were considered as differentially expressed (Table 1). The raw data that support the findings of our study are openly available at the functional genomics data Gene Expression Omnibus (GEO: GSE130149).
RT-qPCR.
cDNA synthesis was performed using 1–5 μg of total RNA with random hexamers and reversetran-scriptase (Promega, GoScript). Quantitative RT-qPCR was performed in triplicate for each tumour sample using the KAPA SYBR PCR kit (Sigma Aldrich KK4600) with a LightCycler 480 apparatus (Roche). 1 μL of cDNA was used for each reaction. Primers are listed in Table S2. Expression values were calculated using the 2−ΔΔCT method and normalized using the housekeeping gene RPLP0.
comparative genomic hybridization array (cGHa).
The LGG85 cell line was established from a malepatient diagnosed with a grade-IV IDH1-mutated glioma with culture conditions used for Gli4 and Gli7
glio-blastoma cell lines11. Array CGH profiling for the LGG85 line and from the original tumour were performed
with the Human Agilent Sureprint G3 8 60 K Microarray Kit (Agilent Technologies, USA). LGG85 DNA was labelled with cyanin 5 (Cy5) while reference DNA from a male subject was labelled with cyanin 3 (Cy3). Sample and reference DNAs were pooled and hybridized for 24 hours at 67 °C on the arrays. The fluorescence was read by the Agilent SureScan Microarray scanner and the Cy5 /Cy3 ratios were converted into log2 transformed val-ues with the Agilent Cytogenomics software. DLRS (Derivative Log Ratio Spread), gRepro, rSignalIntensity and LogRatioImbalance were 0.2, 0.009, 450.68 and −0.1 respectively. A single copy loss was associated with a value of the log2 below −0,8 (log2 (1/2) = −1) since a single copy gain was associated with a value of the log2 above 0,5 (log2 3/2) = 0,58).
Lentiviral vectors and glioma cell culture.
To study the effect of ETNPPL overexpression, we designedtwo lentiviral vectors combining an EGFP-T2A-Puromycine resistance gene and the coding sequence for Human ETNPPL or Luciferase, controlled by a doxycycline-regulated Tre3G promoter (Vectorbuilder). A third lentivirus was built to express a blasticidin resistance gene and the doxycycline-regulated Tet-on activator. Mycoplasma-free
Gli4, Gli7 and LGG85 cells were cultured as described12 on poly-HEMA coated vessels and in defined media
(DMEM/F12 1:1 (Invitrogen) supplemented with N2 (Invitrogen), 2 mM glutamine (Invitrogen), 2 μg/mL heparin (Sigma), 10 ng/mL EGF (Peprotech) and 10 ng/mL FGF2 (Peprotech)). 100,000 dissociated cells were infected with the Luciferase-EGFP or ETNPPL-EGFP viruses (MOI 7), grew for two weeks and transduced cells were selected by sorting for green fluorescence (GFP) (Aria cytometer BD). Cells were then infected with the Tet3G lentivirus and selected for 2 weeks with blasticidin (0.5 μg/mL). ETNPPL expression was induced by doxycycline 1 μg/mL and checked with ETNPPL antibody by WB and by immunofluorescence on cells seeded on poly-D-lysine/laminin coated coverslips. Effect of ETNPPL on cell growth was measured by seeding 5,000 infected cells per well in 1 mL of media in 24-well plates. After 8 days, the number of cells were determined by dis-sociation with trypsin and automatic counting with Z2 counter (Beckman Coulter). For EdU incorporation, cells were incubated with EdU 10 μM for 4 hours and processed for staining following manufacturer’s recommenda-tion (Baseclick kit). Explant cultures of IDH1-mutated diffuse low-grade gliomas used to explore the expression of ETNPPL are described in12.
Western blots.
Total proteins from tissue samples and cultured cells were obtained and used for WesternBlot as described by12. Proteins were detected using the Odyssey CLx Li-Cor technology. Briefly, primary
anti-bodies were incubated in Li-Cor PBS buffer overnight at 4 °C. After washing, membranes were incubated with secondary fluorescent dye (IRDye 800CW for ETNPPL and IRDye 680LT for β-actin).
Statistical analysis and countings.
All statistical tests used and sample sizes (n) are indicated in the figure legends. Tests were performed using the GraphPad Prism software (v8.2.1). Significances: ****, ***, **, * represent p < 0.0001, p < 0.001, p < 0.01 and p ≤ 0.05 respectively. For cell countings, at least 5 independent fields of 10,000 μm² were counted. The effect of ETNPPL overexpression in Gli4, Gli7 and LGG85 cell was performed in 3 independent experiments.Results
Foci show activated STAT3 pathway and dysregulated gene expression.
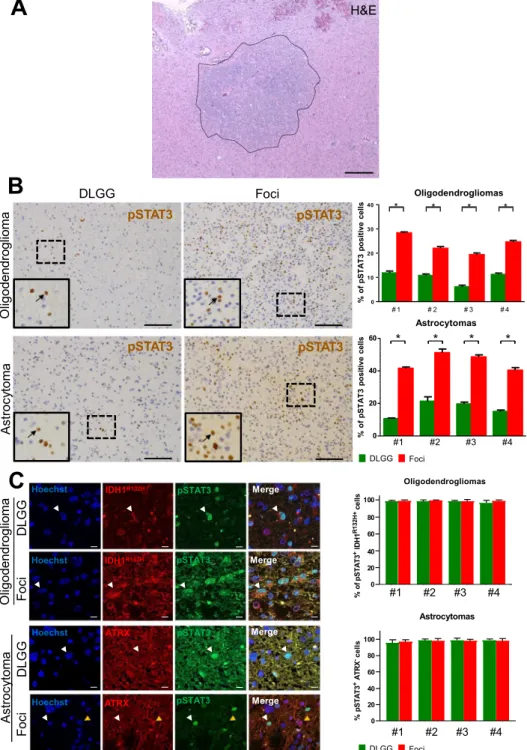
To molecularlychar-acterize foci found in DLGG patients (Fig. 1A), we selected 8 tumours with mutations for IDH1 (IDH1 R132H)
with and without 1p19q co-deletion (4 oligodendrogliomas and 4 astrocytomas respectively) (Table S1). These 8 cases contained foci which were selected on the basis of a local increase in cell density (Figs. 1A, S1). During tumorigenesis, canonical pathways controlling cell proliferation and fate are frequently dysregulated. We explored this possibility by using IHC for Notch, STAT3, BMP, and Ras signalings. We assessed the expression and subcel-lular location of key proteins for these pathways, respectively activated Notch (NICD), pSTAT3 (phosphorylated on tyrosine 705), BMP4 and p-ERK. Only pSTAT3 stainings showed a clear modification in the foci compared to the rest of the tumour (Fig. 1B). The eight studied tumours showed a small number of scattered pSTAT3+ cells, however a sharp and statistically-significant increase of their percentage was observed in foci (Fig. 1B). To ascer-tain that these cells were tumoral and not cells of the tumour environment, we performed double labelling for pSTAT3 and proteins which are frequently altered in DLGG, namely the mutated form of IDH1 (R132H) and loss of ATRX. In the 4 examined oligodendrogliomas (Fig. 1C), we found that >90% of pSTAT3+ cells in the foci or in the rest of the tumour also expressed the mutated form of IDH1 R132H. Expression of IDH1 R132H assessed by IF in the astrocytomas was too weak to perform reliable double pSTAT3/IDH1 R132H stainings so, as an alterna-tive, pSTAT3/ATRX stainings were done. Figure 1C shows that in the 4 astrocytomas, most of pSTAT3+ cells in or outside the foci have lost ATRX expression (>90% of cells). Taken together, these results provide evidence that tumoral cells in foci increase STAT3 signaling.
We then investigated whether we could identify genes whose expression is specifically dysregulated in foci compared to the rest of the tumour. We used FFPE blocks to microdissect a tumoral region within or outside the foci for the 8 tumours (Fig. S2B). RNAs were extracted and profilings were performed. The RNA quality obtained from hospital FFPE blocks precluded the use of a RNA sequencing approach so DNA microarrays were used instead. Clustering analysis performed with the 5,000 top-expressed genes indicates that the tumour and its foci (with the exception of tumour 3) are closely transcriptionally-related and cluster together (Fig. S3).
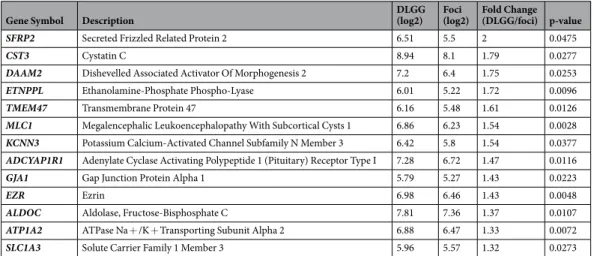
To identify differentially-expressed genes, the statistical analysis was performed using the 8 tumours together to increase statistical power. A fold change value of 1.3 was selected as a more selective threshold retrieved very few genes. Table 1 shows a list of the 13 identified genes. All were downregulated in foci. Literature analysis shows that these genes are implicated in various pathways and cellular processes such as Wnt signaling (DAAM2,
SFRP2), glutamate transport (SLC1A3), metabolism (ALDOC, ETNPPL), cytoskeleton (EZR), cell-cell adhesion
(GJA1) and cyclic AMP pathway (ADCYAP1R1).
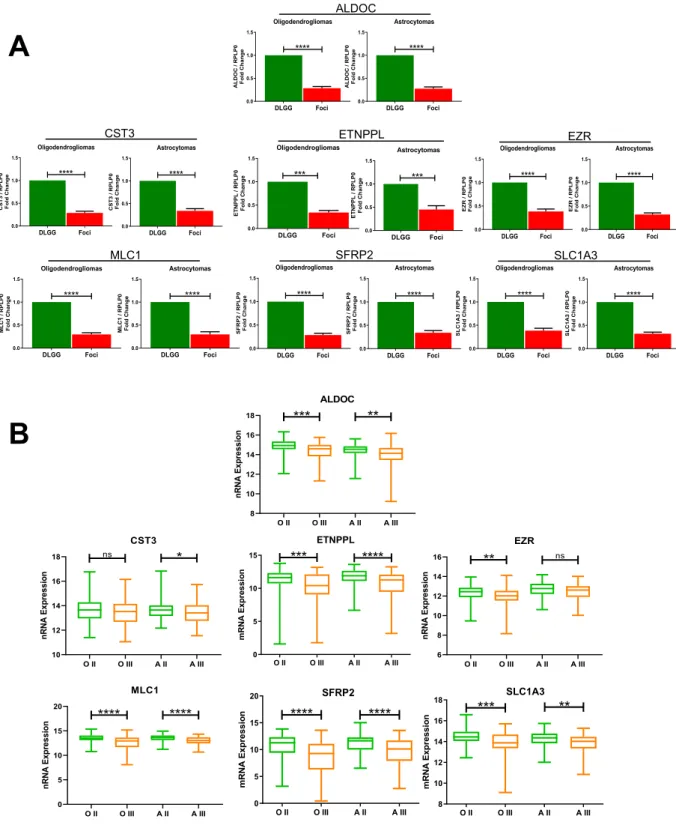
In order to validate these results with an independent approach, we performed RT-qPCR on 10 tumours (those used for RNA profiling + 2 additional tumours). We selected 7 genes which are involved in EGFR sig-nalling (MLC1), metabolism (ALDOC, ETNPPL), Wnt signaling (SFRP2), protease inhibition (CST3), skeleton
function (EZR) and glutamate transport (SLC1A3). Figure 2A shows a significant downregulation of these 7
genes in the foci of the 10 analysed tumours. These results corroborate those obtained with the DNA microarray technology.
There was a possibility that the genes identified as differentially-expressed were in fact the consequence of a different number of non tumoral cells (for instance immune or stromal cells) in foci areas versus the rest of the tumour. We explored this hypothesis using two approaches. First we measured the percentage of tumoral cells in
Gene Symbol Description DLGG (log2) Foci (log2) Fold Change (DLGG/foci) p-value
SFRP2 Secreted Frizzled Related Protein 2 6.51 5.5 2 0.0475
CST3 Cystatin C 8.94 8.1 1.79 0.0277
DAAM2 Dishevelled Associated Activator Of Morphogenesis 2 7.2 6.4 1.75 0.0253
ETNPPL Ethanolamine-Phosphate Phospho-Lyase 6.01 5.22 1.72 0.0096
TMEM47 Transmembrane Protein 47 6.16 5.48 1.61 0.0126
MLC1 Megalencephalic Leukoencephalopathy With Subcortical Cysts 1 6.86 6.23 1.54 0.0028
KCNN3 Potassium Calcium-Activated Channel Subfamily N Member 3 6.42 5.8 1.54 0.0377
ADCYAP1R1 Adenylate Cyclase Activating Polypeptide 1 (Pituitary) Receptor Type I 7.28 6.72 1.47 0.0116
GJA1 Gap Junction Protein Alpha 1 5.79 5.27 1.43 0.0223
EZR Ezrin 6.98 6.46 1.43 0.0048
ALDOC Aldolase, Fructose-Bisphosphate C 7.81 7.36 1.37 0.0107
ATP1A2 ATPase Na + /K + Transporting Subunit Alpha 2 6.88 6.47 1.33 0.0072
SLC1A3 Solute Carrier Family 1 Member 3 5.96 5.57 1.32 0.0273
Table 1. Identification of dysregulated genes in foci. Fold changes (DLGG/foci) are indicated. p-values
GGciGGciGGciGGciDL FoDL FoDL FoDL Fo 0 20 80 60 40 100 % pS TA T3 +AT RX -ce lls GGciGGciGGciGGciDL FoDL FoDL FoDL Fo 0 20 100 80 60 40 Oligodendrogliomas % of pS TA T3 +IDH1 R132H+ cells DLGG Foci
C
A
H&EB
Astroc yt om a Foci DLGG a moil gor dn ed ogil O pSTAT3 pSTAT3 pSTAT3 pSTAT3 O lig o d e n d ro g lio m a s 0 10 20 30 40 * * * * # 1 # 4 0 20 40 60 * # 2 # 3 Astrocytomas * * * #1 #2 #3 #4 % of pS TA T3 positive cell s % of pS TA T3 positive cell s a mot yc ort s A a moil gor dn ed ogil O Fo ci DL GG Fo ci DL GG Hoechst Hoechst Hoechst Hoechst IDH1R132H IDH1R132H ATRX ATRX pSTAT3 pSTAT3 pSTAT3 pSTAT3 Merge Merge Merge Merge #1 #2 #3 #4 Astrocytomas #1 #2 #3 #4 Oligodendrogliomas DLGG FociFigure 1. pSTAT3 stainings in diffuse low-grade glioma foci. (A) Example of a high cell density foci detected
in a diffuse low-grade glioma. H&E: hematoxylin and eosin stainings. Scale bar 500 μm. (B) Representative stainings for pSTAT3 in diffuse low-grade gliomas. Left and right-hand images are taken outside and inside the foci, respectively. Images taken in an oligodendroglioma (upper images) and an astrocytoma (lower images) are presented. Arrows point to pSTAT3+ cells in each inset. Scale bars 150 μm. Quantification of pSTAT3+ cells detected in 5 fields (10,000 μm²) outside and inside the foci in 4 oligodendrogliomas and 4 astrocytomas are presented on the right-hand side. Test = Mann-Whitney tests n = 5, p value = 0.011 for oligodendrogliomas and astrocytomas. (C) Expression of pSTAT3 by tumoral cells. Representative photographs of double
immunofluorescences for IDH1R132H/pSTAT3 and ATRX/pSTAT3 in one grade II oligodendroglioma and one
grade II astrocytoma, in and outside the foci. White arrows point to IDH1R132H+/pSTAT3+ (oligodendroglioma)
and ATRX negative/pSTAT3+ (astrocytoma) cells. The yellow arrow on astrocytoma photograph indicates
one example of an ATRX+ cell to show the quality of the immunofluorescence. Right-hand histograms show
the percentage of tumoral pSTAT3+ cells (e.g. pSTAT3+ cells which are positive for IDH1 R132H or negative
for ATRX) outside and inside the foci assessed by IDH1R132H/pSTAT3 and ATRX/pSTAT3 co-stainings in
4 oligodendrogliomas and 4 astrocytomas (5 fields (10,000 μm²) outside and inside the foci quantified per patient). Only cells with obvious nuclear pSTAT3 staining were counted.
or outside the foci with IHC against IDH1 R132H (Fig. S2A). We found that both areas were mainly composed of tumoral cells (>80%) and no statistically-significant difference can be detected (Fig. S2C). Second, we used a bioinformatics approach using gene expression signatures to infer the fraction of stromal and immune cells in
A
B
Oligodendrogliomas DLGG Foci 0.0 0.5 1.0 1.5 **** SL C1 A 3 /R PL P 0 Fol dC hang e Astrocytomas DLGG Foci 0.0 0.5 1.0 1.5 **** SL C1 A3 /R PLP0 Fo ld C ha nge SLC1A3 Oligodendrogliomas DLGG Foci 0.0 0.5 1.0 1.5 **** SF RP 2/ RPLP 0 Fold Ch an g e Astrocytomas DLGG Foci 0.0 0.5 1.0 1.5 **** SF R P2 /R PLP0 Fo ldC ha ng e SFRP2 Oligodendrogliomas DLGG Foci 0.0 0.5 1.0 1.5 *** ET NPPL /R PL P0 Fold Ch ange Astrocytomas DLGG Foci 0.0 0.5 1.0 1.5 *** ETN PP L/ RP LP0 Fol dC han ge ETNPPL ETNPPL O II O III A II A III 0 5 10 15 *** **** m RN AE xpre ssi on O II O III A II A III 0 5 10 15 20****
****
SFRP2 m R NA Expressio n O II O III A II A III 8 10 12 14 16 18***
SLC1A3**
mR NA Expressio n Astrocytomas DLGG Foci 0.0 0.5 1.0 1.5 **** ALDO C/ R PLP0 Fo ld C han ge Oligodendrogliomas DLGG Foci 0.0 0.5 1.0 1.5 **** ALDO C/ RPLP 0 Fo ldC hang e ALDOC Astrocytomas DLGG Foci 0.0 0.5 1.0 1.5 **** ML C 1 /R P LP0 Fo ld C ha ng e Oligodendrogliomas DLGG Foci 0.0 0.5 1.0 1.5 **** MLC1 /R PLP0 Fold Ch ange Astrocytomas DLGG Foci 0.0 0.5 1.0 1.5 **** C S T3 /R P LP 0 Fol d Ch an ge Oligodendrogliomas DLGG Foci 0.0 0.5 1.0 1.5 **** CS T3/ RP LP 0 Fold C ha ng e CST3 MLC1 Oligodendrogliomas DLGG Foci 0.0 0.5 1.0 1.5 **** EZ R/ R PLP0 Fo ld Ch ange Astrocytomas DLGG Foci 0.0 0.5 1.0 1.5 **** E ZR /R PL P0 Fold C h an ge EZR O II O III A II A III 10 12 14 16 18 CST3 nRN AE xp ressi on ns * O II O III A II A III 8 10 12 14 16 18 ALDOC nRN AE xp ressi on *** ** O II O III A II A III 6 8 10 12 14 16 EZR nRN A Ex pr es sio n ** ns O II O III A II A III 0 5 10 15 20 MLC1 nR NA Ex pr essi on **** ****Figure 2. qPCR validation of differentially-expressed genes and expression in grade II and III gliomas.
(A) qPCR quantification of indicated RNAs in foci and in the other part of the tumour (DLGG) in
oligodendrogliomas and astrocytomas. Values represent fold change (foci area/non foci area) of indicated RNA expression normalized by RPLP0 quantification. n = 10 tumours. Test = Wilcoxon matched-pairs test. (B) Expression of indicated genes in grade II and grade III gliomas retrieved from the TCGA database. A similar analysis done for all identified genes is presented in Table S3. OII (Oligodendroglioma grade II, 108 patients). OIII (Oligodendroglioma grade III, 76 patients). AII (Astrocytoma grade II, 87 patients). AIII (Astrocytoma grade III, 98 patients). Tests = Kruskal-Wallis with a Dunn post-hoc test.
tumour samples as described in13. This method called ESTIMATE (Estimation of STromal and Immune cells in
MAlignant Tumours using Expression data) calculates scores (between 0 and 1) predictive of tumour infiltration by stromal and immune cells and consequently, of tumour purity. All samples (8 tumours + 8 foci) were analyzed by ESTIMATE and results presented in Fig. S2D show that tumour and foci purity were very high (>0.8). No statistical differences in purity could be detected between the tumour and the foci areas (Fig. S2D). These analy-ses indicate that the genes identified as differentially-expressed genes are very likely expressed by tumoral cells.
We then explored whether the genes dysregulated in foci were also differentially-expressed with tumoral pro-gression. To this aim, we retrieved the expression value for the 13 identified genes from the cancer genome atlas
(TCGA)14 in grade II and grade III gliomas. Statistical analyses performed in IDH1-mutated tumours show that
these genes were differentially-expressed between both type of grade II and III gliomas (Table S3). Examples of TCGA gene expression for the 7 quantitative PCR-validated genes (Fig. 2A) are presented on Fig. 2B.
These results suggest that the observed dysregulation of genes in foci account for a malignant progression taking place in this part of the tumour.
Glioma cells express the etnppL lipid metabolism enzyme.
Lipid metabolism is altered in cancercells15. The expression of a lipid metabolic enzyme called Ethanolamine-Phosphate Phospho-Lyase (ETNPPL,
also known as AGXT2L1) was found reduced in foci (Table 1). ETNPPL is involved in the catabolism of
phos-phoethanolamine (Fig. S4A), a key compound for the synthesis of phosphatidylethanolamine which is a major
phospholipid of the cellular membrane16. ETNPPL is mainly expressed in brain and in liver according to
NCBI gene database (Fig. S4B)17. In human brain, its expression appears to be restricted to mature astrocytes
(Fig. S4C)18. Little is known about ETNPPL (13 publications) and a potential link with brain tumours has not
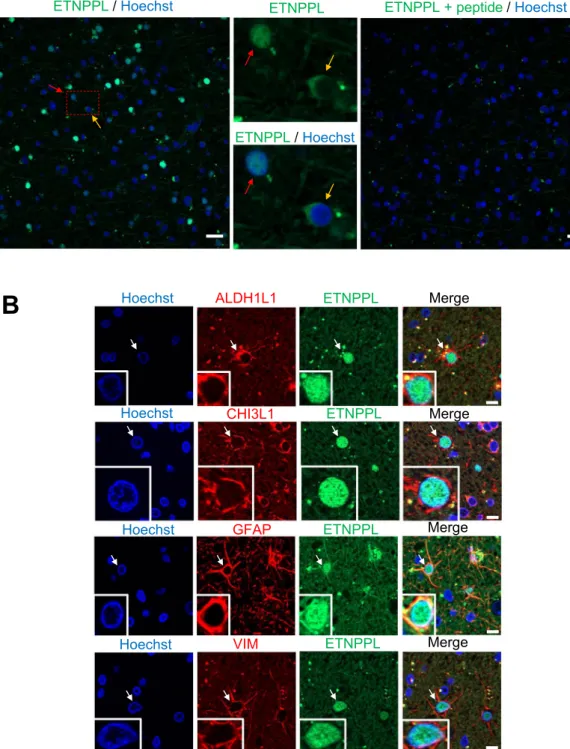
been established. This prompted us to explore the expression and role of ETNPPL in the human brain and glio-mas. We started by performing IF for ETNPPL using one human cortical sample removed during neurosurgical approach for meningioma resection. The ETNPPL protein was detected by a fraction of cells either in the nuclei or in the cytoplasm (Fig. 3A, left-hand and central images). Immunofluorescence specificity was assessed by loss of signal if the antibody is pre-incubated with an ETNPPL peptide (Fig. 3A, right-hand image). To confirm the preferential expression of ETNPPL in astrocytes, double immunofluorescences were performed for four
astro-cytic markers (ALDH1L1, CHI3L1, GFAP, VIM). A very large fraction of ETNPPL+ cells (>95%, >450 cells
counted for each markers) were positive for these four markers (Fig. 3B). Surprisingly for a metabolic enzyme, ETNPPL staining was located in the cell nuclei. ETNPPL antibody quality was indicated by the presence of a band
at the expected size (55 kDa) on a western blot (WB) performed with DLGG extracts (Fig. 4A). These results
confirmed the astrocytic expression of ETNPPL as suggested by RNA expression databases. We then analyzed ETNPPL expression in diffuse low-grade gliomas samples. By WB, ETNPPL was detected as a single band in
5 of the 6 analyzed grade II tumours (Figs. 4A and S8A). By IHC and reminiscent of what was observed in the
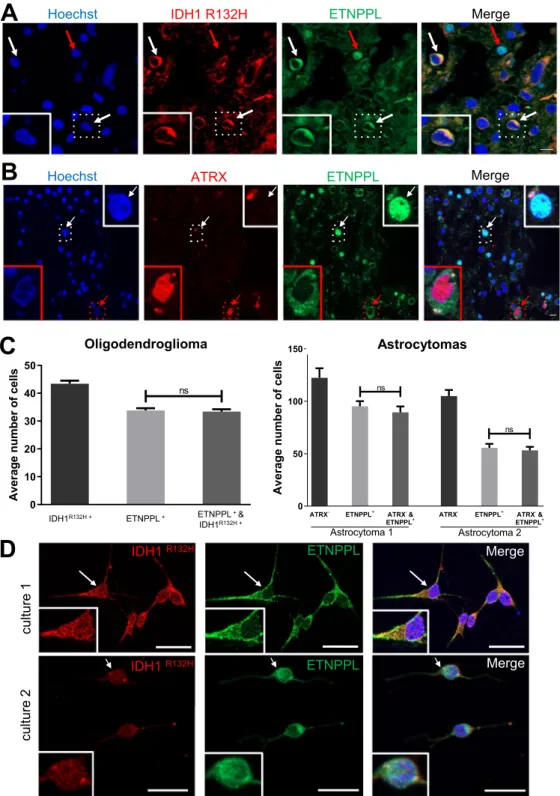
normal brain, ETNPPL was detected either in the cytoplasm or the nuclei of the cells in one grade II astrocytoma (Fig. 4B). DLGG can contain normal and mutated cells so it was important to establish that ETNPPL+ cells were tumoral. This was addressed by performing double IF for ETNPPL and IDH1 R132H (1 oligodendroglioma) and ATRX (2 astrocytomas). As mentioned previously, expression of IDH1 R132H assessed by IF in the astrocytomas was too weak to be quantified accurately. In the oligodendroglioma (Figs. 5A,C, S6A,B), we found that >95% of
ETNPPL+ cells also expressed the mutated form of IDH1 R132H. Figure 5B-C shows that in the 2 astrocytomas,
most of ETNPPL+ cells have lost ATRX expression (>95% of cells). We also examined the ETNPPL expression in gliomas cells using DLGG primary cultures (Fig. 5D). In the two explored cultures, most of IDH1 R132H+ cells (>90%, 150 cells counted) co-expressed ETNPPL. In these 2 patients, the protein was mainly in the cytoplasm.
The ETNPPL expression in diffuse low-grade glioma cells was also validated using a second antibody (HPA072938) directed against another part of the protein (Table S2). The quality of this antibody was checked by WB and immunofluorescence with ETNPPL-overexpressing cells (see below) (Fig. S7A,B). Either cytoplasmic or nuclear expression of ETNPPL was detected in tumoral cells identified by the expression of IDH1R132H in one oligodendroglioma (Fig. S7C). ETNPPL was also detected with this antibody in the cytoplasm or the nucleus of diffuse low-grade gliomas cells in culture (Fig. S7D).
All together, these results demonstrate that ETNPPL is expressed by tumoral cells in DLGG.
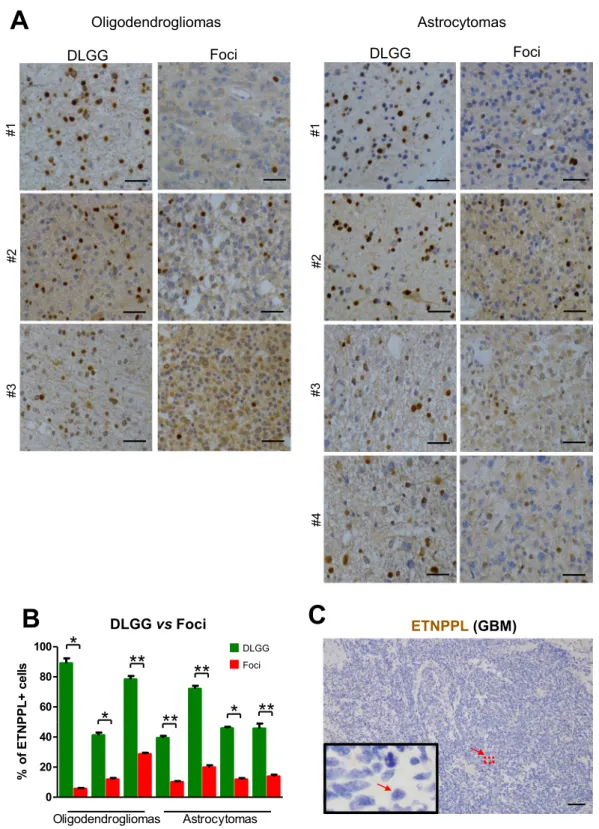
Foci and high-grade gliomas have a reduced expression of ETNPPL.
Microarray and qPCRanal-yses indicate that ETNPPL RNA is reduced in the foci (Table 1, Fig. 2A). First, we validated this at the protein level using IHC in seven DLGG containing foci. Figure 6A,B shows a significant reduction of the percentage of ETNPPL+ cells in the foci even if its expression is highly variable between tumours. Second, we also explored gli-oma databases for the expression of ETNPPL in different tumour grades. All three databases (TCGA, Rembrandt and NCBI dataset GDS1962) showed a sharp reduction of ETNPPL RNA in high-grade tumours compared to low-grade tumours (Fig. S4D)14,19,20. We confirmed this decrease by using IHC in a glioblastoma tumour.
Result presented on Fig. 6C shows the absence of ETNPPL in this tumour. To validate this further, we used pro-teins extracted from one grade III astrocytoma and six GBM and compared with grade II tumours using WB.
Figure 4A and Fig. S8A indicate that ETNPPL was absent or low in the 6 GBM samples whereas the protein was
readily detected in 5 of the 7 non-GBM tumours.
Collectively, these data show that ETNPPL is expressed in diffuse low-grade tumours and is reduced with malignant progression.
etnppL reduces glioma cell growth.
The reduction of ETNPPL in high-grade gliomas suggested thatthis enzyme might oppose proliferation which is enhanced in these tumours. We addressed this issue by per-forming gain of function experiments in three glioma cell cultures. We used two previously characterized glioma
stem cell cultures (Gli4 and Gli7) which we derived from GBM-affected patients11. In order to use cells bearing
mutations typically found in DLGG, we derived a third culture named LGG85 from a patient affected by a sec-ondary GBM and containing a mutated IDH1 gene. LGG85 cells grow as neurospheres, express nestin (NES), an intermediate filament specific for neural immature cells, as well as two transcription factors highly expressed
Hoechst VIM
Hoechst GFAP ETNPPL
ALDH1L1
Hoechst ETNPPL
CHI3L1 Hoechst
A
ETNPPL/ Hoechst ETNPPLETNPPL/ Hoechst
ETNPPL + peptide/ Hoechst
B
Merge Merge ETNPPL ETNPPL Merge MergeFigure 3. Detection of ETNPPL protein in human cortex. (A) Immunofluorescence for ETNPPL (green) in
human cortex sections. The two middle photographs are high magnification of red dotted-line square on the left-hand image. ETNPPL is detected in the cytoplasm (yellow arrow) or the nucleus (red arrow). The right-hand image shows the absence of detection of ETNPPL when the antibody was pre-incubated with the ETNPPL peptide used to generate the antibody. Remaining green dots are likely to be autofluorescent lipofuscin which is often present in human brain samples. Scale bars = 20 μm. (B) Immunofluorescences for ETNPPL (green) and indicated proteins (red) in human cortex. ETNPPL is detected in the nucleus of cells expressing ALDH1L1, CHI3L1, GFAP and VIM (vimentin), identifying these cells as astrocytes. Arrows point to double positive cells. Scale bars = 10 μm.
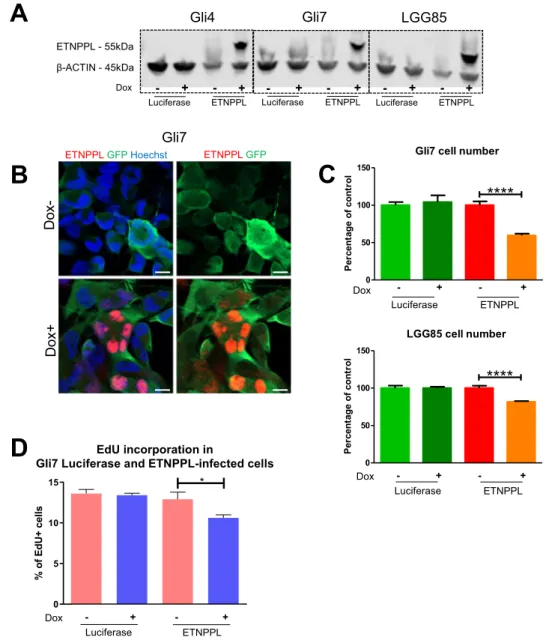
in gliomas (OLIG2, SOX2) (Fig. S5A,B). WB analysis and DNA sequencing show the expression of the IDH1 R132H protein in the cells and the IDH1 395 G > A mutation (Fig. S5C,D respectively). In addition, CGH array performed with the initial resection and with the LGG85 cells show a very good coincidence of DNA alterations between the tumour and the culture (Fig. S5E). ETNPPL was overexpressed in Gli4, Gli7, LGG85 cultures using a doxycycline-controlled lentivirus. Western blot analysis indicates that while endogenous ETNPPL in these 3
cultures was not detected (Fig. 7A), addition of doxycycline induced a strong ETNPPL expression compared to
control luciferase-expressing cells. Immunofluorescence confirmed the induction of ETNPPL by doxycycline and the protein was localized in cell nuclei (Figs. 7B, S7B). Using these constructs in a growth assay, we found that ETNPPL overexpression reduced the cell number obtained after 8 days of culture in Gli7 and LGG85 cells (3 independent experiments, Fig. 7C), but not in Gli4 cells (not shown). EdU incorporation performed in Gli7 cells for 4 hours show a reduction in the proliferation rate (Fig. 7D) while the number of apoptotic cells detected by cleaved-caspase 3 was unchanged (not shown).
These results show an inhibitory role for ETNPPL in the growth of 2 out of 3 GBM cell lines.
Discussion
In this article we characterized further the high-density foci observed in 20% of DLGG-affected patients by using IHC and RNA profiling. We provide evidence for dysregulation of specific pathways and gene expression in these tumour areas. In addition, this led us to identify expression of ETNPPL in gliomas, a barely-studied metabolic enzyme, which was further studied in vitro.
Three main conclusions can be drawn from this study.
High activation of STAT3 pathway in foci.
We first showed that foci have a higher percentage ofpSTAT3+ cells which indicates STAT3 pathway activation in these cells. Phosphorylated STAT3 translocates to
the cell nucleus to regulate many genes involved in proliferation, apoptosis and angiogenesis21. As such,
phos-phorylation of STAT proteins, notably STAT3, is involved in the pathogenesis of many cancers, including GBM, by promoting cell cycle progression, stimulating angiogenesis, and impairing tumour immune surveillance21.
What could activate the STAT3 pathway in foci? STAT3 is phosphorylated through activation of several recep-tors such as IL-6 cytokine receptor, c-met receptor, PDGFR and EGFR receprecep-tors. Indeed, EGFR is frequently
co-expressed with phosphorylated STAT3 in high-grade gliomas22. We previously reported that EGFR staining
A
Astro.II Oligo.II Astro.III GBM ETNPPL 55kDa β-ACTIN 45kDa Oligodendrog. Astrocytoma GBM 0.00 0.01 0.02 0.03 0.04 0.05 ** Quantification of ETNPPL oit a R NI T CA-ß/ LP P NT E ETNPPL(Astrocytoma)B
Figure 4. Detection of ETNPPL in gliomas. (A) WB detection of ETNPPL in proteins extracted from indicated
gliomas. ETNPPL is detected as a single band with the predicted size (55 kDa). The uncropped image of the WB is presented on Supplemental Fig. 8A. Oligo II: grade II oligodendrogliomas, Astro II and III: grade II and III astrocytomas. GBM: IDH1 non-mutated glioblastomas. β-actin detection was used for normalization. Quantification for ETNPPL is presented on the right-hand side panel (4 astrocytomas IDH1 R132H-mutated and 6 glioblastomas). Test = Mann-Whitney test (**p = 0.01). (B) Immunohistochemistry for ETNPPL (brown) in one IDH1-mutated diffuse grade II astrocytoma. The protein is present either in the nucleus (red arrow) or in the cytoplasm (black arrow) of cells. Scale bars = 150 μm. Nuclei are stained with hematoxylin.
Astrocytomas
ATRX- ETNPPL+ ATRX-& ETNPPL+ ATRX
- ETNPPL+ ATRX-& ETNPPL+ 0 50 100 150 ns Astrocytoma 1 Astrocytoma 2 ns Average num be ro fcel ls
C
B
Hoechst ATRX ETNPPLA
Hoechst IDH1 R132H ETNPPLOligodendroglioma
IDH1R132H+ ETNPPL+ ETNPPL+& IDH1R132H+ 0 10 20 30 40 50 ns Av er ag e numbe ro fc ells
IDH1R132H + ETNPPL+ ETNPPL+ &
IDH1R132H +
D
ETNPPL IDH1 R132H Merge 1 er utl uc 2 er utl uc Merge MergeIDH1 R132H ETNPPL Merge
Astrocytomas
Figure 5. Expression of ETNPPL by tumoral cells. (A) Representative photograph of double immunofluorescence
for IDH1R132H/ETNPPL in one grade II oligodendroglioma. White arrows point to IDH1R132H positive tumour cells co-expressing ETNPPL in the cytoplasm (green). Red arrow points a nuclear ETNPPL expression in a non tumoral cell (IDH1R132H negative) indicative of staining specificity. Scale bars 10 μm. (B) Representative
photograph of double immunofluorescence for ATRX/ETNPPL in one grade II astrocytoma. Most of ETNPPL+
cells do not express ATRX and are thus tumoral. The red arrow points to an ETNPPL+ ATRX+ cell which is unlikely to be tumoral whereas the white arrow shows an ETNPPL+ ATRX- tumoral cell. Insets are high magnification of pointed cells. Scale bars 10 μm. (C) Quantification of tumoral ETNPPL+ cells. Histograms show the average number of indicated cells by counted field (x40) in one grade II oligodendrogliomas and two grade II astrocytomas. In oligodendroglioma, ETNPPL+ cells are also IDH1 R132H+ whereas in the two astrocytomas they are ATRX-. Tests = Mann-Whitney tests are non-significant (n.s.) p = 0.74; 0.55; 0.53 for the 3 tumours. (D) Detection of ETNPPL (green) in 2 diffuse low-grade gliomas cultures. The presence of tumoral cells is indicated by staining for the mutated IDH1 R132H protein (red). Insets are high magnification of cells pointed with arrows. Note that in those two patients, the ETNPPL protein was mainly detected in the cytoplasm. Scale bars = 20 μm.
A
B
Oligodendrogliomas Astrocytomas DLGG Foci DLGG Foci DLGG vs Foci 0 20 40 60 80 100 Oligodendrogliomas Astrocytomas*
*
**
**
**
**
*
sll ec +L PP NT Ef o % DLGG Foci #3 #3 #1 #1 #2 #2 #4 ETNPPL(GBM)C
Figure 6. ETNPPL protein reduction in foci. (A) Representative photographs of ETNPPL
immunohistochemistry (brown stainings with DAB) in 3 grade II oligodendrogliomas and 4 grade II astrocytomas. Photographs were taken in the foci and the rest of the tumour (DLGG). Nuclei are stained with
hematoxylin. Scale bars = 50 μm. (B) Quantification of ETNPPL+ cells in the 3 oligodendrogliomas and 4
astrocytomas. The histograms represent the % of ETNPPL+ cells detected among all cells present per 10,000 μm² for each tumour (n = 5 fields). Tests = Mann-Whitney tests. (C) Immunohistochemistry for ETNPPL (brown) in one glioblastoma. The protein is not detected. Scale bars = 150 μm. Nuclei are stained with hematoxylin.
was higher (Hirsch score) in foci than the rest of the tumour which may be linked to the STAT3 activation we observed in these tumour areas9. In vitro STAT3 can also be activated by cell confluence23 which may be
some-what related to its activation in foci where cell density is increased (Figs. 1A, S1).
What could be the significance of STAT3 activation in glioma foci? STAT3 expression promotes tumour
inci-dence in combination with PDGF in a glioma mouse model24. Activated STAT3 also correlates positively with
glioma grade22,25. STAT3 is essential for maintenance and proliferation of aggressive glioblastoma stem cells26,27
and is involved in the transition of glioblastomas toward the even more aggressive mesenchymal glioblastoma subtype28.
All together, these data support the notion that STAT3 activation in foci may be linked to malignant progres-sion which warrants further investigations.
A
C
B
Gli7 cell numberLucif Dox- Lucif Dox+ ETNPPL Dox- ETNPPL Dox+
0 50 100 150
****
lo rt no cf o eg at ne cr eP Dox - + - + Luciferase ETNPPL LGG85 cell numberLucif Dox- Lucif Dox+ ETNPPL Dox- ETNPPL Dox+
0 50 100 150
****
lo rt no cf o eg at ne cr eP - + - + Dox Luciferase ETNPPLD
ETNPPL GFP Hoechst ETNPPL GFP
Gli7 Dox-Dox+ Dox ETNPPL - 55kDa β-ACTIN - 45kDa
Luciferase- + ETNPPL- + Luciferase- + ETNPPL- + Luciferase- + ETNPPL- +
Gli7 LGG85
Gli4
EdU incorporation in
Gli7 Luciferase and ETNPPL-infected cells
Lucif
Dox- Dox+Lucif ETNPPLDox- ETNPPLDox+
0 5 10 15 * %o fE dU + cells - + - + Dox Luciferase ETNPPL
Figure 7. Functional assessment of ETNPPL expression in glioblastoma cell lines. (A) WB for ETNPPL in
proteins extracted from Gli4, Gli7 and LGG85 cells infected with control (luciferase) or ETNPPL inducible-lentiviruses and cultured with and without doxycycline. The ETNPPL protein is only detected in ETNPPL-infected cells in the presence of doxycycline. β-actin detection is used as loading control. The uncropped image of the WB is presented on Supplemental Fig. 8B. (B) Immunofluorescence for ETNPPL in Gli7 cells infected with an ETNPPL lentivirus and cultured with and without doxycycline. ETNPPL (red) is strongly detected in the cell nuclei. Infected cells are detected by expression of the GFP (green) gene included in the lentiviral construct. (C) Representative experiment of the effect of ETNPPL overexpression on glioblastoma cell growth. Histograms show the relative number of Gli7 and LGG85 cells cultured for 8 days with and without doxycycline. Test = One-way ANOVA tests. n = 3 independent experiments. (D) Representative experiment of EdU incorporation in Gli7 cells. Histograms represent the % of EdU+ cells obtained after 4 hours of incorporation in the presence or absence of doxycycline. test = Mann-Whitney test (*p = 0.024), n = 3 independent experiments.
foci show dysregulated gene expression.
A second outcome of this study is the identification of a modified expression of 13 genes which were downregulated in foci. Individual analysis of the literature for these genes reveals interesting features. ADCYAP1R1 (a receptor for PACAP) is a protein involved in cAMPproduc-tion. High cAMP can oppose gliomagenesis29 so the observed decrease of ADCYAP1R1 might promotes foci cell
proliferation. Expression of 2 genes coding for metabolic enzymes (ALDOC, ETNPPL) was modified suggesting that foci might have an altered metabolism as often observed during cancer progression.
Gene analysis also suggests that foci cells are likely to have modifications in 2 pathways, namely Wnt and EGFR pathways. The Wnt signalling which is central in gliomagenesis30, may be affected in foci cells as we observed
downregulation of 2 genes participating in the regulation of this pathway, namely DAAM231 and SFRP232. The
reduction of SFRP2 gene expression is particularly significant as this Wnt pathway inhibitor is often reduced by
DNA hypermethylation in the progression of various cancers33. Regarding EGFR signaling, reduction of MLC1, a
gene which favors EGFR degradation34, may leads to the higher EGFR expression we previously observed by IHC
in foci9. The cytoskeleton might also be affected in foci as gene coding for ezrin (EZR) a linker protein between
plasma membrane and actin cytoskeleton, is reduced. Finally, cell-cell communication is likely to be altered. This is illustrated by the decrease of GJA1, the gene coding for connexin 43, a major connexin protein of glial cells35.
The fact that the downregulated genes in foci are also decreased in high-grade tumours (Table S3) suggests that foci are cells undergoing transformation. In addition, for 3 of these genes, namely MLC1, CST3 and GJA1, it has been demonstrated that they oppose tumorigenesis when overexpressed in glioma lines34,36,37 and thus they
present tumour suppressor activity. Similarly, the reduction of expression of these 3 genes might promote foci expansion and transformation.
Further investigations are needed to evaluate whether other genes identified in this study behave in a similar way.
etnppL negatively regulates glioma cell growth.
The third series of data we report here concernsETNPPL, a metabolic enzyme barely studied so far. We demonstrated that the ETNPPL protein is present in normal astrocytes as well as in diffuse low-grade glioma cells but is downregulated with malignant progres-sion. The situation may be reminiscent of the liver context, where ETNPPL is expressed in normal tissue but is
downregulated in hepatocarcinoma38. One unexpected finding was our observation of a nuclear localization for
ETNPPL. This was observed in normal astrocytes, in glioma cells but also in vitro when the protein was overex-pressed in glioblastoma stem cell cultures. In some glioma tumours, we also observed subpopulations of cells with ETNPPL in the cytoplasm. The nuclear or cytoplasmic expression of ETNPPL in gliomas can also be observed in the human protein atlas39 which validates our observation further (Fig. S4E). It is now established that
meta-bolic enzymes can have non-metameta-bolic roles and can act in the nuclei as transcriptional regulators (the so-called
moonlighting phenomenon40). A similar situation may apply to ETNPPL which warrants further investigations.
We found that ETNPPL RNA and protein are reduced in foci cells and absent in glioblastomas. This is consist-ent with glioma database analyses showing that ETNPPL expression is inversely correlated to STAT3 and MKI67 (Fig. S4F) whose expression are higher in foci and glioblastomas. In addition, Kaplan-Meier analysis shows that patients with low expression of ETNPPL have lower overall survival (Fig. S4G). These observations suggested that this enzyme may oppose glioma cells proliferation. We demonstrated this hypothesis by overexpressing ETNPPL in 3 glioblastoma cell cultures (Gli4, Gli7, LGG85). Gli7 and LGG85 cells were sensitive to ETNPPL overexpres-sion which reduced their growth while no effect was detected in Gli4 cells. These glioblastoma-derived cultures have different types of mutations. Notably, Gli4 cells have lost one copy of the NF1 gene (unpublished data) which
characterizes the mesenchymal subtype of glioblastomas41. This most aggressive subtype of glioblastoma may
have a specific metabolism conferring insensitivity to ETNPPL.
How could ETNPPL reduce Gli7 and LGG85 cell growth? This enzyme catalyzes the breakdown of phosphoe-thanolamine, converting it to ammonia, inorganic phosphate and acetaldehyde (Fig. S4A). Phosphoethanolamine is a primary amine which has a critical role in the biosynthesis of membrane phospholipids, notably phosphati-dylethanolamines which are enriched in the nervous tissue. Ethanolamine and its phosphorylated form phos-phoethanolamine have been shown to be potent mitogens for cancer cell lines42,43. We can thus speculate that the
high expression of ETNPPL found in diffuse low-grade gliomas and its overexpression done here in glioblastoma cells may reduce phosphoethanolamine concentration and phosphatidylethanolamine synthesis causing reduc-tion in glioma cell growth. In support of this noreduc-tion, magnetic resonance spectroscopy investigareduc-tion found that
IDH1-mutant tumours are characterized by decreased levels of phosphoethanolamine44.
Our study presents two limitations. First, we found only a limited number of dysregulated genes in foci. The suboptimal quality of RNA extracted from patient FFPE blocks may account for this restricted gene identifica-tion. Second, we cannot formally rule out that few of the genes which were identified are in fact not expressed by tumoral cells but by tumour environment cells such as microglia cells. However, this is unlikely as both quanti-fications of tumoral cells in the DLGG and its foci and bioinformatics analyses performed with the ESTIMATE approach did not reveal a different cellular composition in both compartments. In addition, literature review indicated that most of the genes are expressed by neural cells and, at least for ETNPPL, we have demonstrated that this gene is expressed by tumoral cells.
In conclusion, diffuse low-grade gliomas inexorably progress into high-grade tumours. Patients with foci have a reduced overall survival9 so it is important to characterize these areas with specific molecular tools. We found
that the increase in pSTAT3 and the decrease in ETNPPL stainings characterize these foci which could help to detect cells progressing toward malignancy and thus to stratify patients.
Received: 26 September 2019; Accepted: 27 February 2020; Published: xx xx xxxx
References
1. van den Bent, M. J., Smits, M., Kros, J. M. & Chang, S. M. Diffuse Infiltrating Oligodendroglioma and Astrocytoma. J. Clin. Oncol.
35, 2394–2401 (2017).
2. Wesseling, P. & Capper, D. WHO 2016 Classification of gliomas. Neuropathol. Appl. Neurobiol. 44, 139–150 (2018).
3. Tirosh, I. et al. Single-cell RNA-seq supports a developmental hierarchy in human oligodendroglioma. Nature. 539, 309–313 (2016). 4. Venteicher, A. S. et al Decoupling genetics, lineages, and microenvironment in IDH-mutant gliomas by single-cell RNA-seq. Science.
355 (2017).
5. Waitkus, M. S., Diplas, B. H. & Yan, H. Isocitrate dehydrogenase mutations in gliomas. Neuro-oncology. 18, 16–26 (2016). 6. Duffau, H. Diffuse low-grade glioma, oncological outcome and quality of life: a surgical perspective. Curr. Opin. Oncol. 30, 383–389
(2018).
7. Bao, Z.-S. et al. RNA-seq of 272 gliomas revealed a novel, recurrent PTPRZ1-MET fusion transcript in secondary glioblastomas.
Genome Res. 24, 1765–1773 (2014).
8. Bai, H. et al. Integrated genomic characterization of IDH1-mutant glioma malignant progression. Nat. Genet. 48, 59–66 (2016). 9. Pedeutour-Braccini, Z. et al. Microfoci of malignant progression in diffuse low-grade gliomas: towards the creation of an
intermediate grade in glioma classification? Virchows Arch. 466, 433–444 (2015).
10. Gozé, C. et al. 1P19Q loss but not IDH1 mutations influences WHO grade II gliomas spontaneous growth. J. Neurooncol. 108, 69–75 (2012).
11. Guichet, P.-O. et al. Cell death and neuronal differentiation of glioblastoma stem-like cells induced by neurogenic transcription factors. Glia. 61, 225–239 (2013).
12. Azar, S. et al. Cellular and molecular characterization of IDH1-mutated diffuse low-grade gliomas reveals tumor heterogeneity and absence of EGFR/PDGFRα activation. Glia 66, 239–255 (2018).
13. Yoshihara, K. et al. Inferring tumour purity and stromal and immune cell admixture from expression data. Nat. Commun. 4, 2612 (2013).
14. Deng, M., Brägelmann, J., Schultze, J. L. & Perner, S. Web-TCGA: an online platform for integrated analysis of molecular cancer data sets. BMC Bioinformatics. 17, 72 (2016).
15. Liu, Q., Luo, Q., Halim, A. & Song, G. Targeting lipid metabolism of cancer cells: A promising therapeutic strategy for cancer. Cancer
Lett. 401, 39–45 (2017).
16. Schiroli, D., Cirrincione, S., Donini, S. & Peracchi, A. Strict reaction and substrate specificity of AGXT2L1, the human O-phosphoethanolamine phospho-lyase. IUBMB Life. 65, 645–650 (2013).
17. Brown, G. R. et al. Gene: a gene-centered information resource at NCBI. Nucleic Acids Res. 43, 36–42 (2015).
18. Zhang, Y. et al. Purification and Characterization of Progenitor and Mature Human Astrocytes Reveals Transcriptional and Functional Differences with Mouse. Neuron. 89, 37–53 (2016).
19. Sun, L. et al. Neuronal and glioma-derived stem cell factor induces angiogenesis within the brain. Cancer Cell. 9, 287–300 (2006). 20. Madhavan, S. et al. Rembrandt: helping personalized medicine become a reality through integrative translational research. Mol.
Cancer Res. 7, 157–167 (2009).
21. Yu, H., Lee, H., Herrmann, A., Buettner, R. & Jove, R. Revisiting STAT3 signalling in cancer: new and unexpected biological functions. Nat. Rev. Cancer. 14, 736–746 (2014).
22. Lo, H.-W., Cao, X., Zhu, H. & Ali-Osman, F. Constitutively activated STAT3 frequently coexpresses with epidermal growth factor receptor in high-grade gliomas and targeting STAT3 sensitizes them to Iressa and alkylators. Clin. Cancer Res. 14, 6042–6054 (2008). 23. Su, H.-W. et al. Cell confluence-induced activation of signal transducer and activator of transcription-3 (Stat3) triggers epithelial
dome formation via augmentation of sodium hydrogen exchanger-3 (NHE3) expression. J. Biol. Chem. 282, 9883–9894 (2007). 24. Doucette, T. A. et al. Signal transducer and activator of transcription 3 promotes angiogenesis and drives malignant progression in
glioma. Neuro-oncology. 14, 1136–1145 (2012).
25. Alvarez, J. V. et al. A STAT3 Gene Expression Signature in Gliomas is Associated with a Poor Prognosis. Transl. Oncogenomics. 2, 99–105 (2007).
26. Sherry, M. M., Reeves, A., Wu, J. K. & Cochran, B. H. STAT3 is required for proliferation and maintenance of multipotency in glioblastoma stem cells. Stem Cells. 27, 2383–2392 (2009).
27. Villalva, C. et al. STAT3 is essential for the maintenance of neurosphere-initiating tumor cells in patients with glioblastomas: a potential for targeted therapy? Int. J. Cancer. 128, 826–838 (2011).
28. Carro, M. S. et al. The transcriptional network for mesenchymal transformation of brain tumours. Nature. 463, 318–325 (2010). 29. Warrington, N. M. et al. Cyclic AMP suppression is sufficient to induce gliomagenesis in a mouse model of neurofibromatosis-1.
Cancer Res. 70, 5717–5727 (2010).
30. Lee, Y., Lee, J.-K., Ahn, S. H., Lee, J. & Nam, D.-H. WNT signaling in glioblastoma and therapeutic opportunities. Lab. Invest. 96, 137–150 (2016).
31. Lee, H. K. & Deneen, B. Daam2 is required for dorsal patterning via modulation of canonical Wnt signaling in the developing spinal cord. Dev. Cell. 22, 183–196 (2012).
32. Liu, Y. et al. Secreted frizzled-related protein 2- mediated cancer events: Friend or foe? Pharmacol. Rep. 69, 403–408 (2017). 33. Esteve, P. & Bovolenta, P. The advantages and disadvantages of sfrp1 and sfrp2 expression in pathological events. Tohoku J. Exp. Med.
221, 11–17 (2010).
34. Lanciotti, A. et al. Megalencephalic leukoencephalopathy with subcortical cysts protein-1 regulates epidermal growth factor receptor signaling in astrocytes. Hum. Mol. Genet. 25, 1543–1558 (2016).
35. Giaume, C. & Venance, L. Gap junctions in brain glial cells and development. Perspect. Dev. Neurobiol. 2, 335–345 (1995). 36. Konduri, S. D. et al. Modulation of cystatin C expression impairs the invasive and tumorigenic potential of human glioblastoma
cells. Oncogene. 21, 8705–8712 (2002).
37. Yu, S.-C. et al. Connexin 43 reverses malignant phenotypes of glioma stem cells by modulating E-cadherin. Stem Cells. 30, 108–120 (2012).
38. Ding, Q. et al. AGXT2L1 is down-regulated in heptocellular carcinoma and associated with abnormal lipogenesis. J. Clin. Pathol. 69, 215–220 (2016).
39. Uhlén, M. et al. Tissue-based map of the human proteome. Science. 347 (2015).
40. Boukouris, A. E., Zervopoulos, S. D. & Michelakis, E. D. Metabolic Enzymes Moonlighting in the Nucleus: Metabolic Regulation of Gene Transcription. Trends Biochem. Sci. 41, 712–730 (2016).
41. Verhaak, R. G. W. et al. & Cancer Genome Atlas Research Network. Integrated genomic analysis identifies clinically relevant subtypes of glioblastoma characterized by abnormalities in PDGFRA, IDH1, EGFR, and NF1. Cancer Cell. 17, 98–110 (2010). 42. Kano-Sueoka, T. & Errick, J. E. Effects of phosphoethanolamine and ethanolamine on growth of mammary carcinoma cells in
culture. Exp. Cell Res. 136, 137–145 (1981).
43. Ajioka, I., Akaike, T. & Watanabe, Y. Ethanolamine is a co-mitogenic factor for proliferation of primary hepatocytes. J. Cell Biochem.
84, 249–263 (2002).
44. Esmaeili, M. et al. IDH1 R132H mutation generates a distinct phospholipid metabolite profile in glioma. Cancer Res. 74, 4898–4907 (2014).
Acknowledgements
This work was supported by grants from ARC, INCA‐GSO, ARTC‐SUD. N. Leventoux, was supported by an ARTC‐SUD fellowship. We thank Marie-Pierre Blanchard, Amélie Sarrazin and Christophe Duperray from MRI RIO biocampus facilities for their technical assistance as well as RHEM facility and CHU of Montpellier, Centre de Ressources Biologiques du CHU de Montpellier (CRB), Collection Neurologie, F-34285 Montpellier, France. Affymetrix microarrays were processed in the Microarray Core Facility (V. Pantesco) and the Platform Bioinformatics and Biomarkers (Bio2M) at the Institute of Regenerative Medicine and Biotherapies - Montpellier Hospital. We also want to thank: Professor Steven Sloan who kindly authorized us to use the ETNPPL graph on
supplemental Fig. 4C from18 and Inger Åhlén who authorized us to use the ETNPPL stainings on supplemental
Fig. 4E - Image credit: Human Protein Atlas, www.proteinatlas.org, Image available at the following URL: v18.
proteinatlas.org/humancell from39.
Author contributions
N.L., M.A., J.P.H. and V.R. conceptualized the programme research and designed the methodology; N.L. performed RNA extraction, bioinformatics study, immunohistochemistry, immunofluorescence, countings, RT-qPCR and proliferation assays, M.A. performed countings, cell culture, WB and immunofluorescence, S.A. isolated the LGG85 cell line and performed immunofluorescence on it, S.R. and J.P.V. performed bioinformatics analyses, S.G. performed RT-qPCR and WB, L.F. made statistical analysis, L.B. performed surgery on patients with glioblastoma, C.G. characterized LGG85 by CGH array, W.R. and T.C. performed bioinformatics analyses, H.D. performed surgery on patients with diffuse low-grade glioma, V.R. selected the patients and samples, J.P.H. and N.L. wrote and corrected the manuscript.
competing interests
The authors declare no competing interests.
Additional information
Supplementary information is available for this paper at https://doi.org/10.1038/s41598-020-62145-1.
Correspondence and requests for materials should be addressed to J.P.H. Reprints and permissions information is available at www.nature.com/reprints.
Publisher’s note Springer Nature remains neutral with regard to jurisdictional claims in published maps and
institutional affiliations.
Open Access This article is licensed under a Creative Commons Attribution 4.0 International
License, which permits use, sharing, adaptation, distribution and reproduction in any medium or format, as long as you give appropriate credit to the original author(s) and the source, provide a link to the Cre-ative Commons license, and indicate if changes were made. The images or other third party material in this article are included in the article’s Creative Commons license, unless indicated otherwise in a credit line to the material. If material is not included in the article’s Creative Commons license and your intended use is not per-mitted by statutory regulation or exceeds the perper-mitted use, you will need to obtain permission directly from the copyright holder. To view a copy of this license, visit http://creativecommons.org/licenses/by/4.0/.