Publisher’s version / Version de l'éditeur:
Applied Surface Science, 99, 1, pp. 41-50, 1996
READ THESE TERMS AND CONDITIONS CAREFULLY BEFORE USING THIS WEBSITE. https://nrc-publications.canada.ca/eng/copyright
Vous avez des questions? Nous pouvons vous aider. Pour communiquer directement avec un auteur, consultez la première page de la revue dans laquelle son article a été publié afin de trouver ses coordonnées. Si vous n’arrivez pas à les repérer, communiquez avec nous à PublicationsArchive-ArchivesPublications@nrc-cnrc.gc.ca.
Questions? Contact the NRC Publications Archive team at
PublicationsArchive-ArchivesPublications@nrc-cnrc.gc.ca. If you wish to email the authors directly, please see the first page of the publication for their contact information.
NRC Publications Archive
Archives des publications du CNRC
This publication could be one of several versions: author’s original, accepted manuscript or the publisher’s version. / La version de cette publication peut être l’une des suivantes : la version prépublication de l’auteur, la version acceptée du manuscrit ou la version de l’éditeur.
For the publisher’s version, please access the DOI link below./ Pour consulter la version de l’éditeur, utilisez le lien DOI ci-dessous.
https://doi.org/10.1016/0169-4332(95)00453-X
Access and use of this website and the material on it are subject to the Terms and Conditions set forth at
ToF-SIMS analysis of adsorbate/membrane interactions I. Adsorption of
dehydroabietic acid on poly(vinylidene fluoride)
Spevack, P.; Deslandes, Y.
https://publications-cnrc.canada.ca/fra/droits
L’accès à ce site Web et l’utilisation de son contenu sont assujettis aux conditions présentées dans le site LISEZ CES CONDITIONS ATTENTIVEMENT AVANT D’UTILISER CE SITE WEB.
NRC Publications Record / Notice d'Archives des publications de CNRC:
https://nrc-publications.canada.ca/eng/view/object/?id=559d039b-82ae-44da-b684-95a8a978a34f
https://publications-cnrc.canada.ca/fra/voir/objet/?id=559d039b-82ae-44da-b684-95a8a978a34f
applied
zyxwvutsrqponmlkjihgfedcbaZYXWVUTSRQPONMLKJIHGFEDCBA
surfa c e sc ie nc e
ELSEWIER Applied Surface Science 99 (1996) 4 I-50ToF-SIMS analysis of adsorbate/membrane
interactions
I. Adsorption of dehydroabietic acid on poly(vinylidene fluoride)
P. Spevack * , Y. Deslandes
Surf&es zyxwvutsrqponmlkjihgfedcbaZYXWVUTSRQPONMLKJIHGFEDCBAand Nanopariicles Group. Institute for Chemical Process and Etwironmental Technology. National Research Council Canada, Ottawa. Ont. KIA OR6. Canada
Received 24 August 1995: accepted 30 October 1995
zyxwvutsrqponmlkjihgfedcbaZYXWVUTSRQPONMLKJIHGFEDCBA
Abstract
Time-of-Flight Secondary Ion Mass Spectrometry (ToF-SIMS) was used to investigate the adsorption behaviour of aqueous solutions of dehydroabietic acid (dhAA) in contact with poly(vinylidene fluoride) (PVdF). An identification scheme was developed to qualitatively identify the presence of adsorbed resin acid on the membrane surface at solution concentrations from 10-1000 ppm. ToF-SIMS reveals that dehydroabietic acid adsorbs inhomogeneously on the surface of poly(vinylidene fluoride).
1. Introduction
In recent years, increasingly stringent emission guidelines have prompted the pulp and paper indus- try to examine new available technologies to treat effluent pollution. Specialised polymeric materials, such as ultrafiltration and nanofiltration membranes, have been effectively used to selectively separate undesirable organic pollutants [l-3]. Much of the research work being carried out in this area deals with the macroscopic properties of these materials, such as flux decline [4-61.
Major advances in commercial surface analytical equipment over the last twenty years have prompted many researchers to look beyond the traditional ‘bulk’ methods of evaluating membrane properties, and to reevaluate the role that surface morphology
* Corresponding author. Tel.: + l-(613) 991-6347; fax: + I- (613) 991-2384: e-mail: perry.spevack@nrc.ca.
and surface chemistry play in the fouling behaviour of membranes. Information related to specific so- lute/membrane interactions is essential for maximis- ing the separation efficiency in present systems, and to aid in the development of membrane technology. The use of surface spectroscopic techniques to study polymer/adsorbate interactions offers a number of advantages over the more traditional analytical meth- ods: examination of the outer atomic layers of the membrane, which must influence the adsorption properties of the material; microscopic examination of individual adsorption sites; and identification of fouling behaviour at very low (parts per million (ppm)) adsorbate concentrations which are inaccessi- ble to conventional techniques.
Static Secondary Ion Mass Spectrometry @SIMS) is an attractive choice for such studies because it offers extreme surface sensitivity (sub-monolayer), very low detection limits (ppm or ppb) and, when combined with the time-of-flight capability, permits very high mass resolution to differentiate similar
0169-4332/96/$15.00 0 1996 Elsevier Science B.V. All rights reserved SSDI 0169-4332(95)00453-X
42
zyxwvutsrqponmlkjihgfedcbaZYXWVUTSRQPONMLKJIHGFEDCBA
P. Spwack. Y. Deslandes/A pplied Surface Science 99 (1996141-50B
Cf.6 -on %zyxwvutsrqponmlkjihgfedcbaZYXWVUTSRQPONMLKJIHGFEDCBA
-(Cti>-CF,)- ”I’
CY , ‘WW), deh/dmabiaticadd poly(viyliifiuaide) Fig. I. Chemical structures of dehydroabietic acid and PVdF.mass fragments. Despite these obvious advantages, there has been little work published on the use of static SIMS in adsorption/fouling studies [7- 131.
This paper details the use of a model system to examine the interaction of organic pollutants found in pulp and paper effluent with membranes presently used for their removal. The choice of membranes and foulants, and the range of foulant concentrations were all chosen to reflect typical conditions which are found in industrial use. The model system chosen for examination involves a single representative pol- lutant, dehydroabietic acid, interacting with poly(vinylidene fluoride). Feeder samples taken from pulp and paper mills in Thunder Bay [14] and Fort William [151 showed dehydroabietic acid to be pre- sent in the range of 39 to 78 ppm, and that dhAA is the major constituent of the resin and fatty acids. Dehydroabietic acid (dhAA) is a resin acid (MW 340.28) which has the chemical formula CZOHZ80Z. while poly(vinylidene fluoride), or PVdF, is a fluori- nated polymer. The structures of the two materials
are shown
zyxwvutsrqponmlkjihgfedcbaZYXWVUTSRQPONMLKJIHGFEDCBA
in Fig. 1. This paper reports on the application of Time-of-Flight SIMS to membrane fouling, by examining the adsorption behaviour of poly(vinylidene fluoride) in contact with aqueous solutions of dehydroabietic acid in the concentration range 0- 1000 ppm. The detec- tion limits for this pollutant/membrane system are determined by ToF-SIMS.
2.
zyxwvutsrqponmlkjihgfedcbaZYXWVUTSRQPONMLKJIHGFEDCBA
Experimental 2. I. Time-of-jlight secondar? , ion mass spectrometq(ToF-SIMS)
The SIMS analyses were carried out on a Kratos Prism ToF-SIMS instrument with a reflectron mass analyzer which is capable of mass resolution, m/A m,
> 5000 at m/z 27. The base pressure of the instru- ment was N 5 X 10m8 Pa (4 X lo-” Torr). The instrument uses a 25 keV 69Ga liquid metal ion source (LMIS) and was run at a working pressure of N 5 X IO-’ Pa (4 X 10m9 Torr). The total ion flux was kept below lOI ions/cm’ per experiment, which is within the static regime [16]. A rastered ion beam produced an analysis area of 200 pm’ (i.e. 14.1 p,rn X 14.1 pm). A minimum of 3 areas were analysed per sample unless otherwise stated. The negative ion spectra of both the membrane and the dehydroabietic acid were run, but the ion intensities were extremely low and did not yield any useful information. Therefore, only the positive ion spectra were used. Mass calibration of low resolution spectra was achieved using ion peaks from H+. Cf. CH+, CH 1, CH :, C Z H f (occasionally), C Z H : (occasion- ally), as well as Na+, and Mg+ when present. High mass resolution spectra were calibrated using the aforementioned peaks (except CH;), as well as im- planted Ga+, and additional peaks whose identity could be unambiguously determined. Charge neutral- isation of the non-conducting surfaces was achieved using a low energy electron flood gun. The instru- ment was used in the pulsed-mode, wherein the ion beam was pulsed in sequence with the flood gun and the detector using IOO- 150 ns pulse widths. An analyzer (collection) resolution of 10 ns was used for the low resolution spectra, and either 625 ps or 3 12 ps resolution was used for the high resolution spec- tra. The data was transferred (for deconvolution) at
IO ns or 1.25 ns resolution, respectively, for the low and high resolution spectra. The high mass resolution spectra are presented using the following format: The twenty (or twenty-five) most abundant ion frag- ments above m/z 15 (excluding inorganic impuri- ties) are tabulated in decreasing order of intensity. Each mass fragment, designated by its mass-to-charge ratio (m/z), is presented with its assigned chemical identity. In cases where the identity of an ion peak cannot be unambiguously assigned to an individual species, the additional chemical identities are in- cluded. If an individual ion mass contains two (or more) chemical species which are not completely resolved in the mass spectrum (i.e. m/; 69 = CFjt on PVdF and = C,HG on dehydroabietic acid), then the contribution of each chemical species to the total ion intensity is estimated.
P. Speuack, Y. Deslandes / Applied Surface Science 99 (1996) 41- 50 43
2.2. Sample/solution preparation
Polymer samples were cut into N 1 cm2 coupons and placed into a Soxhlet extraction apparatus, where the membranes were alternately refluxed in reagent grade hexanes, methanol, and distilled water. The membranes were air dried (5-15 min) prior to inser- tion into the spectrometer vacuum system.
Solution preparation was as follows: Dehydroabi- etic acid (Pfaltz and Bauer, Inc.; technical grade) was crushed to a fine powder using a mortar and pestle. Distilled water was used to make up all of the solutions. The distilled water was filtered through a glass frit funnel prior to use. A quantity of reagent grade ethanol was used to solubilise the resin acid. Usually, about 10% of the total solution volume was made up of ethanol. Solutions were made up in volumetric flasks and refrigerated when not in use. After sitting refrigerated for two weeks, any unused solution was discarded and fresh solutions were pre- pared. In most cases, freshly prepared solutions were used for each new experiment. Approximately 100 ml of test solution was poured into a 150 ml beaker and set vigorously stirring. Membrane samples were left in the stirred solution for 24 h at room tempera- ture. The beakers were covered with a watch glass to prevent contamination or evaporation of the solu- tions during testing. The membranes were removed from the test solutions and rinsed in an ultrasonic
bath for 2
zyxwvutsrqponmlkjihgfedcbaZYXWVUTSRQPONMLKJIHGFEDCBA
X 0.5 h with two 80 ml portions of distilled water. After air drying (u 5 min), the sam-ples were placed into the spectrometer for SIMS analysis.
The polymer used in this study was a commer- cially prepared sample of poly(vinylidene fluoride) (PVdF), prepared from a Koch membrane (HFM
180).
3. Results and discussion
3.1. Reference spectra
3.1.1. Poly(l;inylidene
zyxwvutsrqponmlkjihgfedcbaZYXWVUTSRQPONMLKJIHGFEDCBA
fluoride)A sample of the high resolution SIMS spectra of PVdF is presented in Fig. 2. As expected, fluorinated species dominate the ion fragments. Low resolution spectra were recorded from six areas (not shown).
7
zyxwvutsrqponmlkjihgfedcbaZYXWVUTSRQPONMLKJIHGFEDCBA
fluo rine c o nta ining fra g m e nts *
i
a .m .u.
Fig. 2. ToF-SIMS spectrum of PVdF.
The analyses yielded fairly consistent spectra with varying amounts of Na+ and Ca+ as impurities.
3.1.2. Dehy droabietic acid
An example of the low resolution ToF-SIMS spectra obtained from dehydroabietic acid (pressed on graphite tape) is displayed in Fig. 3. Since dehy- droabietic acid is a partially saturated/partially un- saturated organic acid, its fragmentation pattern will reflect these qualities. As can be seen from the tabulated data, there are very few oxygenated species. This is unfortunate, because oxygenated fragments would provide distinctive ‘signatures’ that would aid in identification of the adsorbed acid on the mem- brane surface. The importance of this point will become apparent when dealing with very weak con- centrations of resin acid.
I”“‘. ““““““““I’.‘l’.“. ‘I
2b 4b 6b 8b id0 120 140 160 160 200
a .m .u.
Fig . 3. Low re so lutio n ToF-SIMS spectrum of dehydroabietic acid.
44
zyxwvutsrqponmlkjihgfedcbaZYXWVUTSRQPONMLKJIHGFEDCBA
P. Sprt~act Y. Deslandes/Applied Surfbce Science 99 f 19961 41- 50zyxwvutsrqponmlkjihgfedcbaZYXWVUTSRQPONMLKJIHGFEDCBA
3.2. Identification scheme Table 3
An identification scheme was developed to deter- mine the presence of dehydroabietic acid adsorbed on the surface of the poly(vinylidene fluoride). Using the twenty or twenty-five most intense ion peaks obtained from the high resolution SIMS analysis of dehydroabietic acid and poly(vinylidene fluoride),
and choosing only ion fragments whose identity was unambiguously assigned, a ‘signature’ of ion peaks for each material can be observed under low resolu- tion SIMS conditions. Ion fragments which are com- mon to both the membrane, PVdF, and dehydroabi- etic acid (including the low mass ( I 43 amu) hydro- carbon fragments), are excluded from this identifica- tion scheme. The signature peaks can be used to qualitatively identify the presence of both PVdF and dhAA.
Signature peaks for dehydroabietic acid N2 / ; Identity 53 C,H: 55 C,H: 67 C,H: 79 C,H: 91 C,H: 105 C,H; 115 C,H:/C,H, 10:
Note: there are several peaks between ,n/z 1 15-l 75 which may be useful for identification.
following concentrations: 1000 ppm, 250 ppm, 100 ppm, 50 ppm, 10 ppm, and 1 ppm. The following section presents the ToF-SIMS results carried out on membranes tested in each of the solutions in succes- sion, and a discussion of each set of results. The signature peaks chosen for PVdF include the
following mass fragments (Table 1):
The signature peaks chosen for dhAA include the following mass fragments (Table 2):
3.3.1. PVdF + 1000 ppm dehydroabietic acid solu- tion + I h rinse
3.3. Adsorption experiments
The adsorption experiments were carried out as outlined in the Experimental Section. A series of dehydroabietic acid solutions were prepared with the
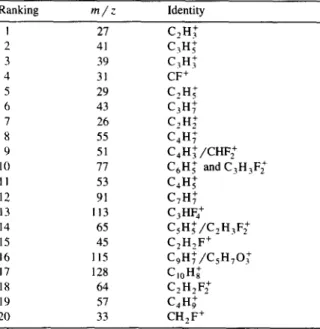
A series of PVdF membranes were immersed in 1000 ppm dehydroabietic acid solutions and then rinsed in an ultrasonic bath for one hour. Following the adsorption experiments, the membranes were analysed for the presence of adsorbed dehydroabietic acid. A summary of the high resolution ToF-SIMS results are presented in Table 3.
Table 1
Signature peaks for poly(vinylidene fluoride) m/z Identity 31 CF+ 32 CHF+ 33 CH?F+ 38 C,H; 45 C:H?F+ 51 CHF,+ 59 CJ,F+ 64 C,H,F: 65 C;H,F,+ 74 jl C,F; 75 C,HF’ 95 C,H,F: 108’ C,H,F: 113 C,HF: 133 C,H,F:
’ Peaks not among the 20 most intense. but useful for identifica- tion..
At a solution concentration of 1000 ppm, detec- tion of dehydroabietic acid on PVdF is fairly straightforward using the ‘signature’ peaks previ- ously assigned to each material. The series of low resolution ToF-SIMS spectra displayed in Fig. 4 illustrates the presence of ion peaks due to both dehydroabietic acid and poly(vinylidene fluoride). The spectra also show an inhomogeneous distribu- tion of resin acid on the membrane as evident by the varying intensities of the two sets of ion peaks.
It is worthwhile to comment on the distribution of adsorbed dehydroabietic acid on the PVdF mem- brane. The fact that the ToF-SIMS results show the presence of both resin acid and PVdF on all areas analysed indicates that the resin acid is inhomoge- neously adsorbed on the surface of the PVdF, al- though the thickness of the adsorbed layer is not known. This statement should be qualified. It is
possible that some of the resin acid has desorbed
P. Spwack. Y. Deslandes /Applied
zyxwvutsrqponmlkjihgfedcbaZYXWVUTSRQPONMLKJIHGFEDCBA
Surface Science 99 ( 1996141- 50 45dure, but we are unable to measure any desorption using ToF-SIMS. The rinsing water was not analysed for traces of dehydroabietic acid, although some solid material has been observed. On the basis of the adsorption experiments, one can definitively state that desorption, if present, is partially or wholly irreversible under the rinsing conditions used in this study.
However, all of the results have been examined under the premise that the polymer surface is com- pletely flat. This assumption is not completely true. First, the polymer chains which comprise the mem- brane surface contain fine structure, which appear as
‘nodules’ in a secondary electron image (see Fig. 5) [ 171. These nodules can be seen to have a diameter of approximately $- i pm, hence an estimate of the surface roughness can be obtained as one-half the nodule diameter. This corresponds to - 125-250 nm. Beyond this range, there may be gross changes in the surface roughness which cannot be estimated. The membrane also contains pores of a finite size and distribution. Both of these factors will influence the measured signals in ToF-SIMS. Fig. 5 shows secondary electron micrographs taken of a PVdF membrane (HFM 180 Koch) at two different magnifi-
Table 3
ToF-SIMS analysis of PVdF+ 1000 ppm dhAA solution + 1 h rinse Ranking m/z Identity I 27 C?H: 2 41 C,H: 3 39 C,H: 4 31 CF+ 5 29 C,H; 6 43 C,H: 7 26 C,H; 8 55 C,H: 9 51 C,H:/CHF; IO II C,H; and C,H,F; II 53 C,H: 12 91 C,H: 13 113 C,HF; 14 65 C,H:/C,H,F: 15 45 C,H,F + 16 115 C,H:/C,H,O.: 17 128 C,,H; 18 64 C,H2F2+ 19 57 C,H; 20 33 CH2F+ 1 st area
l ion fragments due to PVdF
# ion fragments due to dhM
a.:.“.
2nd area ]
a.:.“. 100
zyxwvutsrqponmlkjihgfedcbaZYXWVUTSRQPONMLKJIHGFEDCBA
120Fig. 4. ToF-SIMS spectra of PVdF immersed in 1000 ppm dhAA solution + 1 h rinse.
cations. One set of micrographs shows a pristine membrane, while the second set shows a membrane fouled by a mill feed. The membranes were fouled by permeation tests, not through simple static adsorp tion tests as was the mechanism involved in this work. The outline from the fouled membrane has a ‘string-like’ structure on its surface. Large empty spaces are visible just below the top surface of the membrane. These spaces, called ‘voids’, form during the casting process.
3.3.2. PVdF + 250 ppm dehy droabietic acid solution + I h rinse
Eight areas of the immersed PVdF membrane were analysed by low resolution SIMS. All eight areas show ion peaks due to both dhAA and PVdF, although the relative concentrations of both species vary among the regions. This suggests an inhomoge- neous distribution of resin acid on the PVdF. The
46
zyxwvutsrqponmlkjihgfedcbaZYXWVUTSRQPONMLKJIHGFEDCBA
P. Speuack. Y. Deslandes/Applied Surface Science 99 (1996) 41-50zyxwvutsrqponmlkjihgfedcbaZYXWVUTSRQPONMLKJIHGFEDCBA
presence of dhAA and PVdF was determined fromthe ‘fingerprint’ mass fragments previously detailed (see 1000 ppm case for details). Two high resolution analyses were also run to verify the peak assign- ments.
3.3.3.
zyxwvutsrqponmlkjihgfedcbaZYXWVUTSRQPONMLKJIHGFEDCBA
PVdF + 100 ppm dehy droabietic acid solution + I h rinseThe ‘fingerprint’ ion fragments used previously with the 1000 ppm and 250 ppm treated membranes were inadequate to determine the presence of resin acid adsorption at 100 ppm concentrations on the low resolution spectra. The five regions analysed by high resolution ToF-SIMS displayed some minor differences among the spectra, but none of the varia-
a) Clean PVdF Membrane
b) Fouled PVdF Membrane
tions were believed to be significant. The low resolu- tion analyses (five regions) yielded fairly consistent spectra, but offered no clues as to the presence of adsorbed resin acid. The low concentrations of resin acid used in these tests made identification of ad- sorbed dehydroabietic acid very difficult, and ren- dered the ‘signature peaks’ unreliable for positive identification. Therefore, a more intensive screening process was developed to determine the presence of adsorbed dehydroabietic acid at solution concentra- tions less than 250 ppm. This scheme uses high resolution analysis of individual peaks to elucidate the presence of any resin acid. The following peaks were chosen as potentially suitable for identifying adsorbed dehydroabietic acid on PVdF (Table 4).
P. Specack. Y. Deslandes /Applied Surface Science 99 (1996141- 50 47
Table 4 Table 5
Ion masses used for resin acid identification Identification of dehydroabietic acid (from 100 ppm solution) on PVdF
Ranking a m / z dhAA PVdF
I1 69 C,H,+ CF: (C,Hi (small shoulder)) 8 77 b C,H; C,H,F’
6 91 C,H; nothing 12 105 C,H; nothing
a Determined from high resolution spectra of dehydroabietic acid. b Exact masses of the two ions are very similar: i.e. C,Hl = 77.0391 and C,H,FT = 77.02026.
Despite the perceived suitability of the m/z 77 ion peak as a reliable identification tool. it was found to consistently yield a negative result when used as part of the identification scheme at solution concentrations I 100 ppm.
Two additional peaks were selected for identifica- tion purposes. m/z 115 C,H,Fd’ (exact mass lI5.01706), has a weak intensity in the PVdF spec- tra, and is a complementary peak to the intense peak at m/z 113, C,HF,+. Dehydroabietic acid also con- tains a peak at mass 115; namely, C,Hq (exact mass 115.0574). High resolution SIMS can differentiate between the masses of these two peaks, enabling identification of the two ion species. High resolution SIMS performed on nine samples confirmed that untreated (i.e. clean) PVdF membranes contain only C,H,F,f. The presence of both C,H,Fl and C,H: ions would indicate dehydroabietic acid adsorption on PVdF. The second peak chosen for identification was m/z 141. Dehydroabietic acid contains a weak ion peak, C,,Hi, at this mass. Confirmation of this peak was taken as a spectral intensity of 2 2 X
background intensity. Nine samples of PVdF were analysed by high resolution SIMS to verify that no ion peak exists at mass 141 on the untreated mem- brane. Since the spectral intensity of all the identifi- cation peaks will be very weak, confirmation of adsorbed dehydroabietic acid will be determined on the basis of the overall profile obtained from the identification scheme, rather than from the results of any one or two individual ion peak(s).
The results of this new scheme as applied to the 100 ppm adsorption experiments are presented in Table 5. The convention to be used in Table 5 and subsequent tables is that ‘yes’ indicates confirmation of the identification peak, while ‘no’ indicates its absence. The identification summary suggests that
ID peaks Yes No Maybe m/z 69 (1 X2X4X5) (3) m/z 77 (1 X2X3X4) (5) m/z 91 (1)(2X3)(4X5) m/z 105 ( 1 X2X3X4X5) m/z 115 (1 X2X3X4X5) In/,- 141 (1 X2X3X4X5)
Identifications summary: Area (I), 5 yes and 1 no; Area (2), 5 yes and I no; Area (3). 4 yes and 2 no; Area (4),5 yes and 1 no; Area (5). 5 yes and 1 maybe
dehydroabietic acid is present in all five areas of the membrane examined by ToF-SIMS.
3.3.4. PVdF + 50 ppm dehy droabietic ucid solution + 1 h rinse
The results obtained from low resolution ToF- SIMS analysis taken on five regions of PVdF ex- posed to 50 ppm dehydroabietic acid solution indi- cate that the spectra are highly consistent, although some relative variations exist. Of the six areas that were analysed by high resolution SIMS, only very minor differences were noted among the spectra. The detailed identification scheme was used to identify resin acid residues on the membrane surfaces (Table 6). The identification summary suggests that regions ( 1 j(2)(5) likely contain adsorbed dehydroabietic acid, while regions (3X4) show no resin acid present. The results for region (6) are inconclusive.
Table 6
Identification of dehydroabietic acid (from 50 ppm solution) on PVdF
ID peaks Yes No Maybe
m/z 69 (3X4) (1X2X5X6) m/z 77 m/z 91 (1X2X5) ;;D@:“““““X”’ (3) m/; 105 (1X2X5) (3X4X6) m/z 115 (1X2X5) (3X4) (6) a m/z 141 (1X2X5) (3X4) (6) a a Very low intensity in area (61, making the assignment question- able.
Identification summary: Area cl), 4 yes, 1 no and I maybe; Area (21, 4 yes. I no and I maybe; Area (31, 5 no and 1 maybe; Area (4). 6 no; Area (5). 4 yes, 1 no and 1 maybe; Area (6). 3 no and 3 maybe.
48
zyxwvutsrqponmlkjihgfedcbaZYXWVUTSRQPONMLKJIHGFEDCBA
P. Sperwk. Y. Deslandes/ Applied Swfbce Science 99 (I9961 41-50Table 7
Identification of dehydroabietic acid (from 10 ppm solution) on PVdF
ID peaks Yes No Maybe m/z 69 (2)(4) (3M5X6) (1) m/z 71 (6) (2X3) (1X4)(5) flz/; 91 12)13X5)(6) (1x4) m/z 105 (2X4) (1 X3)(5) (6) m/ z 115 (4)(5X6) (2) (I K3) m/z 141 (6) (1X2)(3X5) (4) d
’ Borderline intensity, i.e. - 2
zyxwvutsrqponmlkjihgfedcbaZYXWVUTSRQPONMLKJIHGFEDCBA
X background. Identification summary: Area (I), 4 maybe and 2 no: Area (2), 3yes and 3 no; Area (3), I yes. 4 no and 1 maybe; Area (4), 3 yes and 3 maybe; Area (5). 2 yes, 3 no and I maybe: Area (6). 4 yes.
1 no and I maybe.
zyxwvutsrqponmlkjihgfedcbaZYXWVUTSRQPONMLKJIHGFEDCBA
3.3.5. PVdF + 10 ppm dehydroabietic acid solution
+ I h rinse
Although a large number of regions were anal- ysed by low resolution ToF-SIMS (eleven regions on two different samples), the variations among the spectra were quite subtle and made it impossible to determine whether any dehydroabietic acid was ad- sorbed to the surface. Many of the ‘characteristic (or fingerprint) peaks’ previously used to qualitatively determine the presence of adsorbed fatty acid on the membrane surface were no longer reliable indicators. At 10 ppm concentration of the resin acid, even minor peaks from the membrane which were previ- ously ignored must now be considered for their potential interference. The detailed analysis of the six regions recorded from high resolution SIMS is presented below (Table 7). The summary results suggest that area (6) may contain dehydroabietic acid, while area (4) is questionable. There is not enough evidence to support the existence of resin acid in any of the other areas analysed.
3.3.6. PVdF + I ppm dehydroabietic acid solution + I h rinse
Three areas were analysed by low resolution SIMS, and two areas by high resolution SIMS. The low resolution spectra were quite consistent, al- though there were some relative peak variations among the three areas. The high resolution ToF-SIMS results showed some minor differences between the spectra of the two regions, but none of the variations were believed to be significant. Most of the charac-
teristic peaks used for resin acid identification fell within the background noise of the SIMS spectra, As a further verification, a series of blank runs were completed on PVdF membranes. The testing proce- dure for the blank runs was identical to the method used for the samples involving the resin acid, except that the solutions contained no dehydroabietic acid. The slight variations noted among the spectra treated with 1 ppm resin acid solutions were within the level of noise noted among the blank runs. It is felt that the test procedure involving ‘signature peaks’ is inconclusive for samples immersed in solutions with less than 10 ppm content of dehydroabietic acid. Therefore, on the basis of these spectra alone, it is not possible to confirm the presence of any adsorbed resin acid on the PVdF. The use of a distinctive chemical marker attached to the resin acid, such as an isotope, or an inorganic element (i.e. Cl) would provide a conclusive SIMS ‘signature’ which may enable the determination of very low resin acid concentrations i.e. < 10 ppm.
No specific information is currently available about the nature of the dehydroabietic acid in solu- tion. Dehydroabietic acid has amphipathic properties, containing both polar and non-polar groups. This property causes dehydroabietic acid to form micelles in solution. The size and shape of these micelles at different concentrations is not known. This uncer- tainty compounds the difficulty in detecting the ad- sorbed resin acid on the membrane, especially at very low solution concentrations. If the dehydroabi- etic acid is adsorbed on the membrane surface as micelles, then the vigorous cleaning procedure in the ultrasonic bath may ‘break’ the micelles into smaller aggregates (cohesive failure), thereby removing some of the material from the surface. However, the basic layer at the membrane/dhAA interface would be unaffected due to the strong adhesive forces.
The ToF-SIMS results show that adsorptive foul- ing behaviour of PVdF occurs at very low dhAA solution concentrations. Adsorption of any material on a membrane will have a deleterious effect on its performance-the size ratio between the foulant and pores is the essential factor involved. Possible foul- ing mechanisms are shown below in Fig. 6 [18]. In case (a>, adsorption occurs only on the surface be- cause the pores are too small to allow dhAA to enter. At the opposite extreme, the foulant is very small
P. Spernck. Y. Deslandes/Applied Sw$ace Science 99 (1996) 41- 50 49 Adsorptive Fouling ; .? (? ;I : ?I j membrane ~ L_._ ~_._ ;/ ;&_A.: ‘I’. pores
a) Pore size << foulant size: with added hydraulic resistance, separation determined by membrane.
b) Pore size >> foulanl size; with added hydraulic resistance, separation determined by altered pore size.
c) Pore size > foulant size; with added hydraulic resistance, separation determined by fouling layer.
Fig. 6. Schematic diagram illustrating the principles of adsorptive fouling.
compared to the pore size, case (b). An intermediate case, (c), is observed when adsorption occurs both in the pores and on the surface. In each case, the hydraulic resistance is increased resulting in lower fluxes. The retention capability of the membrane is also changed. In case (a), retention is still determined by the membrane. Case (b), described as the pore restriction model, results in a smaller effective pore size. The form in which dhAA exists in solution, either as unimolecular and/or micellular structure(s), will have a profound influence on which adsorption mechanism applies. The molecular weight cut-off of the PVdF is rated at 100 kDaltons, while the molecu- lar weight of dhAA is only 300 g/mol. In this case, unimolecular dhAA can adsorb both on the surface and within the pore itself (case (b)). Considering micellular dhAA, both the size of the micelles and
the likelihood that the micelle structures will remain intact after adsorption will determine the adsorption mechanism. It is, therefore, possible that multiple fouling mechanisms are occurring.
With a SIMS sampling depth of N 1 monolayer, only the top surface of the membrane or adsorbed material is examined. The sampling area is N 14 X
14 pm, which would include 102-lo4 pores; hence, information gained from ToF-SIMS represents an average of clean PVdF and adsorbed dhAA, found both on the pores and on the surface. Therefore, the specific fouling mechanism cannot be identified at the present time.
4.
zyxwvutsrqponmlkjihgfedcbaZYXWVUTSRQPONMLKJIHGFEDCBA
ConclusionsThis exploratory study describes the application of ToF-SIMS to the complex problem of membrane fouling. This study has yielded some insight into the interactions between dehydroabietic acid and poly(vinylidene fluoride), and the usefulness of ToF-SIMS to study these interactions. The informa- tion gained through this study is important on two levels. First, it provides some fundamental results on the interaction of a ‘model’, small molecule/one membrane system. On an applied level, this study has yielded adsorption data from a commercial mem- brane and known foulant, dehydroabietic acid, using solution concentrations which reflect industrial con- ditions.
ToF-SIMS has confirmed the presence of ad- sorbed dehydroabietic acid on PVdF membranes from solution concentrations ranging from 10 ppm to 1000 ppm. The detection limit of ToF-SIMS in this adsor- bate/membrane system is the 10 ppm dhAA solu- tion. Using the present detection scheme, this lower limit appears to be governed by the intrinsic proper- ties of the resin acid/membrane system rather than instrumental limitations. The detection of lower con- centrations may be possible through isotopic substi- tution.
The ToF-SIMS analyses indicate that the resin acid is adsorbed inhomogeneously on the surface of the membrane. This suggests that specific adsorption sites may be present. This phenomenon is likely influenced by the presence of micelles.
50
zyxwvutsrqponmlkjihgfedcbaZYXWVUTSRQPONMLKJIHGFEDCBA
P. Sperack, Y. Deslandes/Applied Sut$ace Science 99 (1996141- 50zyxwvutsrqponmlkjihgfedcbaZYXWVUTSRQPONMLKJIHGFEDCBA
Acknowledgements
The authors would like to thank Mr. M.M. Dal-Cm and Mr. CM. Tam (National Research Council Canada) for their helpful suggestions during the preparation of this manuscript. We gratefully appre- ciate the use of one of their figures and some sec- ondary electron micrographs, as well as supplying the membranes and chemicals for this project. P. Spevack would like to acknowledge the National Research Council of Canada for funding his Re- search Associateship.
References
[I] R.J. Petersen, J. Membr. Sci. 83 (19931 81. [2] J. Lyklema, Coil. Surf. 10 (1984) 33. [3] L.J. Zeman, J. Membr. Sci. 15 (1983) 213.
[4] A. Suki, A.G. Fane and C.J.D. Fell, 1. Membr. Sci. 21 (1984) 269.
[5] J.-Y. Chen and W. Pusch, J. Appl. Polym. Sci. 33 (19871 1809.
[6] G. Crazes. C. Anselme and J. Mallevialle, J. Membr. Sci. 84 (1993) 61.
[7] C.M. Rojas, D. Goossens and R. Van Grieken, J. Aerosol. Sci. 20(5) (19891 569.
[8] J.S. Brinen and R.J. Proverb, Nord. Pulp Pap. Res. J. 4 (1991) 177.
[9] M. Fontyn, B.H. Bijsterbosch and K. van’t Riet, J. Membr. Sci. 36 (1987) 141.
[lo] J.S. Brinen, Nord. Pulp Pap. Res. J. 1 (1993) 123.
[l 11 W.F. van Straaten-Nijenhuis, E.J.R. Sudholter, F. de Jong and D.N. Reinhoudt. Langmuir 9 (1993) 1657.
[12] M. Fontyn, K. van’t Riet and B.H. Bijsterbosch, Coil. Surf. 54 (19911331.
[13] M. Fontyn, K. van’t Riet and B.H. Bijsterbosch, Coll. Surf. 54 (1991) 349.
[14] Results communicated between P. Ramamurthy (PAPRI- CAN. Pointe Claire. PQ.1 and A. Kumar (NRC. Ottawa, ON.1 on July 15. 1993.
[ 151 Results communicated between M. Wilson (Abitibi-Price, Mississauga, ON.) and M. Dal-Cin (NRC, Ottawa, ON.1 on September 16, 1992.
[16] A. Benninghoven. F.G. Rudenauer and H.W. Werner, in: Secondary Ion Mass Spectroscopy (Wiley, Chichester, 19871 p. 671.
[17] Photomicrographs reproduced with permission from C. M. Tam (NRC, Ottawa, ON.).
[ 181 Figure reproduced with permission from M. Dal-Cin (NRC, Ottawa, ON.).