Business & Technology Strategies to promote the
Development and Commercialization of Alternative Energy
Technologies like Fuel Cells
By:
Sundar Jayaraman
Submitted to the System Design and Management Program in Partial Fulfillment of the Requirements for the Degrees of
Master of Science in Engineering and Management
at theMassachusetts Institute of Technology
January 2007© 2007 Sundar Jayaraman, All Rights Reserved
The author hereby grants to MIT permission to reproduce and distribute publicly paper and electronic copies of this thesis document in whole or in part.
Author: ... ... ... a ...
Sundar Jayaraman System Design and Management Program
A KA
-C e rtified by: ... .... \, . ... . . ... ... ,... .
V~o~o ,.• = o.. , v...=• .•v= esis Superviso.: Michael Davies Senior Lecturer, M ystem Design and Management Pat Hale C ertified by: ... MASSACHUSETTS 1NSTITFUTj OF TECGHNOLOCGY MAY 0 6 2008 ARCHIVES LIBRARIES S.... ... .. ... Pat Hale Director, System Design and Management
Abstract
Globalization has led to the development of emerging markets and economies. With economic expansion around the globe, there is a greater energy demand to sustain this growth. Increasing energy demand has resulted in increase in energy prices and increase in emission levels. While conventional energy technologies have advantage in terms of established infrastructure and lower cost, they are inefficient and rely heavily on fossil fuels. Conventional energy technologies alone cannot sustain and cater to the evolving energy market's needs of higher efficiency, lower emissions and resources conservation. Renewable energy solutions and alternative energy technologies like distributed generation need to be developed to meet this energy demand, conserve the definite resources and reduce emissions. But at the moment, alternative energy technologies due to lack of infrastructure, development cost and regulations are limited in their applications. Therefore in the near term, we recommend that they strategically position themselves in the market with niche and right fit opportunities. We also recommend that they need to utilize the development dollars effectively in integrating technology development with their product development activities and develop durable cost effective products. They also need to develop key partnerships and integrate value across their development and fulfillment chains. Strategic positioning, value chain integration and key execution in development with mature processes will aid alternative energy technologies to overcome the existing market barriers and move towards rapid commercialization.
Table of Contents
Acknowledgements ... 7
Chapter 1 : Introduction ... 8
1.1 Introduction Discussion Overview...8
1.1.1 Supply Pressure on Fuel Resources...9
1.2 Conventional Energy M odels ... 10
1.2.1 Power Generation and Distribution - Current Energy Model...11
1.2.2 Issues with the Current Grid Model...12
1.2.3 Emissions and Transportation Applications...15
1.3 Alternative Energy M arket... ... 16
1.3.1 Alternative Energy Segments and Technologies ... 17
1.4 Fuel Cells Historical Perspective... 18
1.4.1 Traction in Fuel Cell Industry...20
1.5 Thesis Context... 21
Chapter 2.0: Value Identification (Parameterizing the Technology Solutions)... 22
2.1 Alternative Energy Technologies Value Proposition with respect to Grid.... 23
2.2 Parameterizing the Technology Solutions ... 25
2.2.1 Cost of Electricity with Alternative Energy Solutions...27
2.2.2 Installed Price ... 29
2.2.3 Cost of Generation ... 29
2.2.4 Em issio ns ... 29
2.2.5 A ssured Pow er...29
2.2.6 Resource Lim itation...30
2.3 Non Renewable CHP Solutions ... 30
2.3.1 Cost of Generation ... 31
2.3.2 Em issions and Life ... 32
2.3.3 Assured Power and CHP credits...32
2.4 Value Identification ... 33
2.4 .1 O pportunities ... 34
2.4.2 Barriers to Entry ... 34
2.4.3 Tip off Points...35
Chapter 3.0 Value Capture Strategies ... 37
3.1 Internal Development... 37
3.2 Acquisitions ... 38
3.3 Licensing ... 38
3.4 Joint Venture Alliances... 39
3.5 Venturing ... 39
3.6 Development of Risk M atrix ... 40
3.6.1 H igh Risk Zone ... 44
3.6.2 Organic Growth Zone...46
3.6.3 Partnership and Strategic Zone ... 48
3.7 Best Entry Strategy M apping... 50
3.8 Developing a Growth Strategy ... 51
3.9 Strategic Growth stages for Technology Companies... 52
3.9.1 Strategic Growth stages for Auto OEMS...53
3.10 Validating the proposal ... 54
3.11 Linking Value Capture and Value Delivery... 56
Chapter 4.0: Value Delivery ... 57
4.1 Integrating Technology Development into Product Development...58
4.2 Stages Involved in Technology Development Process... 61
4.3 Construction of DSM ... 62
4.4 DSM OF TECHNOLOGY DEVELOPMENT PROCESS ... 63
4.5 Uncertainty analysis of other stages ... 66
4.6 Inference from DSM Analysis ... 67
4.7 Recommendations based on DSM Analysis... 67
4.8 Spiral Development M odel... 68
4.8.1 Spiral Model Characteristics ... 68
4.8.2 Transformation of the linear TDP process into Spiral Model...69
4.8.3 Benefits of Spiral Development Model ... 70
4.9 Developing Technology Platform s ... 70
4.10 In the Context of Value Delivery... 72
4.10.1 Merits of technology Platforms from a value delivery standpoint...72
Chapter 5.0: Value Integration...73
5.1 Adapting to the M arket... 74
5.1.1 Strategic Partnerships with Utilities...74
5.1.2 Financing to offset sticker shock ... 76
5.1.3 Leveraging Value in Transportation Applications ... 76
5.2 Shaping the Future... 76
5.3 Competing through Value Chain Integration - Reserving the right to Play .. 77
Chapter 6: Conclusion ... 80
Table of Figures
1) Figure 1.1.1-1 World Energy Demand and Resources Projections...10
2) Figure 1.2.1-1 Grid Utility Model - Stationary Power... 11
3) Figure 1.2.2-1 Grid Utility Model - World Transmission Losses...13
4) Figure 1.2.2-2 Grid Utility Model - Losses...14
5) Figure 1.2.3-1 C02 Emissions and Global Temperature Increase...15
6) Figure 2-1 Cost of Electricity depending on Sectors...22
7) Figure 2-2 Electric Utility Price across US States...23
8) Figure 2.2-1 Qualitative comparison of Renewable and Non Renewables...26
9) Figure 2.2.1-1 Cost of Generation...28
10) Figure 2.3-1 Qualitative comparison of Non Renewable CHP Solutions...31
11) Figure 2.4-1 Value Identification for Alternative Energy Solutions ... 33
13) Figure 3.6-1 Risk Matrix...42
14) Figure 3.6-2 Risk Matrix Entity Classification...43
15) Figure 3.6.1-1 High Risk Zones...44
16) Figure 3.6.2-1 Organic Growth Zones...46
17) Figure 3.6.3-1 Partnership and Strategic Zones... 48
18) Figure 3.7-1 Entry Stage Mapping... 50
19) Figure 3.8-1 Growth Strategy Mapping... 51
20) Figure 4.1-1 Product Development Processes...58
21) Figure 4.1-2 Integration Issues with TDP...59
22) Figure 4.1-3 Structured TDP Insertion and Drawbacks...60
23) Figure 4.4-1 DSM of Technology Development Processes...63
24) Figure 4.4-2 Design Cycle Time Uncertainty Analysis...64
25) Figure 4.4-3 Uncertainty Time Involved W ith Stages...65
26) Figure 4.5-1 Uncertainty Analysis within stages of TDP...66
27) Figure 4.8.2-1 Transformation of Linear Process into Spiral...69
28) Figure 4.9-1 Product Platforms...71
29) Figure 5-1 Strategic Orientation...73
30) Figure 5.1-1 Peak Power Premium... ... 75
31) Figure 5.3-1 Reserving the right to Play... 77
Acknowledgements
This thesis is a product of interconnection between the challenges I see in alternative energy companies and the breadth of knowledge and solutions that were discussed in classes by the great professors and students here at MIT. I am very great full to my wife Rama for her help and patience during the personal hours I need to put developing the Thesis while working fulltime. I am very great full to my mother and sister who are always been a great source of inspiration to me. My sincere appreciation and thanks to Professor Michael Davies for his time and guidance. I am very thankful to Pat Hale for his empathy and guidance all through the SDM program, not just this thesis. I am also very appreciative of the support provided by Bill Foley of the SDM program.
Chapter
1
: Introduction
Globalization has led to the development of emerging markets and economies. With emerging global economies, there is a greater demand for energy supply to sustain the economic growth. Increase in energy consumption from developed nations adds to it as well. Conventional Energy Technologies rely on majorly non-renewable energy resources to meet this energy demand. From a market standpoint, the primary energy market of the world can be classified as stationary and transportation markets. Stationary markets involve supplying energy to meet the demands of commercial, residential and industrial applications. Transportation market involves meeting the energy need of automobiles, buses and any other vehicles that involve transporting
humans or goods from one place to another.
1.1 Introduction Discussion Overview
With increasing energy demand and regulations on emissions, alternative energy technologies are gaining traction in the market place based on efficiency, reduced operating costs and emissions. Introduction Chapter focuses on building this case.
* Increasing Energy Demand and the supply pressure on non renewable resources * Conventional Energy Technology and inefficiencies in useful consumption of
resources.
* Increase in emissions and it's growing impact to environment and regulations * Opportunities for Alternative Energy Technologies and Distributed Generation * Fuel Cells Introduction and their traction in Alternative Energy Market.
1.1.1 Supply Pressure on Fuel Resources
A non-renewable energy resource is a natural resource that cannot be made, re-grown or regenerated on a scale comparative to its consumption. It exists in a fixed amount that is being renewed or is used up faster than it can be made by nature. Fossil Fuels (such as coal, petroleum and natural gas) and nuclear power are non-renewable resources.
From a fuel stand point Stationary Power market consumes all the three form of fossil Fuels: Solid (Coal), Liquid (Oil) and Gas (Natural Gas). However transportation market primarily consumes liquid and gaseous fuels based on efficiency and energy density. Fossil fuels generate considerable amount of energy by the process of combustion. Solid Fuels like coal are more abundant in nature, but they are lower in
heating value compared to liquid and gaseous fuels. That's the reason
transportation applications rely more on liquid fuels based on fuel storage and efficiency.
Figure 1.1.1-1 shows the growing energy demand and the pressure on fuel resources. Natural resources such as coal, oil, or natural gas, take millions of years to form naturally and cannot be replaced as fast as they are consumed. Eventually they will be used up. As the supply on the non renewables reduces, the pricing pressure will provide an opportunity for energy efficient and renewable solutions.
250 200 150 100 50 n Quadrillion Btu 1980 1995 2004 2015 2030
Figure 1.1.1-1 World Energy Demand and Resources Projections
Source: EIA International Energy Audit
Another critical issue with fossil fuels is emissions. Fossil fuels have high carbon content because their origin lies in the photosynthetic activity of plants millions of years ago. The fuels release this carbon back into the atmosphere as carbon dioxide during the process of combustion. The rate at which such fuels are being burnt is thus resulting in a rise in the concentration of carbon dioxide in the atmosphere, a primary cause of the green house effect.
1.2 Conventional Energy Models
In the stationary market segment, the dominant player is centralized power generation and distribution by the utility companies and in the transportation segment the dominant player is internal combustion engine and gasoline infrastructure.
1.2.1 Power Generation and Distribution - Current Energy Model
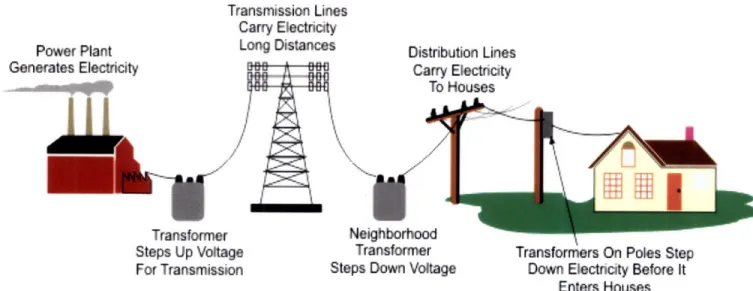
Today most of the electricity is delivered to us by the local utility through a network of existing transmission and distribution lines, often referred to as the "grid." Transmission lines are the large, high-voltage power lines that move electricity from power plants to sub-stations and are often supported by tall metal towers. Smaller, lower voltage distribution lines move power from substations and transformers, and are often seen along residential streets supported by wood poles. Most of the existing grid was built during a highly structured, highly regulated era designed to insure that everyone in the United States had reasonable access to electricity service. The utility customers, through fees authorized and regulated by State regulatory commissions, generally paid for developing and maintaining the grid. The utilities built power plants and connected the plants to the grid. Electricity generated at these plants is loaded onto the grid, where
it is transmitted and distributed to customers.
Power Plant Generates Electricity
1 1
Transmission Lines Carry Electricity
Long Distances Distribution Lines Carry Electricity To Houses Transformer Steps Up Voltage For Transmission Neighborhoc Transformer
Steps Down Voltage
Transformers On Poles Step Down Electricity Before It
Enters Houses Source: Energy Information Administration
Figure 1.2.1-1 Grid Utility Model - Stationary Power
Source: EIA, Annual Electricity Power Report
1.2.2 Issues with the Current Grid Model
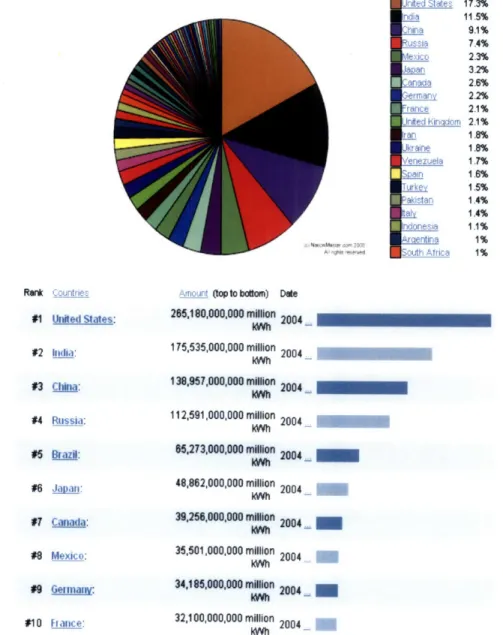
Centralized electricity generation and distribution heavily rely on power plants operating with coal, oil and natural gas. Most of these power plants are highly inefficient with less than 25-30% efficiency. Based on combustion process, most of the useful energy is lost as thermal energy in the thermodynamic process. More over it is estimated nearly 14% of the useful energy generated is lost due to transmission losses. Figure 1.2.2-1 shows the amount of energy loss due to transmission alone. Moreover, since the electric demand highly fluctuates during the day, more power is being distributed and lost to grounding.
The lesser the efficiency, higher the fuel required to produce the same power. Centralized Grid Model also has the higher risk of energy security in terms of an emergency in one plant, can put millions out of power.
Rank Countrie: Aroujrt (topto bottom) Date
#1 United States: 285,180,000,000 million 2004
#2 India: 175,535,000,000 million 2004 kWh #3 Cin: 138,957,000,000 million 2004 IWO #4 Russia: 112,591,000,000 million 2004 kWh #5 Brazil: 85,273,000,000 million 2004 kwh #6 Jai: 48,862,000,000 million kwh 2004 #7 Canada: 39,256,000,000 million 2004 kWh #8 Mexico: 35,501,000,000 million 2004 kWh #9 Gera: 34,185,000,000 million 2004 kWh #10 France: 32,100,000,000 million 2004 kWh
Figure 1.2.2-1 Grid Utility Model - World Transmission Losses
Source: Nation Master.com Energy Statistics
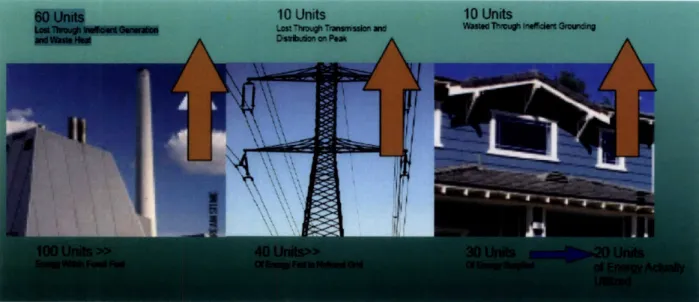
So the first step in meeting increased energy demand is energy conservation. On the other hand alternative energy technologies like Fuel cells, can operate at nearly 90% efficiency when all the thermal energy is also utilized based on the thermal needs of the building. Such applications are called combined heat and power applications, and provide very high efficiencies. Also with distributed power generation, the transmission losses can be avoided.
I~rz;m:3n Undited States 17.3% ndia 11.5% Thina 9.1% Russia 7.4% viexico 2.3% aa n 3.2% Canada 2.6% em 2.2% France 2.1% Jrned ;ircidom 2.1% ran 1.8% Ukraine 1.8% Venezuela 1.7% gain 1.6% Try 1.5% Pakistan 1.4% 1.4% Indonesia 1.1% Arcierdia 1% South Anfrica 1%
Figure 1.2.2-2 Grid Utility Model - Losses
Source: ferc.gov, cash back hybrid event notes
Major Issues with the current centralized distribution model can be summarized as follows:
1) Low Overall efficiency
2) Thermal Energy is not utilized
3) Transmission and Distribution losses. 4) Not Secured Power in case of emergencies
But still the grid prevails over the market based on cost and infrastructure. For nearly 100 years, we have invested heavily on establishing the grid architecture and maintenance. Due to strict regulations forced over this time, utility companies have been dominating the market as monopolies. But as explained above this conventional energy model has serious limitations to meet the growing energy demand and security.
1.2.3 Emissions and Transportation Applications
In transportation applications, internal combustion engines with favorable gasoline infrastructure dominate the market. For over 100 years, internal combustion engines have evolved, offering a highly reliable design in the market. However with rising fuel costs, efficiency becomes the key market factor.
i
11T
t
±z
Figure 1.2.3-1 C02 Emissions and Global Temperature Increase
Source: Nation Master.com Emission Statistics
Hybrid solutions with batteries are currently deployed to increase the fuel efficiency of automobiles. However one of the growing concerns with automobile industry is emissions. As explained, carbon fuels generate CO2 and increase the global temperature through green house effect. Figure 1.1.3-1 shows significant increase in CO2 emissions and global warming.
In the year 2002, nearly 476 Million vehicles were on the road and it is projected by 2050 3 Billion vehicles will be on the road. With this huge growth, it is mandatory
15
,,
emissions are kept under control. Taking this into account States like California are already mandating the introduction of Zero Emission vehicles and Fuel cell vehicles which run on hydrogen. Kyoto protocol adopted by major European and Asian nations is mandating that the emissions levels be reduced to that of levels maintained during 90's. That's nearly 29% cut in emissions compared to 2010 level. Such regulations and mandates are forcing Auto OEMS to develop alternative energy solutions.
1.3 Alternative Energy Market
As explained in the previous sections, conventional technologies have stronghold in terms of infrastructure, economics and reliability. Alternative energy companies have
an uphill battle to educate the customers and investors at the market place. From a customer point of view, alternative energy solutions come up with a higher price tag and steep upfront investment. From an investor point of view, development burden of alternative technologies makes the expenses more and not profitable at this point. Policies and Regulations are slowly gaining traction in the market place. Environmental awareness and sustainability initiatives are gaining attention to the customers. The market requires alternative energy companies to develop solutions that are not only innovative but also economical. More partnerships and associations are needed to share the development burden and to lobby for the development of policies and regulations to neutralize the existing cost and infrastructure advantage with conventional technologies.
1.3.1 Alternative Energy Segments and Technologies
Alternative Energy Market can be classified into two primary segments:
1) Stationary Power Segment 2) Transportation Power Segment
Stationary power segment comprises of residential and commercial power production and distribution. Transportation segment comprises of development of alternative energy technologies for transportation applications.
In stationary segment, a variety of prime mover technologies are developing. They are listed below:
* Fuel Cells * Micro turbines
* Reciprocating Engines
* Renewable Technologies like Solar, Geothermal, Hydro and Wind.
Primary Movers like Fuel Cells, Micro turbines and Reciprocating engines all operate primarily on natural gas for stationary applications. Even though they are non renewables, they offer combined heat and power solutions offering high efficiency in the range of 80-90%. Renewable Technologies like solar, geothermal, hydro and wind require a larger foot print and are limited to local areas due to energy resource availability. In transportation segment, hybrid vehicles with battery technology and Fuel cells are the potential alternative technologies that are being widely pursued.
The alternative energy technology focus of this thesis is "Fuel Cells". It is an environment friendly, high efficiency energy conversion technology for producing electricity from fuel using an electrochemical process. This domain is worthy of focus because of its positive impact on global energy conservation, environment and its potential to cause a paradigm shift towards modularized power plants and automobiles. The Fuel Cells technology has risen from the sidelines of the market and has all signs of being a true disruptive technology once it is adopted by the mainstream market.
1.4 Fuel Cells Historical Perspective
In 1839, the first fuel cell was conceived by Sir William Robert Grove, a Welsh judge, inventor and physicist. He mixed hydrogen and oxygen in the presence of an electrolyte, and produced electricity and water. The invention, which later came to be known as a fuel cell, didn't produce enough electricity to be useful. In the 1920s, fuel cell research in Germany paved the way to the development of the carbonate cycle and solid oxide fuel cells of today.
In 1932, engineer Francis T Bacon began his vital research into fuels cells. Early cell designers used porous platinum electrodes and sulfuric acid as the electrolyte bath. Using platinum was expansive and using sulfuric acid was corrosive. Bacon improved on the expensive platinum catalysts with a hydrogen and oxygen cell using a less corrosive alkaline electrolyte and inexpensive nickel electrodes.
It took Bacon until 1959 to perfect his design, when he demonstrated a five-kilowatt fuel cell that could power a welding machine. In October of 1959, Harry Karl Ihrig, an
engineer for the Allis - Chalmers Manufacturing Company, demonstrated a 20-horsepower tractor that was the first vehicle ever powered by a fuel cell.
During the early 1960s, General Electric produced the fuel-cell based electrical power system for NASA's Gemini and Apollo space capsules. General Electric used the principles found in the "Bacon Cell" as the basis of its design. Today, the Space Shuttle's electricity is provided by fuel cells produced by UTC Power, and the same fuel cells provide drinking water for the crew.
NASA decided that using nuclear reactors was too high a risk, and using batteries or
solar power was too bulky to use in space vehicles. Gasoline engines have emission issues. Compared to the alternatives, fuel cells offered high power density and also provided water as the only byproduct. The water produced by the Fuel cells provided drinking water for the space crew and hence reduced the pay load as well. NASA has funded more than 200 research contracts exploring fuel-cell technology, bringing the technology to a level now viable for the private sector. The first bus powered by a fuel cell was completed in 1993, and several fuel-cell cars are now being built in Europe and in the United States. Daimler Benz and Toyota launched prototype fuel-cell powered cars in 1997.
1.4.1 Traction in Fuel Cell Industry
Fuel cells have been around for over 150 years and offer a source of energy that is electrically efficient and environmentally safe. The reason which limited the wide commercial deployment of the technology has been the upfront product cost. The cells were too expansive to make. Fuel cells developed for the space program in the 1960s and 1970s were extremely expensive ($600,000/kW) and impractical for terrestrial power applications. Today, the most widely deployed fuel cells cost about $4,500 per kilowatt; by contrast, a diesel generator costs $1,500 per kilowatt, and a natural gas turbine can be even less. Many of us may not realize, there are five competing technologies within fuel cell Industry. They are the
1) Alkaline based Technology (Used in Space Shuttles) 2) Phosphoric Acid Technology (Stationary Applications)
3) Polymer Electrolyte Membrane (PEM) Technology (Transportation) 4) Molten Carbonate (Stationary Applications)
5) Solid Oxide Technology (Stationary Applications).
Within each technology there are major and minor technical hurdles and opportunities. For e.g. Solid Oxide Fuel Cells operate at high temperature (600 C), so the development of exotic materials to handle that temperature is a key technical challenge. Similarly in PEM and Molten Carbonate Fuel cell applications durability seems to the biggest challenge. During the past three decades, significant efforts have been made to develop more practical and affordable designs for stationary power applications. Phosphoric Acid Fuel Cell systems are gaining traction in the market place with Combined Heat and Power Solutions (CHP). To compete with incumbent technologies
that are both widely accepted and constantly improved, the fuel cell industry needs to be value focused. As the energy market is expanding. Fuel cell technology players should identify key market areas and strategically position themselves to stay in for the long haul.
1.5 Thesis Context
In order to explain how alternative energy companies especially Fuel Cells can strategically position themselves, the thesis is divided into the four chapters:
1) Value Creation: This chapter involves parameterizing the technology and
identifies what creates value to the customers. Energy Sustainability, Efficiency, Responsibility and Reliability are discussed as factors that can be leveraged as values to develop a market.
2) Value Capture: In this section, competitive strategies to capture value are discussed. This would involve developing an appropriate entry strategy based on market and technology risks and how to position the company to adapt towards market requirements and opportunities.
3) Value Delivery: In this chapter, discussion is focused on how to decouple
technology and product development efforts and how to increase the financial credibility by reducing uncertainty in development.
4) Value Integration: This chapter discusses strategic orientation and value chain integration for alternative technology companies. This would involve integrating value across development and fulfillment supply chains to develop a lasting competitive edge in the market place.
Chapter 2.0: Value
Identification
(Parameterizing the
Technology Solutions)
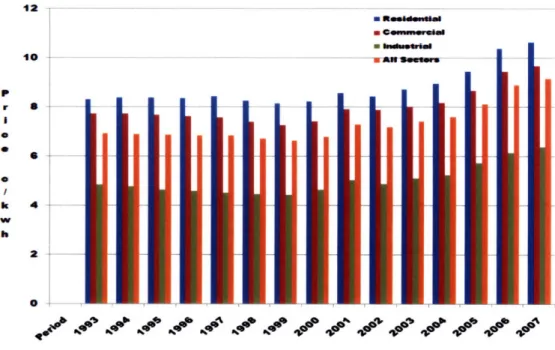
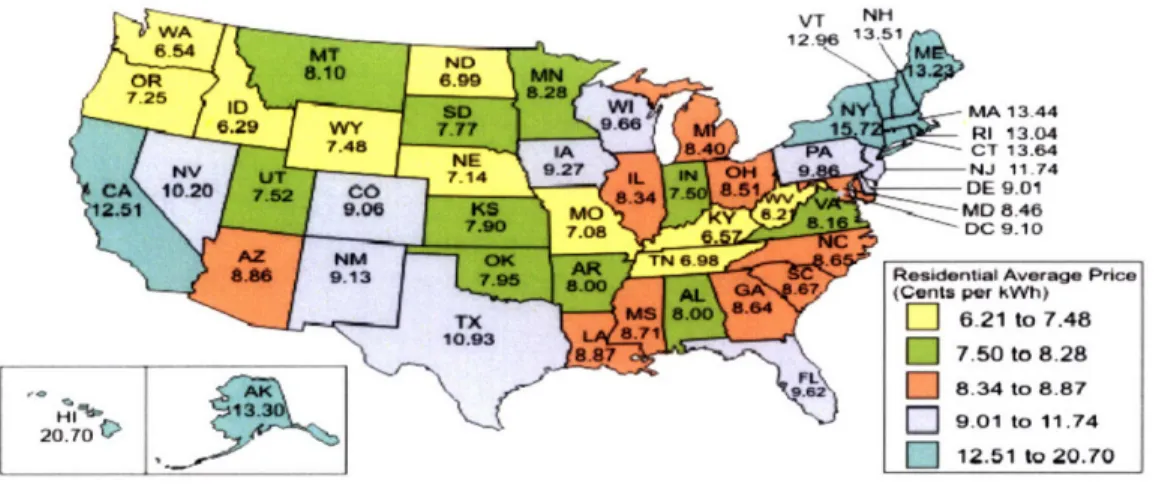
Conventional energy delivery methods like utilities currently dominate the energy market. This is because they offer no upfront investment since the grid is readily available in most locations. And customers only need to pay for electricity as they consume it. However with increasing energy prices, average electricity prices are on the rise across all sectors ranging from 6 cents per kWh to 20 cents per kWh. Electricity prices also vary across the US as indicated in Fig2-1 with California and North east being more expensive. Price premium of electricity also increases when consumed during peak hours of utility.
10 a r S I 0 k 4 w h 2 04 - R-- -d--- nm m- eusem m* Aee
Figure 2-1 Cost of Electricity depending on sectors
-. Li,"12-51 to 20.70
Source: Energy Information Admirwtration, Form EIAL-861, "Annuel Electric Power industry Report.
Figure 2-2 Electric Utility Prices across US states (cents /kWh)
Source: Energy Information Administration
Since utilities have no upfront installation cost, the only cost to the consumer is the price they pay per consumption. With alternative energy technologies there is upfront
installation cost. At the same time, they operate more efficiently and reduce operating cost with less consumption of fuel.
2.1 Alternative Energy Technologies Value Proposition with
respect to Grid
Alternative Energy companies compete with Utility Companies offering two different value propositions. One is with the Combined Heat and Power (CHP) solutions and the other is under the Renewables solution. Combined Heat and Power solutions results in higher energy efficiency and less fuel consumption while Renewable Solutions promote energy independency by depending on renewable energy sources like solar, geothermal and wind.
I SMA 13.44 RI 13.04 CT 13.64 NJ 11 74 DE 9.01 MD 8.46 DC 9.10
Residential Average Price (Cents per kWh)
MI 621 to 7.48
l 7.50 to 8.28 8.34 to 8.87 9.01 to 11.74
It is of interest to note that for large metro cities with like New York, Philadelphia, San Francisco, Chicago, Boston, Washington, some parts of Northern Europe and in Japan are excellent candidates for CHP solutions provided by utilities. In these cities, utilities do and have the means to provide CHP solutions, by transferring the waste heat from the power plants for domestic hot water applications. But with such CHP applications, thermal losses are high and require close network and heavy insulation to transfer the heat effectively.
This model is not economical to be applied in sparsely populated cities as well for satisfying the cooling needs of domestic and commercial applications. Most commercial absorption chillers and chilling equipments do require a high grade heat or higher supply temperature for their operation. CHP applications with distributed generation technologies cater well to this market by providing the required supply temperature based on minimizing the losses and by following the thermal load of the commercial applications.
Primary Value Proposition with respect to the Grid:
1) Combined Heat and Power Solutions. - Energy Efficiency.
2) Renewable Solutions - Energy Independency from Fossil Fuels
Prime movers like Fuel Cells, Micro turbines and Reciprocating engines all operate primarily on natural gas for stationary applications. They offer combined heat and power solutions offering high efficiency in the range of 80-90%. Renewable energy solutions offer the promising way of energy independency but their key limitations are energy
resource availability and high foot print requirement. When Fuel Cells operate on hydrogen or bio-fuel, they can be redeemed under the renewable category. But most of the Fuel cell applications in the stationary market are based on natural gas. Even when Fuel Cells operate on H2, the hydrogen is reformed from natural gas and hence it is classified under Non-Renewable category for stationary applications.
Different energy solutions within renewables and non-renewables offer different value propositions with respect to key parameters.
2.2 Parameterizing the Technology Solutions
In order to effectively understand the value proposition, it is critical that all the applicable energy technologies are parameterized and compared with respect to key parameters. It is important for technology companies to do this exercise to understand the niches that particular technology offers in the market place.
The key parameters that determines value proposition in alternative energy companies are listed below:
* Cost of Generation/Electricity
* Renewable/Non Renewable Solutions and Incentives * Combined Heat and Power Solutions and Incentives * Energy Resource Availability
* Foot Print Requirement * Emissions
With respect to these key parameters, all the different solutions are listed and compared in this section. The first primary classification is Renewable and Non-Renewable Solutions. While Non renewable solutions offer no emissions and energy independency they do require a larger foot print and are limited to local areas due to energy resource availability.
Clsiicto No o
-P im r 3.e -e abe .0 -n- e abe .6- - .6
Prime Movers f dLi4 im ea awss Installed Price ($SkW) Utilities-Monolpoly Pa~mvemi~mI Fuel Cells/ Microturbines, Recip Engines Commercial I Solar, Wind, Hydro Commercial I Low- 20%
Electrical Eff. (%) net value 40% Na
Overall Ef. % under 20% 85%value
Overall Ef.()
under
20%
85%
Na
Cost of generation (centslKwh) Emissions vs. CARB 07 8120 10130 ++ Fuel Capability Assured Power
Combined Heat & Power Energy Resource Availability Foot Print Requirement Na NO Available except NG, H2, Bio Yes Solar, Wind, Hdro No Available Medium
Figure 2.2-1 Qualitative comparison of Renewable and Non Renewable Solutions
26
i
Figure 2.2-1 characterizes the non-renewable and renewable alternative energy solutions and identifies the gaps and opportunity areas. In Figure 2.2-1 green indicates a unique advantage over other solutions, yellow indicates a slight advantage and red indicates a clear dis-advantage.
2.2.1 Cost of Electricity with Alternative Energy Solutions
The cost of electricity (COE) is comprised of three components: capital and installation
(C&I), operation and maintenance (O&M), and fuel (F). The total cost of electricity from a is the sum of these three components, expressed in dollars (or cents) per kilowatt-hour:
Total COE ($/kWh)= C&I + O&MV+ F
The breakdown of the three components will vary with the size and type of equipment. However, Figure 2.2.1-1 below provides an example of the breakdown for a natural gas combustion turbine. As illustrated, the fuel component is typically the largest portion of the cost of electricity in a system that utilizes fuel.
Figure 2.2.1-1 Cost of Generation
Source: energy.ca.gov on distributed generation
The capital cost component varies based on the capital and installation costs, as well as on the fixed charge rate and capacity factor of the system. The cost of electricity decreases as the amortization period of the device increases (e.g., as the fixed charge rate decreases). Distributed Energy systems with high capacity factors (i.e., base load units) also have a lower cost of electricity. The operation and maintenance cost component takes into account both the fixed and variable O&M costs of the technology. The fuel cost component is simply the cost of the fuel required to generate electricity with the device. The fuel cost component varies with the efficiency (or heat rate) of the equipment and with the cost of fuel.
Renewables such as photovoltaic systems and wind turbines will not have a fuel cost component as no fuel is required. Cost of generation in such scenarios is dependent on installation and maintenance costs.
Cost of Electricity ($/kWh) Combustion Turbines 0 Capital & Installation m Operation & Maintenance m Fuel
2.2.2 Installed Price
Utility companies do enjoy a clear advantage here with no upfront investment. On the other hand alternative energy companies do require upfront investment. One of the business models by which alternate companies compete here is to offer a reasonable payback period for the investment with lower operating costs.
2.2.3 Cost of Generation
It's interesting to note that with current technological innovations, alternative energy technologies are catching up on cost with utilities. However, the competing landscape is dependent on applications. If the building systems can effectively utilize all the energy provided by CHP solutions, both the power and thermal energy, then the cost of generation will be low. It also depends on the price premium for the electricity with the grid.
2.2.4 Emissions
With respect to emissions, renewables offer the best solution with zero emissions. Combined heat and power solutions offer low emissions. Most states provide incentives for renewables and CHP solutions, which is effectively applied to offset the cost difference.
2.2.5 Assured Power
For applications like Data centers, Hospitals and Banks, assured power is a critical requirement. Even a single power outage lasting seconds can cost millions in losses. For such applications, solutions like Fuel cells provide high value based on their reliability and availability.
2.2.6 Resource Limitation
Renewable solutions for CHP applications are limited in scope based on higher foot print requirement and resource availability. For e.g. geo-thermal applications require a hot water source and are limited to applications like Chena Hot springs in Alaska, where such a natural energy source is available. However Renewable power solutions can fit into the grid model and generate the power and transmit it utilizing the grid.
2.3 Non Renewable CHP Solutions
In the non-renewables CHP solutions, there are multiple competing technologies like Fuel Cells, Micro turbines and Reciprocating engines are available. Within Fuel cells, different technologies like Phosphoric Acid Fuel Cells, Molten Carbonate and Solid Oxide Technology are currently offered in the market place for stationary applications. Alkaline and PEM Technology are not widely applied in CHP solutions based on cost, durability and operating temperature.
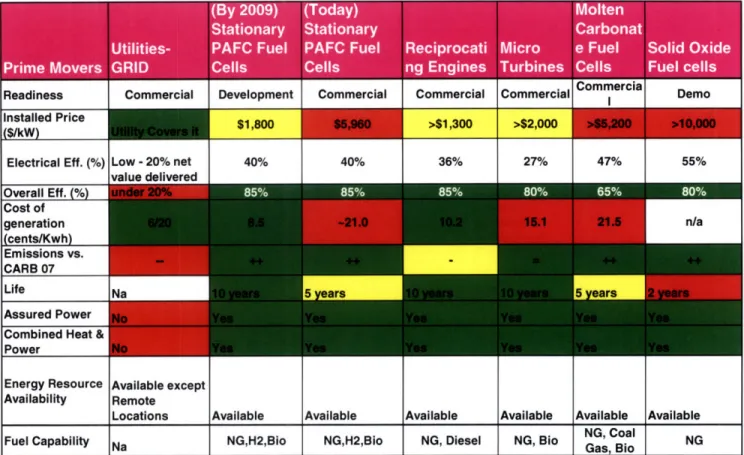
Figure 2.3-1 lists the qualitative comparative analysis of Non Renewable CHP solutions. While some of these solutions can operate on hydrogen, they are still non-renewable solutions, because these applications are currently very limited in numbers and also the hydrogen is produced mostly by reforming hydrocarbons.
U s Fe Fe 6 M r e Fe Si O Readiness Commercial Development Commercial Commercial Commercial Demo
Installed Price $180>1,300 >$2,000
($/kW)
Electrical Eff. (%) Low - 20% net 40% 40% 36%00 C 27% 47% 55%
Ivalue deliveredII Overall Eff. % : '. : 65%. * ". , -,% Cost of generation n/a
Scents/Kwh
Emissions vs. CARB 07Life
Na 5
years
Assured Power Combined Hieat & Power Energy Resource Availability Fuel Capability Available except Remote Locations NaFigure 2.3-1 Qualitative comparison of Non Renewable CHP Solutions
2.3.1 Cost of Generation
Reciprocating engines and micro turbines solutions currently offer better cost of generation value than Fuel cell solutions. However the current technology development in Phosphoric Acid Fuel cells make them equally competitive with incumbent technologies. These technologies are catching up with grid and under some applications offer better value proposition than the grid.
Available NG,H2,Bio Available NG,H2,Bio Available NG, Diesel Available NG, Bio Available NG, Coal Gas, Bio Available NGNG Na
2.3.2 Emissions and Life
Fuel cells solutions offer the best value here because reciprocating engines have higher emissions than electro chemical solutions. Durability of Fuel cells has been a key factor so far. But however now the technology is mature enough to offer durable products with
10 year life expectations.
2.3.3 Assured Power and CHP credits
Non renewable CHP solutions do provide assured power and receive incentives for CHP and distributed energy generation.
It is interesting to note that from the following discussion that alternative energy technologies offer value with respect to different parameters in the market place. The key is the right application and Niche Fit. For customers with Assured Power requirement, non renewable energy solutions like Fuel cells offer more value. For applications in Nevada, where there is plenty of Sun light, renewable solutions like Solar offers most value. In all cases, it's key to identify and understand the Niche benefits in the market.
2.4 Value Identification
Continuing with the discussion of Value identification, it's important for alternative energy companies to understand the landscape of competition and think towards
maximizing the parameters that provides or enhances their value proposition.
Value Identification
Parameters that Contribute Towards a Sale Energy Efficiency - High Energy Efficiency in Combined Heat & Power Applications.
Energy Reliability -key factor in space shuttles. Aging Grid is Unreliable. Distributed Generation Technologies Offer higher reliability.
Fnergy •P1 urity - %ocured Pnw.r aoainst Grid
Outages. Natural disasters like Katrina} Energy Responsibility 8. Sustainability -Reduce Carbon Foot Print. (Government
Mandateo with CARB restriction, Zero Emisocion
vehicles. EU and Kyoto Protocol). Green Image
and Incentives
Threat*
1) Nuclear Power-Asian Economies are moving towards it. Disruptive Forces to strengthen Utility Grid Model
2) Renewable Portfolio- Silicon based Companies Investing heavily on Renewable (Solar)
Barriers to Entry
1) Product Cost - High Upfront Investment for Customer 2) Development Cost- Product and Technology development cost burden on Investor
3) Infrastructure Development-Established Grid (Utilities). Gasoline Fuel Infrastructure (Natural Gas Lines
(Stationary). Hydrogen Infrastructure on Transportation sector)
4) Well Established Powerful Monopolies with Standards-Utilities on Distributed Power and Auto OEMs on
Transportation
5) Product and Technology Maturity and Fit to the application
lT Off Points
1) Right Application and RIght Product - Tapping on Higher Efficiency. Lower Operating Costs. Reliability Needs. Public
Image (Establishing National Accounts)
2) Developing Novel Systems and Applications - (Solar +
Fuel Cell - Complete Renewable Technology, Chevron.
Chena Hot Springs. Electrical Power from Geo Thermal Energy - UTC)
3) Developing a Durable product and Financing to Offset upfront Cost Burden.
4) Partnerships - Developing Partnerships with Utilities
Figure 2.4-1 Value Identification for Alternative Energy Solutions
From figure 2.4-1, the following parameters provide key opportunities for alternative technology solutions.
2.4.1 Opportunities
1) Energy Efficiency - High Energy Efficiency with Combined Heat & Power Applications. Total system efficiency exceeds 80% based on utilizing thermal energy from the system as well as towards the heating and chilling loads of commercial applications.
2) Energy Reliability and Security - This is a key factor which promoted fuel cells in space shuttles. Recent black outs during Katrina have indicated that aging grid is unreliable (Reference 30). For applications like banks, data centers and hospitals requiring assured power, alternative energy solutions offer high value. It is also important to note that during national emergencies like Katrina, it's important to have shelters like schools, hospitals equipped with assured power.
3) Energy Responsibility & Sustainability - Need to reduce emissions and Carbon Foot
Print. Increasing Government mandates and incentives provide a welcoming opportunity to promote alternative energy solutions. E.g. CARB restriction, Zero Emission vehicles,
EU and Kyoto Protocol.
While the opportunities are increasing, alternative energy companies shall also focus on their barrier to wide market entry and develop strategies to overcome market resistance.
2.4.2 Barriers to Entry
1) Product Cost - High Upfront Investment for the Customer. This can be offset with providing upfront financing for the customer.
2) Development Cost - Product and Technology Development Burden on Investor. Alternative technology companies shall adopt more lean development efforts and co-operative partnerships to offset the development cost.
3) Infrastructure Burden and Monopolies - Alternative energy companies shall develop
and promote standards to nullify the advantage enjoyed by utilities. Government incentives and mandates will also assist them towards competing more aggressively with the grid.
4) Product and Technology Maturity and Fit to the application - This is the single most key to success. With well fit applications, most of thermal and electric power will be consumed by the application to offer better cost of generation and can help to compete with grid readily.
2.4.3 Tip off Points
The key tip off point is the right application and right product. Right application involves novel system integration and right product involves a durable product for that application.
Developing novel systems and applications will pay a key role in opening up a niche market. For e.g., UTC Power developed geo thermal energy solutions for low return water temperature. This key novel system integration opened up niche applications with resorts and hotels suited near hot springs.
The key focus of alternative energy companies must be on developing a durable product. The higher the life of the product, the higher the returns on the investment. Higher durability provides them with an opportunity to enter into power purchase agreements with the customers completely eliminating the sticker shock with upfront investment. Instead of selling the equipment, as in the grid model customers can pay for the power as they consume it. Also it opens up the means, by which they can even sell the power to the grid during peak time at a premium.
Chapter 3.0 Value Capture Strategies
For Alternative Energy Technology Companies it becomes essential to have a focused entry and growth strategy in the market place. They need to be strategically positioned to compete with conventional technologies with favoring infrastructure. Ed Roberts and Charles Berry have described in Reference 3 different entry strategies in new business development. In essence alternative energy market presents a new business environment with key market risks and technology risks. There are different strategies a company can adopt to capture value under this scenario.
Some of the familiar options in new business development are listed below:
1) Internal Development
2) Acquisitions
3) Licensing
4) Joint Ventures Alliances
5) Venturing
A brief description on these options is listed below:
3.1 Internal Development
Internal development can involve two segments internal market development as well as internal product development. Internal Market developments involve utilizing internal resources and networks to compete and develop the market. Internal Product development involves developing the technology and product internally utilizing the organization's research and resources. The key issue with internal development in alternative energy market is the development effort. It is very difficult for companies to
bear the total development effort both at the product level and market level. Considering the risk on investment, companies are limited to focus their investment dollars in core areas of their expertise.
3.2 Acquisitions
Acquisitions offer a potential entry strategy with lower initial cost compared to internal development. But acquisitions do take time to deliver value. The parent company and the acquired company need to be aligned well with market and technology opportunities. In alternative energy sector, considering the limited development dollars, acquisition and deal activities are not very many. But however when the market conditions weather down, acquisition may provide an opportunity for consolidation.
3.3 Licensing
Licensing is another promising entry strategy. Without completely acquiring a company, licensing gives the edge to the OEM (Original Equipment Manufacturer) to practice the latest technology. Licensing is a great opportunity for alternative energy technology companies. It provides a clear incentive to invest in technologies and license it to prospective OEMs. On the other hand for the OEM's, they can focus more on market and product development rather than to invest heavily on technology development. The risk associated with licensing are more on vertical integration and limited balance of control. OEM's may want to have more control on their technologies before broad market deployment.
3.4
Joint Venture Alliances
Joint Ventures involve more commitment and involvement from partnering companies with a strategic intent. In alternative energy segment, joint ventures and partnerships are critical to succeed. For example in Combined Heat and Power Market, UTC Power incorporated has joint venture relationship with Capstone, micro turbines. Based on this relationship Capstone provides the micro turbines while UTC Power acts as the system integrator and sells them under UTC brand name. Joint Ventures of such nature are symbiotic to parent companies considering the market and development risks. However, there needs to be prolonged commitment and strategy needs to be in alignment for a joint venture to succeed. If one of the parenting companies wants to pull out of a joint venture based on their strategy change, it may put the entire venture into a tail spin.
3.5 Venturing
Venturing is another key strategy where corporations can play out in the energy market with minimal involvement. Venturing can also provide an insight into the dynamics involved at the market and technology level. For example, more Silicon Valley companies like Google are increasing their investment on alternative energy companies through ventures.
3.6
Development of Risk Matrix
Most of the companies in the alternative energy segment have vested interest on both the stationary and transportation power market. However they have to develop a value capture strategy that precisely fits their market and technology landscape.
To aid this discussion further, let us understand the elements of market and technology risk. Market risk gives a measure of market uncertainty and level of understanding, a company has on the market.
Market risk is considered as low when the company has stable presence and familiarity in the market. It also indicates the market is a mature market with companies having a defined share and control on it. For e.g., OTIS, Inc a subsidy of United Technologies is a pioneer in elevators production with nearly 50 plus years of global experience. When they compete on elevator market with new technology products, it is an example of low
market risk entity.
Market risk is termed moderate, when a company is expanding on its portfolio in a known market with a different product. For example, when UTC acquired Chubb, a building security and services company, the market risks can be termed moderate. This is because UTC already has an established presence on buildings market with their elevator and cooling products. Now with this move, UTC was building on to its services portfolio with Fire and Security. Fire and Security from a business standpoint may be new to UTC, but UTC has high familiarity with the buildings market and hence the risk can be termed as moderate.
Market risk is termed high, when a company has no or low familiarity with the market. Market risk is also termed high when a market is still developing and standards are not established yet. For example when Silicon Valley companies invest in alternative energy market, their market risks are high, because they have very low familiarity with the market and the market is still developing with no clear established market share or players or standards.
On the other hand, Technology Risks can be classified based on a company's exposure and familiarity with a new technology. Technology risk can be termed low when the technology is prior utilized in a company's products and offerings. For example when automotive companies work on development of internal combustion engines, their technology development risk is low but at the other hand when they work on Fuel Cells Technology for their engines, their risk level is high. This is because for most Auto OEM's like FORD, they have over decades of experience with internal combustion engines, but relatively much lower experience with Fuel Cell Technologies. More than that Auto OEM's major internal technical skills are on design and mechanical engineering based compared to the electro chemical technology expertise required with Fuel Cells. So when an organization has limited experience and has limited exposure to a given technology, it has a higher technical risk. It also has a higher technical risk, when the company's resources have limited exposure and familiarity with the technology.
As indicated earlier in this chapter, it becomes essential to map the market and technology risk to understand how a company is positioned in the market place. An appropriate entry strategy can be then developed based on this activity.
High
A
I
I
Market RiskLow
II
I
Low Low -,-.- m -- - High Technology RiskFigure 3.6-1 Risk Matrix
The risk matrix developed above characterizes market and technology risks into 9 zones. Each zone represents unique challenges and opportunities. This matrix
becomes important for companies to understand and evaluate themselves before investing their resources onto it.
I · · _
Based on the level of market and Technology risk, the entire matrix can be partitioned into three entities as shown in Figure 2.
* High Risk Zone
* Partnership and Strategic Zone * Organic Growth Zone
High Market Risk Low
A
I
I
I
I
I
I
I
Low - -"-"----""-""" - - High Technology Risk3.6.1 High Risk Zone
The three cubes in the top right as shown in figure 3.6.1-1 are characterized as High Risk Zones. These top there cubes are termed as high risk zones, because they have either a higher element of market risk or technology risk or both.
A
HighlI
I
I
I
Market RiskLOW
II
I
LoI Low • ,-, -. -m , ,. N High Technology RiskFigure 3.6.1-1 High Risk Zones
For Alternative energy companies, this is an area where they have to strictly avoid doing any internal development or large scale investment of their portfolios. This is because irrespective of market attractiveness, it is clear that the company has limited familiarity with the market and technology. In such cases, it is very difficult to build a sustainable business or stay in for the long haul. Without having a detailed strategy alternative energy companies should avoid pre-committing their resources or investments into such businesses.
One of the issues with alternative energy market is the "next wave of the future syndrome". When oil prices spike up more and more competing technologies start emerging. When this happens old established players with a certain technology are forced to jump into the new technology bandwagon for the fear of being left alone. The fear is also fueled by where the market is moving lately and not being left out from the key market players.
There is no clear indication which technology is going to emerge big in the future. In the stationary segment, alone there are different competing products and technologies. This would include fuel cells, photo voltaic devices, renewable including geo-thermal, reciprocating engines/ micro turbines with Combined Heat and Power solutions. Even for a company involved in Fuel Cells, there are different technology portfolio options including Phosphoric Acid Fuel Cells, Polymer Electrolyte Membrane, Molten Carbonate, Alkaline and Solid Oxide Fuel Cell Technologies. When a company is working on one technology and when it sees the major players move towards another technology or market, there is lot of fear and temptation to hedge their bets as well. In such scenarios the risk matrix listed above becomes more important to be considered. This is because even though the market moves in one direction, a company without accessing their resource capability and familiarity should not commit themselves out right into it.
Alternatively based on market attractiveness and diversification, if an established company wants to explore this avenue, they can make venture capital type of investments on to these businesses. Ed Roberts and Charles Berry recommend venture capitalist type investments to be a successful entry strategy on this zone based
on their close examination of multiple technology companies winning strategies. This strategy best works on these zones because the company is gaining valuable market and technology insight without major commitment or involvement.
3.6.2 Organic Growth Zone
The three cubes in the lower bottom can be termed as low risk zones or Organic Growth Zones. When a company is positioned in this zone, they can utilize the development dollars to strategically position themselves in the market. The investments can be through internal development or commitment of the company's work force and resources. The goal in this zone is to navigate towards the lower bottom, where both the market and technology risks are low. When the market risk is moderate, companies can heavily move on to internal market development.
High
A
I
I
Market RiskLow
II
I
LowLow i0-..--m i -- High
Technology Risk
Internal Market development can involve a combination of the following entities:
1) Hiring and developing a highly talented marketing and sales force. 2) Reaching markets by educating customers and forging relationships. 3) Make product awareness through advertisement.
4) Acquiring marketing agency or consultancy that has good customer relationships. 5) Developing partnerships with key players and forging national accounts and
sales channels.
As an example UTC Power a subsidy of UTC is developing Phosphoric Acid Stationary Power Plants for providing combined heat and power solutions to commercial buildings. They have over 20 years of experience with phosphoric Acid technology and can be termed as a base technology for them. Over the last few years the company heavily invested on developing a market force and their recent acquisition of Dome Tech, an energy consultancy group with strong customer relationship validates the above strategy of developing internal market development. By doing so they are heavily positioning themselves to achieve success in the market place.
On the other hand, when the technology risk is moderate, companies can invest into internal product development by initiating technology development and new product development activities. Most of the players in the alternative energy industries are actively spending and investing on new products and solutions. The key goal here is to achieve the required readiness level or product maturity such that the technology risks in terms of product durability, operability quality and cost can be termed as low.
3.6.3 Partnership and Strategic Zone
The three cubes that form the diagonal can be termed as partnerships and strategic zone as indicated in the figure below. When companies find themselves on this zone, they have good familiarity in either the market or technology or have moderate risks in both. High
A
I
I
Market RiskI
Low
II
I
Low Low i ---.- ý = High Technology RiskFigure 3.6.3-1 Partnership & Strategic Zones
Ed Roberts explains in his literature, the best entry strategy in such zones to be
acquisitions and joint ventures. This is true and a proven strategy in the alternative energy market especially in the transportation products. The relationship between Auto Makers and Fuel Cell technology companies fall in this zone. While Fuel cell companies have high technology familiarity they have low market familiarity. On the contrary, Auto OEMs have good understanding and control of transportation market but have very low
familiarity in the electro chemical technologies and processes applied in Fuel cells. The best business strategy that works well in such a scenario is joint ventures and licensing. For example, Ballard, Inc one of the key Fuel Cell Technology company has ongoing partnerships with American Auto OEM's like Ford and GM. But for joint ventures to work well there should be a high degree of commitment and trust involved in it. This is because Fuel cell companies will always be concerned about losing their Intellectual Property (IP) value to Auto OEMs. Joint ventures also have the risk when one company feels it is not of their strategic intent to stay long in the program. GM and Ford to alleviate some of the joint venture risks, have stock ownership in Ballard. Such an investment and commitment is required to make joint ventures work well.
Another strategy that works in such scenario is licensing. Licensing provides an opportunity and incentive for technology companies to develop a portfolio of technologies for their customers. The steady stream of revenues that can be generated through royalty fees can be funneled to develop further technology progress. On the other side, Licensing also provides Auto OEMs easy access to latest technologies without significant investment in terms of development cost and time. It has been proven again and again new technology and product development cost way much less in a strategic start up kind of company than on an established process company. So Auto OEMs can spend a fraction of the development cost and strategically invest it to obtain the at most value for their money. But the key limiting aspect of Licensing is that,
it will always make Auto OEMs rely on their fuel cell supplier for technology advances.
While these are some of the key entry strategies that can work well in this zone, companies shall determine the appropriate strategy that fits their focus and culture well.
3.7
Best Entry Strategy Mapping
Based on thebest optimum
discussion developed above the figure represented below represents the entry strategy for alternative energy companies.
A
I
I
High gI
I
I
I
Market Risk I II
I
I
I
I
LowI
Low Technology Risk High
Figure 3.7-1 Entry Stage Mapping
Source and Inspiration: Professor Ed Roberts Class Lectures (Ref 3)
In the high risk zone, companies shall consider limiting their involvement with venture type investments. In the strategic zone, energy companies shall explore strategic
partnerships to minimize their market or technology risks. However in the organic growth zone, they should actively utilize their internal resources to do base development. Alternative energy companies face large level of uncertainties in terms of market risk with established monopolies like utility companies. They also bear the huge