READ THESE TERMS AND CONDITIONS CAREFULLY BEFORE USING THIS WEBSITE.
https://nrc-publications.canada.ca/eng/copyright
Vous avez des questions? Nous pouvons vous aider. Pour communiquer directement avec un auteur, consultez la
première page de la revue dans laquelle son article a été publié afin de trouver ses coordonnées. Si vous n’arrivez pas à les repérer, communiquez avec nous à [email protected].
Questions? Contact the NRC Publications Archive team at
[email protected]. If you wish to email the authors directly, please see the first page of the publication for their contact information.
NRC Publications Archive
Archives des publications du CNRC
This publication could be one of several versions: author’s original, accepted manuscript or the publisher’s version. / La version de cette publication peut être l’une des suivantes : la version prépublication de l’auteur, la version acceptée du manuscrit ou la version de l’éditeur.
Access and use of this website and the material on it are subject to the Terms and Conditions set forth at
Consideration of reliability and performance of fire protection systems in FiRECAM<TM>
Yung, D. T.; Bénichou, N.
https://publications-cnrc.canada.ca/fra/droits
L’accès à ce site Web et l’utilisation de son contenu sont assujettis aux conditions présentées dans le site LISEZ CES CONDITIONS ATTENTIVEMENT AVANT D’UTILISER CE SITE WEB.
NRC Publications Record / Notice d'Archives des publications de CNRC:
https://nrc-publications.canada.ca/eng/view/object/?id=76dedab9-6066-49da-8148-3528b3c5dedd https://publications-cnrc.canada.ca/fra/voir/objet/?id=76dedab9-6066-49da-8148-3528b3c5dedd
Consideration of reliability and performance of fire protection systems in FiRECAM<TM>
Yung, D.; Bénichou, N.
NRCC-44001
A version of this document is published in / Une version de ce document se trouve dans :
InFIRE Conference 2000, Ottawa, May 9-12, 2000, pp. 1-11
CONSIDERATION OF RELIABILITY AND PERFORMANCE OF FIRE PROTECTION
SYSTEMS IN FiRECAM™∗
David Yung and Noureddine Benichou
Fire Risk Management Program Institute for Research in Construction National Research Council of Canada Ottawa, Canada K1A 0R6
ABSTRACT
Reliability and performance of fire protection systems in a building are important considerations in the new objective/performance-based code environment. An increased reliability and
performance would provide a higher level of life safety to the occupants. To help designers and building officials assess the impact of reliability and performance of fire protection systems, assessment tools are essential. In this paper, the computer fire risk-cost assessment model that is being developed at the National Research Council of Canada (NRC) is used to show, as an example, how the impact of reliability of fire alarms and automatic sprinklers on life safety in a building can be quantitatively assessed. The NRC model is called FiRECAM™ (Fire Risk Evaluation and Cost Assessment Model). FiRECAM™ evaluates the life risks to the occupants and fire costs as a result of all probable fires in a building and by simulating the dynamic
interaction of fire growth, smoke movement, occupant response and fire department intervention. These interactions are affected by the reliability of fire alarms and automatic sprinklers, as well as the performance of other fire protection systems that are installed.
KEYWORDS
Fire protection, life safety, reliability, alarms, sprinklers
INTRODUCTION
In an office or apartment building, statistics (Gaskin and Yung, 1993) show that there is a probability that fires will occur during the life of the building. Any fire in a building will pose not only a threat to the lives of the occupants in the building, but also potential damage to the building and its contents. The National Building Code of Canada (NBCC) requires that specific fire protection systems be installed in a building to provide a specified minimum level of safety to the occupants. These include passive fire protection systems, such as fire resistant
construction to minimize fire spread, as well as active fire protection systems, such as fire alarms, to warn occupants of fires occurring and automatic sprinklers to suppress fires.
The current NBCC (1995) is a prescriptive-based code that specifies fire protection systems required in a building but not the reliability required of these fire protection systems although the current National Fire Code of Canada (1995) does address it to a limited extent. With the
planned introduction of objective-based requirements in the NBCC and performance-based requirements in other countries, the new emphasis is to meet performance objectives rather than prescriptive requirements. In this new regulatory environment, it is expected that the
consideration of the impact on life safety of reliability and performance of fire protection systems would be included (National Fire Protection Association, 1999). A more reliable fire alarm system, or a more reliable automatic sprinkler system, is expected to provide a higher level of safety to the occupants in a building.
In this paper, the computer fire risk-cost assessment model, that is being developed at the
National Research Council of Canada (NRC), is used to show, as an example, how the impact of reliability of fire alarms and automatic sprinklers on life safety in a building can be
quantitatively assessed. The NRC model, called FiRECAM™ (Fire Risk Evaluation and Cost Assessment Model), assesses the expected risk to life to the occupants in a building, as a result of all probable fire scenarios over the design life of the building. The model consists of a number of submodels that simulate the dynamic interaction of fire growth, smoke movement, occupant response and fire department intervention. These interactions are affected by the reliability of fire alarms and automatic sprinklers, as well as by the performance of other fire protection systems that are installed. Although not included here, the model can also assess the fire protection costs (capital and maintenance costs) and expected fire losses.
A brief description of FiRECAM™ is given in this paper, including the modelling of fire alarms and automatic sprinklers. To demonstrate how the impact of reliability of fire alarms and sprinklers on life safety can be assessed, a typical 4-storey office building is used. The
architectural layout of the building and the characteristics of the occupants are described. The requirements of the NBCC relevant to this building, including alarms and sprinklers, are also described. The results of the assessment of the safety level provided to the occupants, dependent on various reliability values of the fire alarms and automatic sprinklers, are then shown and discussed. In a recent paper (Yung and Hadjisophocleous, 1997), preliminary results of this study were presented.
FiRECAM™
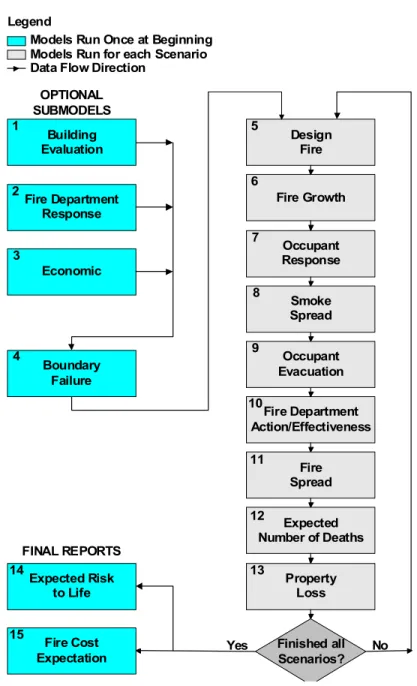
The modelling concept of FiRECAM™ is briefly described in this section. A more detailed description of FiRECAM™ is given previously by Yung et al (1999). A flowchart of FiRECAM™ is shown in Figure 1.
FiRECAM™ assesses the fire safety performance of a design in terms of two decision-making parameters: the expected risk to life (ERL) and the fire cost expectation (FCE). The ERL, which is defined as the expected number of deaths per year, is a quantitative measure of the risk to life from all probable fires in a building. The FCE is the expected total fire cost, which includes the capital cost of the passive and active fire protection systems, the maintenance cost
of the active fire protection systems and the expected losses during the design life of the building.
Economic Legend
Models Run Once at Beginning Models Run for each Scenario Data Flow Direction
Design Fire Building Evaluation Fire Department Response Fire Growth Fire Department Action/Effectiveness Boundary Failure Fire Spread Expected Number of Deaths OPTIONAL SUBMODELS Occupant Response Smoke Spread Occupant Evacuation Property Loss Finished all Scenarios? No Yes FINAL REPORTS Expected Risk to Life Fire Cost Expectation 1 2 3 4 5 6 14 15 7 8 9 10 11 13 12
Figure 1: FiRECAM™ flowchart
The separation of life risks and protection costs in FiRECAM™ avoids the difficulty of assigning a monetary value to human life and allows the comparison of risks and costs,
separately. The ERL value can be used for performance compliance (performance-based codes) or code equivalency consideration (prescriptive-based codes), whereas the FCE value can be used for cost-effectiveness considerations.
FiRECAM™ uses both statistical data and mathematical modelling to evaluate the ERL and FCE. Statistical data are used to predict the probability of occurrence of fire scenarios, such as the type of fire that may occur or the reliability of fire detectors. Mathematical models are used to predict the time-dependent development of fire scenarios, such as the development and spread of a fire and the evacuation of the occupants in a building. The calculated life hazard to the occupants from a scenario is based on the speed of the fire development and the speed of the evacuation of the occupants in that scenario. The life hazard from one scenario, multiplied by the probability of that scenario, gives the risk to life from that scenario. The overall expected risk to life to the occupants is the cumulative sum of all risks from all probable fire scenarios in a building. Similarly, the overall expected fire cost is the sum of fire protection costs (both capital and maintenance), and the cumulative sum of all fire losses from all probable fire scenarios in a building.
To calculate the ERL and FCE values, FiRECAM™ considers the dynamic interaction (time-dependent calculation) among fire growth, fire spread, smoke movement, human behaviour and fire department response. These calculations are performed by considering all probable fire scenarios that may occur in a building. The number of fire scenarios depends on a number of factors. These include the many types of fire that may occur in the compartment of fire origin, and the many compartments in the building where a fire may start. What follows is a brief description of the type of fires to be considered (design fires), the modelling of automatic sprinklers in design fires, the fire growth model and the modelling of fire alarms and occupant response. Other features of FiRECAM™ are described in previous publications by Yung et al (1999), Hadjisophocleous and Yung (1994), Proulx and Hadjisophocleous (1994), Hokugo et al (1994), Takeda and Yung (1992), and Hadjisophocleous and Yung (1992).
Design Fires and Automatic Sprinklers
FiRECAM™ uses six design fires in the compartment of fire origin for calculating fire and smoke spread in office buildings. The six design fires, representing a wide spectrum of possible fire types, are:
1. smouldering fire with the fire compartment entrance door open, 2. smouldering fire with the fire compartment entrance door closed,
3. flaming non-flashover fire with the fire compartment entrance door open, 4. flaming non-flashover fire with the fire compartment entrance door closed, 5. flashover fire with the fire compartment entrance door open,
6. flashover fire with the fire compartment entrance door closed.
The probability of occurrence of each design fire is based on statistical data. For example, in Canada, statistics show that the probability of fire starts in office buildings is 7.68 x 10⁻⁶ per m2 per year (Gaskin and Yung, 1993). Of these fires, 24% reach flashover and become
fully-developed fires, 54% are flaming fires that do not reach flashover and the remaining 22% are smouldering fires that do not reach the flaming stage (Gaskin and Yung, 1993).
If sprinklers are installed, the model assumes that some of the flashover and non-flashover fires, depending on the reliability and effectiveness of the sprinkler system, are rendered non-lethal as follows (Hadjisophocleous and Yung, 1994):
PDFSFL = PDFFL * (1 - Pr * Pe) (1)
PDFSNF = PDFNF * (1 - 0.25 * Pr * Pe) (2)
PDFSSM = PDFSM (3)
where PDFFL = probability of flashover fires,
PDFNF = probability of flaming non-flashover fires,
PDFSM = probability of smouldering fires,
PDFSFL = probability of flashover fires with sprinklers installed,
PDFSNF = probability of flaming non-flashover fires with sprinklers installed,
PDFSSM = probability of smouldering fires with sprinklers installed,
Pr = reliability of sprinkler activation when there is a fire
Pe = effectiveness of fire extinguishment after sprinkler activation.
The model also assumes that sprinklers have no effect on smouldering fires that generate very little heat, and therefore, do not activate sprinklers. In the above formulation, the values for both the reliability factor, Pr, and the effectiveness factor, Pe, are required. These values should be obtained from fire statistics. If such information is not available, the values could be assumed. For example, the values for the reliability factor, Pr, could be close to 1 if the system is properly maintained, or close to 0 if not. Similarly, the effectiveness factor, Pe, could be close to 1 if the system is properly designed and maintained, or close to 0 if not.
FiRECAM™ evaluates the cumulative effect of all probable fire scenarios that could occur in a building during the life of a building. For example, in an office building, a fire scenario is a design fire in any one of the office units in the building. The number of fire scenarios, therefore, is the product of the number of design fires and the number of office units in the building.
Fire Growth Model and Fire Alarms
The fire growth model predicts the development of the six design fires in the compartment of fire origin using representative fuels, such as polyurethane slabs for residential furniture and wood cribs for office furniture. Details of this model are described in a previous paper (Takeda and Yung, 1992). The model calculates the burning rate, room temperature and the production and concentration of toxic gases as a function of time. With these calculations, the model determines the time of occurrence of five important states: (1) time of fire cues (that can be detected by human senses), (2) time of smoke detector activation, (3) time of heat detector or sprinkler activation, (4) time of flashover, and (5) time of fire burnout. The model also calculates the
mass flow rate, the temperature and the concentrations of CO and CO2 in the hot gases leaving
the fire compartment. The output of the fire growth model is used by other submodels in FiRECAM™ to calculate the spread of smoke to other parts of the building, the response and evacuation of the occupants, as well as the response and effectiveness of the fire department.
In the Occupant Response Model (Proulx and Hadjisophocleous, 1994), the occupants are assumed to respond in the first three fire states, mentioned above, when a fire could be detected by fire cues, smoke or heat detectors. The probability that an occupant will respond and
evacuate depends on the following process of perception, interpretation and action:
P[Resp]i = P[Per]i * P[Int]i * P[Act]i (4)
where P[Resp]i = Probability of occupant to respond and to evacuate at state i of fire,
P[Per]i = Probability of perceiving a fire signal at state i of fire,
P[Int]i = Probability of interpreting this signal as a fire at state i of fire,
P[Act]i = Probability of taking action to evacuate at state i of fire.
In the above formulation, the fire signal could be: (1) fire cues detectable by human sensors, (2) warnings from other occupants, (3) warnings from firefighters, (4) alarm from local detectors, (5) central alarm and (6) central alarm with voice communication. The probability of
interpreting this signal as a fire signal depends on what that signal is - higher for direct
perception of a fire and lower if this is a central alarm bell. The probability of taking action to evacuate depends on the interpretation of the fire signal - higher for a more definite
interpretation and lower for a less definite interpretation that there is impending danger.
The model assumes that the probability of receiving alarms from local detectors or central alarms depends on the reliability of detectors and alarms. The probability could be close to 1 if the detectors and alarms are properly installed and maintained, or close to 0 if they are not.
Assumptions and limitations
In FiRECAM™, due to the complexity of fire phenomena and human behaviour, certain conservative assumptions and approximations are made in the mathematical modelling. In addition, not all aspects of the model have been fully verified by full-scale fire experiments or actual fire experience. Only some of the sub-models have been verified by experiments or statistical data (Beck et al, 1996, Yung and Ryan, 1996, Hokugo et al, 1994). As a result, the predictions made by the model, at the present time, can only be considered as conservative and approximate. Until the model is fully verified, the model should not be used for absolute assessment of life risks and protection costs. For comparative assessment of life risks and protection costs, and for the selection of cost-effective fire safety designs, the model is currently considered to be sufficient.
As in many computer models, the model uses certain input parameters to describe the
characteristics of various fire safety designs. These include the fire resistance rating of boundary elements, the reliability of alarms and sprinklers, the probability of doors being open or closed
and the response time of fire departments. The sensitivity of these parameters on the predicted risks has been checked and found to be reasonable (Hadjisophocleous and Yung, 1994).
FOUR-STOREY OFFICE BUILDING
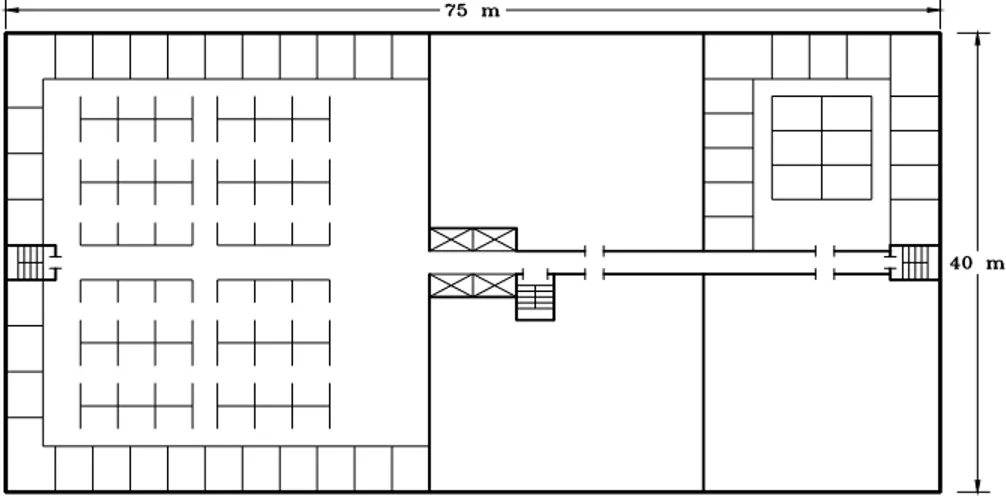
As an example to show how the impact of reliability of fire alarms and automatic sprinklers on life safety can be assessed, a large 4-storey, steel-framed, office building is considered. For this study, the building is assumed to be 75 m long by 40 m wide, with four elevators in the centre and two stairshafts at either end of the building. The conceptual layout of the floor plans is shown in Figure 2. The ground floor has a cafeteria, a lobby at the main entrance, and two side exits at the two stairshafts. The rest of the ground floor is divided into five company-sized spaces, each of which is suitable for the use of one professional company, such as a law office, an accounting firm or an insurance company. One of the spaces has been divided into smaller offices to show, as an example, how such a space could be utilized by a company. The second floor is divided into one large space and four company-sized spaces. The large space can be used by a company, such as a software development company that requires many workstations as well as enclosed offices. Since the door to the software company can be locked, a special
stairshaft near the elevators, that connects the second floor to the lobby on the ground floor, provides two means of egress for the occupants of the other four companies on the second floor. The third and fourth floors (not shown), are divided into eight company-sized spaces with a long corridor for access to both the elevators and the stairs. The basement is used for storage and mechanical equipment. Although not shown, the basement is assumed to have separate stairs for access to the lobby on the main floor as well as to the outside.
Since the building is a professional building, the occupants are mainly office workers, with the exception of a few restaurant workers in the cafeteria. If there are occupants on the upper floors whose mobility is impaired, they are assumed, in case of fire emergency, to wait on their floor to be rescued by the firefighters when they arrive. For those with other disabilities, they are
assumed to be guided to safety on the ground level by co-workers. The number of occupants per floor is assumed to be 150, or one occupant per 16 m2 usable space (assuming 80% of the total floor area is usable). Since the basement is used mainly for storage and therefore has very few workers, the total number of occupants in the building is 600.
Canadian Building Code Requirements
The current National Building Code of Canada (NBCC, 1995) requires that the building be constructed with a fire resistance rating of not less than 1 h. Every door in a fire separation is required to be equipped with a self-closing device, designed to return the door to the closed position in the event of a fire. Two exits are required, and must be located so that the travel distance to at least one exit is not more than 40 m. The present layout of the building meets this requirement. The building is required to have no more than one occupant per 9.3 m2 of usable space. The present occupant load of one occupant per 16 m2 of usable space meets this
requirement. The building is required to have a fire alarm system, although a voice communication system is not required. Manual pull stations are required near principal
entrances and exits. Smoke detectors are required in stairshafts. Fire detectors are required in storage areas and elevator shafts. No sprinkler protection is required for this building.
Second floor
Ground floor
Figure 2: Floor plans of 4-storey office building
IMPACT OF RELIABILITY OF ALARMS AND SPRINKLERS
FiRECAM™ was used to assess the expected risk to life (ERL, defined earlier) to the occupants for various values of the reliability of the fire alarms and automatic sprinklers. The effectiveness of the fire alarms depends on the interpretation of the signals by the occupants, as described in Eq. (5) and in a previous publication (Proulx and Hadjisophocleous, 1994). The effectiveness of
the automatic sprinklers, as described in Eqs. (1) and (2), is assumed to be 0.95 (95%) for this study.
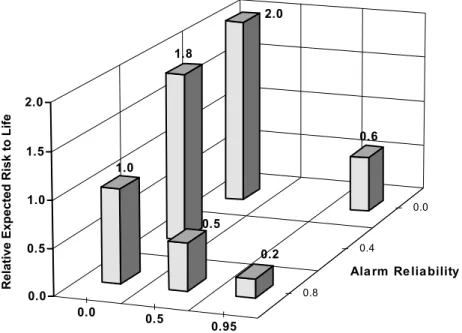
The results are shown in Figure 3, a three-dimensional plot, where the ERL values are compared with the Reference case for various reliability values of the fire alarms on one axis and sprinklers on the other. The Reference case is where the fire protection design complies with the
requirements of the 1995 NBCC. For this building, the NBCC requires the installation of fire alarms but not sprinklers. For this Reference case, the fire alarms are assumed to have a reliability of 0.8 (80%), based on statistics. Also for this reference case, the sprinklers are assumed to have a reliability of 0, which has the same effect as no sprinklers. In this figure, the ERL values have been normalized by that of the Reference case. Therefore, the Reference case has a relative ERL value of 1, as shown in the lower left hand corner of Figure 3.
0.0 0.5 0.95 0.8 0.4 0.0 2.0 0.6 1.8 1.0 0.5 0.2 0.0 0.5 1.0 1.5 2.0 Relative E x
pected Risk to Life
Sprinkle r Re lia bility
Ala rm Re lia bility
Figure 3: Relative expected risk to life for various reliability values of fire alarms and automatic sprinklers.
Figure 3 shows that, without sprinklers, the risk would increase to 1.8 times if the reliability of the alarms drops to 0.4 and would increase to 2.0 times if the alarms fail to work completely. If sprinklers are installed, in addition to the installation of fire alarms with a reliability of 0.8, Figure 3 shows that the risk would drop to a relative ERL value of 0.5 if the reliability of the sprinklers is 0.5 and would drop to a relative ERL value of 0.2 if the reliability of the sprinkler is 0.95. A two-dimensional relative ERL surface could be plotted using various reliability values
for the fire alarms and sprinklers. This allows the assessment of trade-offs of the reliability of alarms and sprinklers to provide a certain level of safety for the occupants.
SUMMARY
Reliability and performance of fire protection systems could have a significant impact on the life safety of occupants in a building. Evaluation tools that can assess the impact on life safety of reliability and performance of fire protection systems are needed. In this paper, FiRECAM™ was used to show how the impact of reliability of fire alarms and automatic sprinklers on life safety could be assessed. A 4-storey office building was used to demonstrate how the model works.
REFERENCES
Beck, V. R., Yung, D., He, Y. and Sumathipala, K. (1996). Experimental validation of a fire growth model. Interflam '96, Cambridge, England, March 26-28, 1996, 653-662.
Gaskin, J. and Yung, D. (1993). Canadian and U.S.A. fire statistics for use in the risk-cost assessment model, IRC Internal Report No. 637, National Research Council Canada, Ottawa, Canada, January 1993.
Hadjisophocleous, G.V. and Yung, D. (1994). Parametric study of the NRCC fire risk-cost assessment model for apartment and office buildings. Proceedings of the 4th International Symposium on Fire Safety Science, Ottawa, Canada, July 13-17, 1994, 829-840.
Hadjisophocleous, G.V. and Yung, D. (1992). A model for calculating the probabilities of smoke hazard from Fires in multi-storey buildings. J. of Fire Protection Engineering 4:2, 67-80.
Hokugo, A., Yung, D. and Hadjisophocleous, G.V. (1994). Experiments to validate the NRCC smoke movement model for fire risk-cost assessment. Proceedings of the 4th International Symposium on Fire Safety Science, Ottawa, Canada, July 13-17, 1994, 805-815.
National Building Code of Canada (1995). National Research Council of Canada, Ottawa, Canada.
National Fire Code of Canada (1995). National Research Council of Canada, Ottawa, Canada.
National Fire Protection Association Fall Meeting, New Orleans (1999). Session on Reliability in Performance-Based Codes and Standards (TO9).
Proulx, G. and Hadjisophocleous, G.V. (1994). Occupant response model: a sub-model for the NRCC risk-cost assessment model. Proceedings of the 4th International Symposium on Fire Safety Science, Ottawa, Canada, July 13-17, 1994, 841-852.
Takeda, H. and Yung, D. (1992). Simplified fire growth models for risk-cost assessment in apartment buildings. J. of Fire Protection Engineering 4:2, 53-66.
Yung, D. and Hadjisophocleous, G. V. (1997). Assessment of the impact of reliability of fire protection systems on life safety in buildings. Proceedings of the ESREL '97 International Conference on Safety and Reliability, Lisbon, Portugal, June 17-20, 1997, 1391-1398.
Yung, D., Hadjisophocleous, G. V., and Proulx, G. (1999). A description of the probabilistic and deterministic modeling used in FiRECAM. Int. J. on Engineering Performance-based Fire Codes 1:1, 18-26.
Yung, D. and Ryan, J. (1996). Full-scale fire tests to validate NRC's fire growth model - open office arrangement. IRC Internal Report No. 717, National Research Council Canada, Ottawa, Canada, June 1996.