Publisher’s version / Version de l'éditeur:
Vous avez des questions? Nous pouvons vous aider. Pour communiquer directement avec un auteur, consultez la première page de la revue dans laquelle son article a été publié afin de trouver ses coordonnées. Si vous n’arrivez pas à les repérer, communiquez avec nous à [email protected].
Questions? Contact the NRC Publications Archive team at
[email protected]. If you wish to email the authors directly, please see the first page of the publication for their contact information.
https://publications-cnrc.canada.ca/fra/droits
L’accès à ce site Web et l’utilisation de son contenu sont assujettis aux conditions présentées dans le site
LISEZ CES CONDITIONS ATTENTIVEMENT AVANT D’UTILISER CE SITE WEB.
Information Bulletin on Variable Stars, 63, 2020-03-07
READ THESE TERMS AND CONDITIONS CAREFULLY BEFORE USING THIS WEBSITE. https://nrc-publications.canada.ca/eng/copyright
NRC Publications Archive Record / Notice des Archives des publications du CNRC : https://nrc-publications.canada.ca/eng/view/object/?id=260ab4b5-aaac-42aa-bc7d-c8a0bdb97b9f https://publications-cnrc.canada.ca/fra/voir/objet/?id=260ab4b5-aaac-42aa-bc7d-c8a0bdb97b9f
Archives des publications du CNRC
This publication could be one of several versions: author’s original, accepted manuscript or the publisher’s version. / La version de cette publication peut être l’une des suivantes : la version prépublication de l’auteur, la version acceptée du manuscrit ou la version de l’éditeur.
For the publisher’s version, please access the DOI link below./ Pour consulter la version de l’éditeur, utilisez le lien DOI ci-dessous.
https://doi.org/10.22444/IBVS.6270
Access and use of this website and the material on it are subject to the Terms and Conditions set forth at
V1097 Her: a W-type overcontact eclipsing binary
Konkoly Observatory Budapest
3 June 2019
HU ISSN 0374 – 0676
V1097 Her – A W-TYPE OVERCONTACT ECLIPSING BINARY NELSON, ROBERT H.1,2; RUSSELL, ROBB3
1
Mountain Ash Observatory, 1393 Garvin Street, Prince George, BC, Canada, V2M 3Z1 email: [email protected]
2
Guest investigator, Dominion Astrophysical Observatory, Herzberg Institute of Astrophysics, National Re-search Council of Canada
3
Department of Physics and Astronomy, University of Victoria, Victoria, BC, Canada email: [email protected]
Abstract
V1097 Her, an overcontact (W-type) eclipsing binary, has a short period, a relatively low degree of contact (or fill-out parameter), and an increasing period. It has now been classified: for the more luminous star a spectral type of F8.5V±1 has been determined. B,V,Ic light curves and, for the first time, radial velocity curves for the overcontact binary V1097 Her have been obtained; these have been subjected to a Wilson-Devinney analysis, yielding fundamental parameters; in particular masses of 0.41 ± 0.01 and 1.11 ± 0.02 M⊙and luminosities of 0.77 ± 0.01 and 1.75 ± 0.03 L⊙respectively. The
distance estimate of r = 237 ± 11 pc is consistent with the Gaia value of r = 250.3 ± 1.4 pc (Bailer-Jones et al., 2018; Gaia Collaboration, 2018). A period analysis, again believed to be the first ever, has been undertaken, revealing a constant rate of period increase of dP/dt = (1.85 ± 0.11) × 10−7
d/yr.
As a by-product of the ROTSE all-sky survey (Akerlof et al., 2000), well over 1000 new periodic variables were discovered. One of these, V1097 Her (ROTSE1 J173327.94+265547.5, NSVS 8002361, TYC 2083-1870-1) was identified as a EW-type eclipsing binary with a period of 0.360819 d and an amplitude of 0.458 mag (clear filter). Follow-up CCD ob-servations for this system and three others were performed by B¨alttler and Diethelm (2002) who obtained new light curves and many new times of minima, one result of which was to refine the period for V1097 Her, obtaining P = 0.360847 d (no error estimate). Subsequently, there have been many new published eclipse timings.
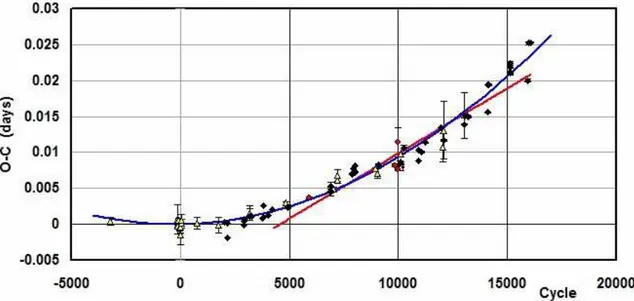
An eclipse timing difference (O–C) plot using all the timings from 1999 (earliest) to 2018 is depicted in Fig. 1. Although there is considerable scatter, a quadratic relation over the data collection interval (cycle 28800 to 30770 for the RVs and cycle –3205 to 16047 for the light curve data) was obtained; equation (1) below defines the weighted quadratic fit. (Note: in it, and throughout the paper, figures in brackets denote the error estimates in units of the last digit.)
JD (Hel)MinI = 2452463.4068(3) + 0.36084705(1)E + 8.4(5) × 10−11E2 (1)
A weighted linear least-squares fit for the data from cycle 6881 (2009) to cycle 15129 (2017) yielded the fit of equation (2), used in all phasing.
Figure 1. V1097 Her – eclipse timing (O-C) plot with the quadratic fit. Legend: (yellow-filled) triangles - visual, (red) circles - photoelectric, and (black) diamonds - CCD.
JD (Hel)MinI = 2458253.9395(10) + 0.3608488(1)E (2)
The Excel file (and many others) are available at Nelson (2017). The 5000+ files are updated annually. Further eclipse timings are recommended in order to detect, or alter-natively rule out a light time effect (LiTE).
There has been no light curve analysis for this system. In order to rectify this lack, the lead author first secured, in April of 2009, 2011, 2015, and 2016 and in September of 2017, a total of 14 medium resolution (R∼10000 on average) spectra of V1097 Her at the Dominion Astrophysical Observatory (DAO) in Victoria, British Columbia, Canada using the Cassegrain spectrograph attached to the 1.85 m Plaskett Telescope. He used the 21181 configuration with the 1800Yb grating (1800 lines/mm, blazed at 5000 ˚A), which gave a reciprocal linear dispersion of 10 ˚A/mm in the first order. The wavelengths ranged from 5000 to 5260 ˚A, approximately. A log of observations is given in Table 1.
Frame reduction was performed by software RaVeRe (Nelson 2013). See Nelson (2010a) and Nelson et al. (2014) for further details. The normalized spectra are reproduced in Fig. 2, sorted by phase. Note towards the right the strong neutral iron lines (at 5167.487 and 5171.595 ˚A) and the strong neutral magnesium triplet (at 5167.33, 5172.68, and 5183.61 ˚A).
Radial velocities were determined using the Rucinski broadening functions (Rucinski 2004, Nelson 2010a) as implemented in software Broad25 (Nelson 2013). See Nelson et al. (2014) for further details. An Excel worksheet with built-in macros (written by him) was used to do the necessary radial velocity conversions to geocentric and back to heliocentric values (Nelson 2014). The resulting RV determinations are also presented in Table 1. The mean rms errors for RV1 and RV2 are 8.5 and 7.8 km/s, respectively, and the overall rms deviation from the (sinusoidal) curves of best fit is 8.3 km/s. The best fit yielded the values K1 = 250.0(1.5) km/s, K2 = 87.1(1.5) km/s and Vγ = 14.9(1.0) km/s, and thus a
mass ratio qsp = K1/K2 = M2/M1 = 2.87(5).
Table 1: Log of DAO observations
DAO Mid Time Exposure Phase at V1 V2
Image # (HJD-2400000) (sec) mid-exp (km/s) (km/s) 09-5354 54927.0236 3378 0.302 –215.1 (8.2) 103.9 (8.6) 09-5396 54928.8629 3600 0.400 — 73.1 (8.1) 09-5425 54929.8849 3600 0.232 –228.1 (7.1) 97.0 (3.2) 11-2578 55670.8957 3600 0.756 258.0 (1.9) –56.6 (3.0) 11-2675 55674.8901 3600 0.826 225.9 (4.3) –76.2 (3.9) 15-3150 57121.8629 3600 0.746 270.7 (3.1) –74.9 (4.2) 16-1288 57493.9341 3600 0.847 245.1 (2.9) –65.1 (2.6) 16-1328 57495.9094 3600 0.321 –208.2 (3.3) 92.3 (2.0) 16-1358 57496.9657 3000 0.248 –237.5 (3.3) 91.3 (3.0) 17-4017 57859.9463 2500 0.158 –189.7 (1.0) 81.7 (0.2) 17-13704 57997.8196 2500 0.239 –233.8 (1.5) 99.1 (9.3) 17-15737 57998.6748 2500 0.609 — –32.9 (6.5) 17-15793 57999.8174 2500 0.775 274.5 (10.2) –71.6 (4.9) 17-15950 58008.8000 2500 0.668 217.8 (2.7) –67.9 (5.6)
Figure 2. V1097 Her spectra at phases 0.16, 0.23, 0.24, 0.25, 0.30, 0, 32, 0.40, 0.61, 0.67, 0.75, 0.76, 0.78, 0.83, 0.85 (from top to bottom)
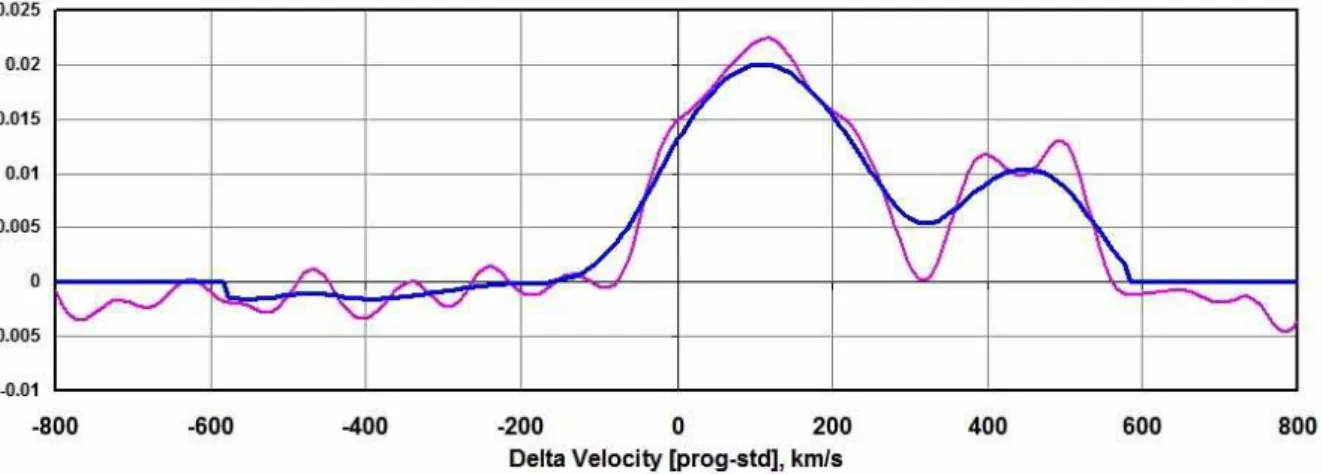
and 4, respectively. Smoothing by a Gaussian filter is routinely done in order to centroid the peak values for determining the radial velocities.
Figure 3. Broadening functions at phase 0.24–smoothed and unsmoothed.
Figure 4. Broadening functions at phase 0.78–smoothed and unsmoothed.
In June of 2011, and again in 2012, the lead author took a total of 87 frames in V, 88 in RC (Cousins) and 118 in the IC (Cousins) band at his private observatory in Prince
George, BC, Canada. The telescope was a 33 cm f/4.5 Newtonian on a Paramount ME mount; the cameras used were the SBIG ST-7XME and ST-10XME.
Standard reductions were then applied (see Nelson et al., 2014 for more details). The variable, comparison and check stars are listed in Table 2. The coordinates for V1097 Her, the comparison, and check stars (rounded to integral seconds) are from the Tycho Catalogue (Høg et al., 2000), the magnitudes are taken from the AAVSO Photometric All-Sky Survey (APASS, DR9)1 catalogue (Henden et al., 2012)
The 2003 version of the Wilson-Devinney (WD) light curve and radial velocity analysis program with Kurucz atmospheres (Wilson and Devinney, 1971; Wilson, 1990; Kallrath
1
Table 2: Details of variable, comparison and check stars.
Object GSC RA (J2000) Dec (J2000) V (mag) B − V (mag) Variable 2083-1870 17:33:28 +26:55:47 10.91 (6) 0.58 (10) Comparison 2083-1693 17:33:37 +26:58:38 10.33 (4) 0.05 (4)
Check 2083-2141 17:33:43 +26:47:56 10.07 (4) 1.49 (7)
and Milone; 1998, Wilson, 1998) as implemented in the Windows front-end software WDwint (Nelson 2013) was used to analyze the data.
For classification purposes, one of the authors (R.M.R.) took two low resolution spec-tra, on 2013 June 22 (HJD = 2456465.7981; mid exposure, UTC). He used the 1.85 m Plaskett telescope at the Dominion Astrophysical Observatory (DAO) in Victoria, British Columbia, Canada with the Cassegrain spectrograph in the 2131 configuration, resulting in a reciprocal dispersion of 60 ˚A/mm. The two spectra were very similar (see Fig. 5). The strength of the Calcium H&K lines, G-band, Hγ, Fe I 4384, Ca I 4227, and Hδ lines all indicated a F8.5V±1 spectral classification for V1097 Her.
Figure 5. Classification spectra for V1097 Her.
Interpolated tables from Flower (1996) gave a temperature T2 = 6191 ± 162 K and
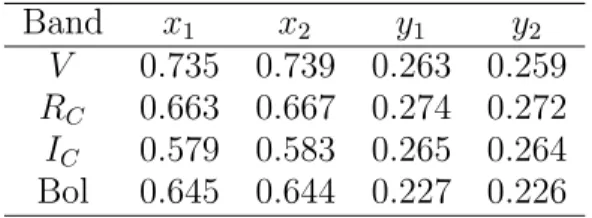
log g = 4.369 ± 0.006 (cgs). (The quoted errors refer to one and one half spectral sub-class.) An interpolation program by Terrell (1994, available from Nelson 2013) gave the Van Hamme (1993) limb darkening values; and finally, a logarithmic (LD=2) law for the limb darkening coefficients was selected, appropriate for temperatures < 8500 K (ibid.). The limb darkening coefficients are listed below in Table 3. (The values for the second star are based on the later-determined temperature of 6191 K and assumed spectral type of F8.) Convective envelopes for both stars were used, appropriate for cooler stars hence values gravity exponent g = 0.32 and albedo A = 0.5 were used for each (Lucy, 1967; Rucinski, 1969, respectively).
From the GCVS 4 designation (EW) and from the shape of the light curve, mode 3 (overcontact binary) was used. Later on, mode 2 (detached) was tried. but DC
adjust-Table 3: Limb darkening values from Van Hamme (1993) Band x1 x2 y1 y2 V 0.735 0.739 0.263 0.259 RC 0.663 0.667 0.274 0.272 IC 0.579 0.583 0.265 0.264 Bol 0.645 0.644 0.227 0.226
ments required decreases in potential 2 below the critical value, so mode 2 was abandoned. It was noted immediately that the curve heights at Max I (phase 0.25) and Max II (phase 0.75) were significantly different. This is the O‘Connell effect (Davidge & Milone, 1984, and references therein) and is usually explained by the presence of one or more star spots. Accordingly, one was added first to star 2, and this gave good results. (Moving the spot to star 1 gave poorer results and was abandoned.)
Convergence by the method of multiple subsets was reached in a small number of iterations. (The subsets were: (i, q, L1, R), (T2, Ω1), (i, R, Tf), and (i, Lng, R) where i
= inclination, q = mass ratio, L1 = luminosity (scale factor), Ω1 = potential, Lng = spot
longitude, R = spot radius, and Tf = temperature factor). Quantities a (semi-major axis), ϕ (phase correction), and Vγ (system centre of mass radial velocity) were uncorrelated
and therefore could be added to any subset for adjustment.
Detailed reflections were tried, with nref = 3, but there was little–if any–difference in the fit from the simple treatment. There are certain uncertainties in the process (see Csizmadia et al., 2013, Kurucz, 2002). On the other hand, the solution is very weakly dependent on the exact values used.
The model is presented in Table 4. For the most part, the error estimates are those provided by the WD routines and are known to be low; however, it is a common practice to quote these values and we do so here. Also, estimating the uncertainties in temperatures T1 and T2 is somewhat problematic. A common practice is to quote the temperature
difference over–say–one spectral sub-class. (the case here). In addition, various different calibrations have been made (Cox, 2000, page 388–390 and references therein, and Flower, 1996), and the variations between the various calibrations can be significant. If the classification is ± one sub-class, an uncertainty of ± 150 K to the absolute temperatures of each, would be typical. The modelling error in temperature T2, relative to T1, is
indicated by the WD output to be much smaller, around 3 K (and is clearly much too low).
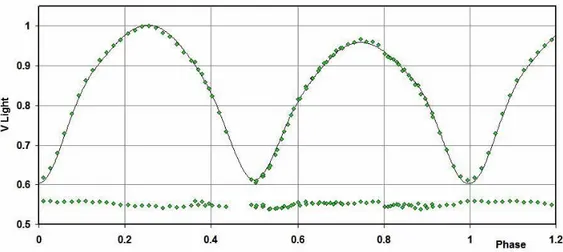
The light curve data and the fitted curves are depicted in Figures 6–8. The residuals (in the sense observed-calculated) are also plotted, shifted upwards by 0.55 units.
The Radial Velocities are shown in Fig. 9. A three-dimensional representation from Binary Maker 3 (Bradstreet, 1993) is shown in Fig. 10 and one for the potentials, in Fig. 11.
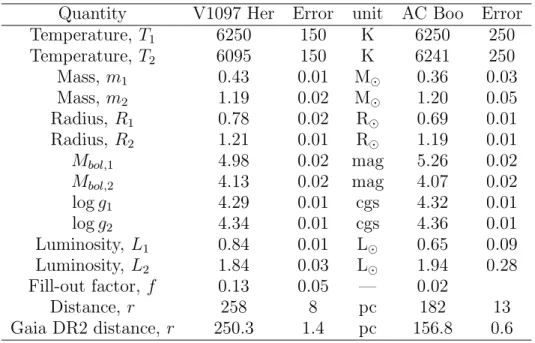
The WD output fundamental parameters and errors are listed in Table 5. To save space, those for a similar system, AC Boo (Nelson 2010b), are listed here in column 5-6 and discussed later. Most of the errors are output or derived estimates from the WD routines. From Kallrath & Milone (1998, see also Mochnacki 1981), the fill-out factor is f = (ΩI − Ω)/(ΩI − ΩO), where Ω is the modified Kopal potential of the system, ΩI is
Figure 6. V Light Curves for V1097 Her – Data, WD fit, and residuals.
Figure 7. RLight Curves for V1097 Her – Data, WD fit, and residuals.
Table 4: Wilson-Devinney parameters WD Quantity Value error Unit Temperature, T1 6250 3 K
Temperature, T2 6095 [fixed] K
q = m2/m1 2.74 0.05 —
Potential, Ω1 = Ω2 6.115 0.007 —
Inclination, i 76.9 0.1 degrees Semi-maj. axis, a 2.50 0.04 solar radii
Vγ 13.4 1.7 km/s Phase shift -0.0030 0.0002 — Fill-out, f1 0.13 0.05 L1/(L1+ L2) (V ) 0.312 0.001 — L1/(L1+ L2) (RC) 0.309 0.001 — L1/(L1+ L2) (IC) 0.305 0.001 —
r1 (pole) 0.2870 0.0009 orbital radii
r1 (side) 0.3008 0.0011 orbital radii
r1 (back) 0.3425 0.0020 orbital radii
r2 (pole) 0.4507 0.0006 orbital radii
r2 (side) 0.4849 0.0008 orbital radii
r2 (back) 0.5152 0.0011 orbital radii
Spot co-latitude 59 10 degrees Spot longitude 280 3 degrees Spot radius 21.3 0.5 degrees Spot temp. factor 0.873 0.002 —
Σω2
res 0.0285 — —
Figure 9. Radial velocity curves for V1097 Her – Data and WD Fit. The primary is represented by (black) diamonds; the secondary, by (purple) squares.
that of the inner Lagrangian surface, and ΩO, that of the outer Lagrangian surface, was
also calculated. In the case of the masses (and mass ratio elsewhere), errors were assigned on the basis of a detailed analysis of errors in the radial velocities (and derived quantities thereof). See Nelson (2015a) for an explanation of the method.
Figure 10. Binary Maker 3 representation of the system – at phases 0.25 and 0.50.
Figure 11. Binary Maker 3 representation of the potentials showing the relatively low degree of contact.
To determine the distance r in column 2, the analysis proceeded as follows: First the WD routine gave the absolute bolometric magnitudes of each component; these were then converted to the absolute visual (V ) magnitudes of both, MV, 1 and MV,2, by adding the
bolometric corrections BC = –0.060 (15) and –0.075 (15) for stars 1 and 2 respectively. The latter were taken from interpolated tables constructed from Cox (2000). The absolute magnitude was then computed in the usual way for adding magnitudes getting MV =
3.79 ± 0.04 mag. The apparent magnitude in the V passband was V = 10.91 ± 0.055, taken from the APASS Catalogue (Henden et al. 2009, 2010, 2012; Smith et al., 2010).
Ignoring interstellar absorption (i.e., setting AV = 0), we calculated a preliminary
value for the distance r = 265 pc from the standard relation: r = 100.2(V −MV−AV+5)
pc (3)
Galactic extinction was obtained from a model by Amˆores & L´epine (2005). The simple code extin (in IDL) assumes that the interstellar dust is well mixed with the dust, that the galaxy is axisymmetric, that the gas density in the disk is a function of the Galactic radius
Table 5: Fundamental parameters of V1097 Her and AC Boo.
Quantity V1097 Her Error unit AC Boo Error Temperature, T1 6250 150 K 6250 250 Temperature, T2 6095 150 K 6241 250 Mass, m1 0.43 0.01 M⊙ 0.36 0.03 Mass, m2 1.19 0.02 M⊙ 1.20 0.05 Radius, R1 0.78 0.02 R⊙ 0.69 0.01 Radius, R2 1.21 0.01 R⊙ 1.19 0.01 Mbol,1 4.98 0.02 mag 5.26 0.02 Mbol,2 4.13 0.02 mag 4.07 0.02 log g1 4.29 0.01 cgs 4.32 0.01 log g2 4.34 0.01 cgs 4.36 0.01 Luminosity, L1 0.84 0.01 L⊙ 0.65 0.09 Luminosity, L2 1.84 0.03 L⊙ 1.94 0.28 Fill-out factor, f 0.13 0.05 — 0.02 Distance, r 258 8 pc 182 13 Gaia DR2 distance, r 250.3 1.4 pc 156.8 0.6
and of the distance from the Galactic plane, and that extinction is proportional to the column density of the gas, Using Galactic coordinates of l = 50.5821◦
and b = 28.11817◦
(SIMBAD), and the initial distance estimate of d = 0.265 kpc, a value of AV = 0.127
mag was determined. Further iterations left the value of AV essentially unchanged. Then,
substitution into Eq. (2) yielded a distance of 250 pc.
The same authors provided a more detailed model, extinspiral which attempts to take into account the spiral arms of the Galaxy. Starting with an initial distance value r = 0.265 kpc as before, we get a somewhat different initial value of AV = 0.0609. Further
iterations resulted in no perceptible change in AV. Then, substitution into Eq. (2) yields
a distance of 258 pc.
The errors were assigned as follows: δMbol,1 = δMbol,2 = 0.015, δBC1 = δBC2 = 0.015
(the variation of 1 and one half spectral sub-classes), δV = 0.055, all in magnitudes. At this point, it is not clear how to determine the uncertainties in the extinction values AV
from the Amˆores & L´epine model. However, if we take half the difference between the two values we get δAV = 0.03. Combining the errors rigorously (i.e., by adding the variances)
yielded an estimated uncertainty in r of ± 8 pc.
By contrast, reference to the dust tables of Schlegel et al. (1998) revealed a value of E[B − V ] = 0.0474 for those galactic coordinates, virtually identical with the above values. However, because their E[B − V ] values have been derived from full-sky far-infrared measurements, they therefore apply to objects outside of the Galaxy, not the case here. As half the thickness of the Galactic disk is approximately 150 pc (Abell et al., 1991), and the galactic latitude is 28.1◦
(SIMBAD), that makes the path length 150/ sin(28.1) = 320 pc. Assuming that the absorption is constant along the path length, we can take AV = (237/302) × 0.145 = 0.113. Again substituting the value into equation
2 we get r = 251 pc, reassuringly not very different from the pervious estimates. Taking δAV as half of AV results in an error estimate for r of ± 10 pc.
Another approach, the classical one, is to determine galactic extinction from the tab-ulated value for the intrinsic B − V colour index and take the difference (observed– tabulated) to get the colour excess E[B − V ]. So, for a spectral type F8.5, we have (Cox,
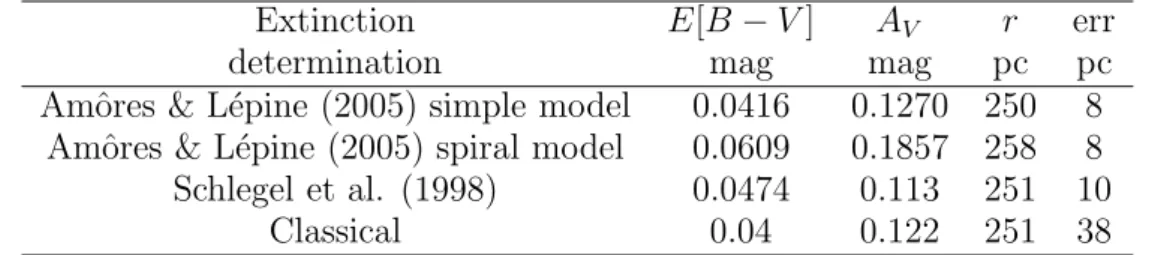
Table 6: Estimating the interstellar absorption
Extinction E[B − V ] AV r err
determination mag mag pc pc
Amˆores & L´epine (2005) simple model 0.0416 0.1270 250 8 Amˆores & L´epine (2005) spiral model 0.0609 0.1857 258 8 Schlegel et al. (1998) 0.0474 0.113 251 10
Classical 0.04 0.122 251 38
2000), (B − V )tables = 0.54(4). From the APASS catalogue we have (B − V )obs = 0.58(6)
yielding E[B − V ] = 0.04(7) mag. Using the relation AV = R E[B − V ] for R = 3.0 or 3.1
(we use 3.05 here), we get AV = 0.12(34) mag and distance r = 251 pc, almost identical
with the above, but with the higher uncertainty of ± 38 pc. Especially in view of the large uncertainties in determining E[B − V ], it is not surprising that this method results in much larger uncertainties in the final result. It is clear that determining E[B − V ] by one of the external methods described above is superior.
We have listed the results in Table 6.
We adopt the weighted mean r = 253 ± 5 pc. However, any of the above distance determinations is consistent with the Gaia distance of 250.3 ± 1.4 pc, which is clearly more reliable.
Conclusion
As mentioned in the abstract, this system has been classified for the first time: the more luminous component has a spectral type of F8.5 V (± 1 spectral subclass). Wilson-Devinney light- and radial velocity–curve analysis has determined masses of 0.41(1) and 1.11(2) M⊙ and luminosities of 0.77(1) and 1.75(3) L⊙ respectively. The mass of the
secondary (cooler, more massive) star is consistent with the main sequence (interpolated) value of 1.15 M⊙ while the luminosity is higher than the interpolated value of 1.35 L⊙
suggesting a slightly evolved state. On the other hand, the secondary is undermassive for its presumed spectral type (F9, assigned for its temperature) and over-luminous. This is consistent with the model of the evolution of an overcontact system in which the present primary (hotter, less massive) started out as the more massive, losing much of its mass to the present secondary (Yildiz and Do˘gan, 2013).
This system is surprisingly similar to AC Boo (Nelson 2010b; Alton 2010). In addition to the very similar parameters listed in Table 5, each is type W, each has a spot, in each the more massive star is slightly evolved, and each has a varying orbital period. In the case of AC Boo however, it was shown by Nelson (2015b) that the eclipsing system likely has a companion, and that the more complex period variation may be explained by a light time effect (Irwin 1952, 1959). For AC Boo, the data span some 87 years whereas for V1097 Her, the data span only some 19 years, so one would not expect LiTE behaviour (if it exists) to become evident yet. Further eclipse timings spanning several decades are required to settle the matter. At this stage it is impossible to conclude anything with regard to a possible mass transfer rate because other causes of period change (such as LiTE) have not been ruled out or otherwise accounted for.
Acknowledgements It is a pleasure to thank the staff members at the DAO (Dmitry Monin, David Bohlender, and the late Les Saddlmyer) for their usual splendid help and assistance. Much use was made of the SIMBAD database during this research.
This work has made use of data from the European Space Agency (ESA) mission Gaia (https://www.cosmos.esa.int/gaia), processed by the Gaia Data Processing and Analysis Consortium (DPAC, https://www.cosmos.esa.int/web/gaia/dpac/consortium). Funding for the DPAC has been provided by national institutions, in particular the institutions participating in the Gaia Multilateral Agreement.
References:
Abell, G.O, Morrison, D., and Wolff, S.C., 1991, Exploration of the Universe, (Saunders), p. 539
Akerlof, C., et al., 2000, AJ, 119, 1901 Alton, K. B., 2010, JAVSO, 38, 57
Amˆores, E.B., L´epine, J.R.D., 2005, AJ, 130, 659 DOI Bailer-Jones, C.A.L., et al., 2018, AJ, 156, 58 DOI Bl¨attler, E. and Diethelm, R., 2002, IBVS, 5306
Bradstreet, D. H., 1993, “Binary Maker 2.0 – An Interactive Graphical Tool for Pre-liminary Light Curve Analysis”, in Milone, E.F. (ed.) Light Curve Modelling of Eclipsing Binary Stars, pp 151-166 (Springer, New York, N.Y.) DOI
Cox, A. N., ed., 2000, Allen’s Astrophysical Quantities, 4th ed., (Springer, New York, NY) DOI
Csizmadia, S., Pasternacki, T., Dreyer, C., Cabrera, A., Erikson, A., Rauer, H., 2013, A&A, 549, A9 DOI
Davidge, T.J., Milone, E.F., 1984, ApJS, 55, 571 DOI Flower, P. J., 1996, ApJ, 469, 355 DOI
Gaia Collaboration, 2018, A&A, 616, 1 DOI
Henden, A. A., Welch, D. L., Terrell, D., Levine, S. E. 2009, The AAVSO Photometric All-Sky Survey, AAS, 214, 407.02
Henden, A. A., Terrell, D., Welch, D., Smith, T. C. 2010, New Results from the AAVSO Photometric All Sky Survey, AAS, 215, 470.11
Henden, A. A., Levine, S. E., Terrell, D., Smith, T. C., Welch, D., 2012, JAAVSO, 40, 430
Høg, E., et al., 2000 A&A, 355, L27 Irwin, J. B., 1952, ApJ, 116, 211 DOI Irwin, J. B., 1959, AJ, 64, 149 DOI
Kallrath, J. & Milone, E.F., 1998, Eclipsing Binary Stars–Modeling and Analysis (Springer-Verlag) DOI
Kurucz, R.L., 2002, BaltA, 11, 101
Lucy, L.B., 1967, Zeit. f¨ur Astroph., 65, 89 Mochnacki, S. W. 1981, ApJ, 245, 650 DOI
Nelson, R. H., 2010, “Spectroscopy for Eclipsing Binary Analysis” in The Alt-Az Ini-tiative, Telescope Mirror & Instrument Developments (Collins Foundation Press, Santa Margarita, CA), R.M. Genet, J.M. Johnson and V. Wallen (eds) [available on ResearchGate]
Nelson, R.H., 2010b, IBVS, 5951
Nelson, R. H., 2013, Software by Bob Nelson,
https://www.variablestarssouth.org/bob-nelson/ Nelson, R. H., 2014, Spreadsheets, by Bob Nelson,
Nelson, R.H., 2015a, NewA, 34, 159 DOI Nelson, R.H., 2015b, IBVS, 6142
Nelson, R.H., 2017, Bob Nelson‘s O–C Files, http://www.aavso.org/ [enter ”O-C” in the search box]
Nelson, R. H., S¸enavci, H. V., Ba¸st¨urk, ¨O, Bahar, E., 2014, NewA, 29, 57 DOI Rucinski, S. M., 1969, AcA, 19, 245
Rucinski, S M., 2004, “Advantages of the Broadening Function (BF) over the Cross-Correlation Function (CCF)”, in Stellar Rotation, IAUS, 215, 17
Schlegel, D. J., Finkbeiner, D. P., Davis, M., 1998, ApJ, 500, 525 DOI
Smith, T. C., Henden, A., Terrell, D., 2010, AAVSO Photometric All-Sky Survey Imple-mentation at the Dark Ridge Observatory, SAS.
Terrell, D., 1994, Van Hamme Limb Darkening Tables, vers. 1.1. Van Hamme, W., 1993, AJ, 106, 2096 DOI
Wilson, R. E., Devinney, E. J., 1971, ApJ, 166, 605 DOI Wilson, R. E., 1990, ApJ, 356, 613 DOI
Wilson, R. E., 1998, Documentation of Eclipsing Binary Computer Model (available from the author)