HAL Id: hal-00797023
https://hal.archives-ouvertes.fr/hal-00797023
Submitted on 5 Mar 2013HAL is a multi-disciplinary open access archive for the deposit and dissemination of sci-entific research documents, whether they are pub-lished or not. The documents may come from teaching and research institutions in France or abroad, or from public or private research centers.
L’archive ouverte pluridisciplinaire HAL, est destinée au dépôt et à la diffusion de documents scientifiques de niveau recherche, publiés ou non, émanant des établissements d’enseignement et de recherche français ou étrangers, des laboratoires publics ou privés.
Functional diversity in gravitropic reaction among
tropical seedlings in relation to ecological and
developmental traits
Tancrède Alméras, Morgane Derycke, Gaëlle Jaouen, Jacques Beauchêne,
Mériem Fournier
To cite this version:
Tancrède Alméras, Morgane Derycke, Gaëlle Jaouen, Jacques Beauchêne, Mériem Fournier. Functional diversity in gravitropic reaction among tropical seedlings in relation to ecological and developmental traits. Journal of Experimental Botany, Oxford University Press (OUP), 2009, 60 (15), pp.4397-4410. �10.1093/jxb/erp276�. �hal-00797023�
Article publié à citer :
Alméras T., Derycke M., Jaouen G., Beauchêne J., Fournier M. (2009) Functional
diversity in gravitropic reaction among tropical seedlings in relation to ecological
and developmental traits, Journal of Experimental Botany, vol. 60, 4397-4410.
Functional diversity in gravitropic reaction among tropical seedlings
in relation to ecological and developmental traits
Tancrède Alméras1*, Morgane Derycke1, Gaëlle Jaouen1, Jacques Beauchêne2, Mériem Fournier3,4
1
INRA, UMR Ecologie des Forêts de Guyane, BP 709, 97310 Kourou, France 2
CIRAD, UMR Ecologie des Forêts de Guyane, BP 709, 97310 Kourou, France 3
AgroParisTech, UMR 1092, Laboratoire d’Etude des Ressources Forêt Bois (LERFOB), ENGREF, 14 rue Girardet, F-54000 Nancy, France
4
INRA, UMR 1092, Laboratoire d’Etude des Ressources Forêt Bois (LERFOB), Centre de Nancy, F-54280 Champenoux, France
*
Author for correspondence: Tancrède Alméras
Address: LMGC, Place E. Bataillon, cc 048, 34095 Montpellier, France E-mail: t_almeras@hotmail.com
Tel.: +33 467 14 3431
Abstract
Gravitropism is necessary for plants to control the orientation of their axes while they grow in height. In woody plants, stem re-orientations are costly because they are achieved through diameter growth. The functional diversity of gravitropism was studied to check if the mechanisms involved and their efficiency may contribute to the differentiation of height growth strategies between forest tree species at the seedling stage. Seedlings of eight tropical species were grown tilted in a greenhouse, and their up-righting movement and diameter growth were measured during three months. Morphological, anatomical and biomechanical traits were measured at the end of the survey. Curvature analysis was used to analyse the up-righting response along the stems. Variations in stem curvature depend on diameter growth, size effects, the increase in self-weight, and the efficiency of the gravitropic reaction. A biomechanical model was used to separate these contributions. Results showed that (1) gravitropic movements were based on a common mechanism associated to similar dynamic patterns, (2) clear differences in efficiency (defined as the change in curvature achieved during an elementary diameter increment for a given stem diameter) existed between species, (3) the equilibrium angle of the stem and the anatomical characters associated to the efficiency of the reaction also differed between species, (4) the differences in gravitropic reaction were related to the light requirements: heliophilic species, compared to more shade-tolerant species, had a larger efficiency and an equilibrium angle closer to vertical. This suggests that traits determining the gravitropic reaction are related to the strategy of light interception and may contribute to the differentiation of ecological strategies promoting the maintenance of biodiversity in tropical rain forests.
Keywords
Introduction
Tropisms and gravitropism are processes observed in all plants and studied for more than a century (Darwin and Darwin, 1880), with important current works about the perception mechanisms at cellular level (Morita and Tasaka, 2004; Humphrey and Bonetta, 2007). These physiological works aim at providing new insights into how plants use tropisms to achieve adaptive growth movements (Iino, 2006). Tropisms are key processes for plants to insure mechanically stable height growth. Display an efficient gravitropic reaction is essential to correct mechanical perturbations with a minimal investment in biomass and allow successful height growth and light interception (Alméras and Fournier 2009). To assess the adaptive significance of tropisms, there is a need to analyse the response at the whole plant level in order to define functional traits characterizing the gravitropic performance and response (Fournier and Moulia 2009). Such responses are usually observed and quantified through experiments in controlled conditions. Biomechanical analysis of the involved motor processes, i.e., processes that follow the perception processes and that provide the necessary mechanical energy to curve the plant axis, provides useful tools for analyzing the observed responses, through spatial modelling of cumulative strains along the growing axis and mechanical modelling of the combined effects of size, geometry, tissue properties and growth on the observed movement (Meskauskas et al., 1999a; Meskauskas et
al., 1999b; Coutand et al., 2007; Sierra-de-Grado et al., 2008; Alméras and Fournier 2009).
Gravitropic movements are due to the induction of asymmetric mechanical stresses in the tissues, both in turgid herbaceous and woody stems (Hejnowicz 1997). However in woody tree stems, the magnitude of forces required to curve the already lignified and stiff stem is much higher, and cannot be achieved by turgor-induced stresses. This gravitropic reaction is achieved by another process, the induction of asymmetric “maturation stress” in the newly formed growth ring, which generally induces a shrinkage of the fibre secondary wall after its formation (Archer 1986). In reaction wood produced on one side of tilted stems, maturation shrinkage is different: higher in tension wood produced on the upper side of dicotyledonous tree, opposite (expansion) in compression wood produced on the lower side of conifers. This results in a bending moment that curves up the stem and counteracts the effect of increasing weight. Because it only occurs during the maturation of a new growth ring, the gravitropic reaction in woody stems is necessarily related to diameter growth increments. Fournier et al., (1994a; 2006) showed that when a stem reacts the rate of change in curvature is proportional to the rate of diameter growth and inversely proportional to the stem cross sectional area. As recently pointed out (Moulia and Fournier 2009), it is essential to control for these dimensional effect in order to compare the gravitropic reaction between stems that differ in size and growth rate. The coefficient of proportionality was termed the “gravitropic efficiency” (Alméras and Fournier, 2009). It quantifies the intrinsic efficiency of the mechanism, independently of the growth rate and stem size.
This efficiency depends mechanistically on various parameters of wood properties and stem anatomy (Alméras and Fournier, 2009) that differ between species, such as the maturation strain of tension wood (Fournier et al., 1994b; Alméras et al., 2005) and opposite wood (Clair et al., 2006a), the structure of tension wood fibres (Clair et al., 2006b; Ruelle et al., 2006; Ruelle et al., 2007), the eccentricity of diameter growth (Alméras et al., 2005), the cross-sectional heterogeneity of tissue stiffness (Alméras et al., 2005) and the timing and the location of the reaction along the stem (Coutand et al., 2007; Sierra-de-Grado et al., 2008). We hypothesize that the diversity of the characters involved in the gravitropic reaction and the resulting diversity in efficiency may contribute to the differentiation of height growth strategies among young tropical trees, in relation to their developmental and ecological traits. For seedlings of light-demanding species, competition for light is a major issue and is achieved through a rapid height growth, so that their gravitropic reaction is expected to reorient the stem quickly and efficiently towards the vertical. Species with lower light requirements and a more opportunistic behaviour, referred to as semi-tolerant species, should be more tolerant to departure from the vertical orientation to allow exploration of the light environment, and are therefore expected to have a looser gravitropic control. Differences in
the efficiency of the mechanism are also expected to be related to developmental traits such as stem anatomy and tree architecture. Mechanical considerations show that the efficiency is expected to be larger in species producing a large amount of tension wood located on the upper side of the tilted stem, correlatively with eccentric diameter growth, and in which the pith is large (Alméras and Fournier, 2009). The control of the gravitropic reaction is expected to be influenced by the plagiotropic or orthotropic habit of the stem, which defines its position of equilibrium in the field of gravity (Digby and Firn 1995).
To test these hypotheses, the gravitropic reaction of tropical seedling belonging to species with contrasted ecological and morphological traits was studied. The stems were tilted in controlled conditions, and their up-righting movement was measured. Curvature analysis (Coutand et al., 2007) was used to study the dynamics and the kinematics of the up-righting movement. A biomechanical model (Fournier et al., 2006; Alméras and Fournier, 2009) was used to separate the effects of the increasing self-weight and the balancing gravitropic reaction, and estimate the gravitropic efficiency. The kinematics of the up-righting movement, the angle of equilibrium of the stems, the gravitropic efficiency and associated morphological and anatomical traits are analyzed to provide a first evaluation of the functional diversity of the gravitropic reaction and its possible relationship with other ecological or developmental traits.
Material and methods
Plant material and tilting treatment
The study was conducted on 8 tree species commonly found in the coastal tropical rainforest of French Guiana, covering a wide range of light requirements (based on Paracou permanent plot data, Favrichon, 1995). We included two genera with two congeneric species (Virola and Eperua) to check whether important variations of gravitropic efficiency could exist in phylogenetically close species. Botanical names and main ecological traits are shown in table 1. Architectural models are also mentioned, as the very common Troll’s model (Hallé et al., 1978) is characterized by a more or less marked plagiotropic habit of the main axis during seedling stages. This character could influence the way plants react because, on one hand, the tilt angle of the stem induces a mechanical disturbance and, on the other hand, the process of gravitropic regulation is expected to keep the stem at a non-zero angle from vertical.
Seedlings were grown in pots in a nursery at the EcoFoG Campus (Kourou, French Guiana), either from seeds (Carapa procera, Eperua falcata, Eperua grandiflora, Virola michelii,
Virola surinamensis) or transplanted seedlings (Cecropia obtusa, Dicorynia guianensis, Tachigali melinonii). Seeds were planted in February 2005, and seedlings were transplanted
later (T. melinonii: 7/2005, D. guianensis: 8/2005, C. obtusa: 10/2005). In February 2006, 8 seedlings were selected per species to constitute homogeneous sets and were transferred into a shade-house (15% of full light). All seedlings were approximately 1 year old at that time, except those of C. obtusa that were only 6 month old. Differential growth rates and/or reaction to the transplantation resulted in heterogeneous size between species at the beginning of the survey (Table 1).
The pots were placed at random positions on a 35° inclined strand to induce a tilt angle. Previous works have shown that this angle was generally adequate to induce a maximal gravitropic reaction of the stem, without inducing the development of epicormic shoots (Yoshida et al., 2000; Yamashita et al., 2007). Pots were watered at field capacity during the whole survey.
Up-righting and growth measurements
Up-righting movement and diameter growth of the seedlings were measured between February and May 2006. At the beginning of the experiments, measurement points were marked with paint every centimetre along the stem from its base to its tip. Only the part of the stem already formed at the beginning of the survey was measured, not the further elongated part. The location of each point along the stem was recorded every two weeks, using a magnetic digitizing device (3SPACE FASTRAK, Polhemus) with associated software (Sinoquet and Rivet, 1997; Adam, 1999). This allows to record the 3-D position of the points with a precision usually <1cm. The diameter was measured once a month with a digital calliper, every two centimetres along the stem.
At the end of the experiment, the seedlings were cut at their base, and destructive measurements were performed to evaluate biomechanical parameters. The total length of each seedling (including the part extended during the experiment) was measured. The morphology of the seedlings was then characterized using a previously described protocol (Jaouen et al., 2007): the stem was divided in 8 segments on which the basal diameter and the fresh weight of stem, branches and leaves were measured. Segments of the stem were kept for mechanical tests and anatomical observations.
Mechanical tests: apparent modulus of elasticity
One segment was taken at the base of each stem and kept in water a few days before being tested. The apparent modulus of elasticity was measured using a 3-point bending test, with a procedure similar to Rowe et al. (2006). The measured parameter is representative of the mechanical behaviour of the whole segment, i.e., not the wood only, but also the bark that may display a significant contribution in young stems (Niklas, 1999). For all measurements, segments were taken slender enough (length/diameter>25) to avoid any significant effect of
shear. The stem segment was put on two holders, and successive loads were applied at its mid-point. The deflection induced by the loads was recorded using a calibrated optic system. The apparent modulus of elasticity E [N.m-2] characterizes the mechanical behaviour of the materiel in the linear domain (i.e., when the deflection is proportional to the load). The larger
E, the stiffer the material. It is computed as:
y
I
H
W
E
⋅
⋅
⋅
=
48
3 (1),where W [N] is the applied weight, H [m] is the distance between holders, y [m] is the deflection at the mid-point, and I [m4] is the moment of inertia of the cross-section. For a circular section, I =πD4/64, where D [m] is the diameter.
Equation 1 holds for a beam of uniform diameter. For a tapered structure as stem segments usually are, this formula is no longer strictly valid. Because D is at power 4 in equation 1, we performed a preliminary study to check if the taper could be neglected. The diameter was measured at 11 positions along each stem, in 2 perpendicular directions. At each position, the geometrical mean of the two diameters was taken as the representative diameter. Data were then processed using a numerical model that accounts for the heterogeneous taper to estimate
E. These reference results were compared to those based on equation 1, using various
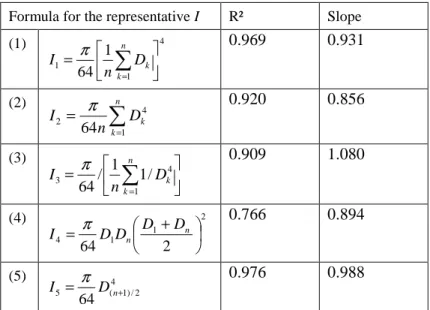
formulae to compute the representative second moment of area I from the n=11 diameter data (Table 2): (1) using the second moment of area corresponding to the mean diameter; (2) using the mean second moment of area; (3) using the reciprocal mean second moment of area; (4) using the exact formula for a conical beam, put in the same form as equation 1; (5) using the second moment of area corresponding to the diameter at the mid-point of the stem. The results (Figure 1) show that method (5), which is the simplest method, is also the most accurate with a value of R² and a slope both close to 1 (Table 2).
Anatomical observations
Anatomical observations were performed on 2 seedlings per species. Three segments were taken from each studied seedling, representative of the proximal, median and distal parts of the stem. Within each segment, a 20µm-thick cross-section was cut with a sliding microtome and stained with Safranin-Fast Green. This stains lignified tissues in red and poorly lignified tissues (e.g. tension wood) in blue. The following characters were qualitatively observed: abundance and location of tension wood, degree of eccentricity, relative thickness of the pith, wood and bark.
Curvature analysis and computation of geometric descriptors
The 3-D coordinates of points every centimetre along the stem were processed to obtain numerical information about the change in orientation and curvature of the stems. Points were first projected into their main vertical plane (i.e., the vertical plane that minimizes the distance between the original points and the projected points) to reduce them to a 2-D information. The curvature (i.e., the local change in angle per unit length) at each point along the stem was computed from these data using the procedure described in Coutand et al. (2007). Curvature data were used to analyze the kinematics of the gravitropic movement and compute efficiency parameters at the species level (see next section).
Three global descriptors of the stem shape were computed: the secant angle (i.e., the angle of the line joining the first and the last points), the proximal angle (i.e., the angle of the line joining the first point and the point located at 30% of the total length) and the distal angle (i.e., the angle of the line joining the point located at 70% of the total length and the last point). All angles are expressed relative to the vertical direction. Proximal and distal angles were used to analyze the dynamics of up-righting, and the secant angle was used to compute the lever arm associated to the increasing weight (see next section).
Biomechanical model of gravitropic efficiency
The gravitropic change in curvature of a stem part is achieved through the asymmetric development of maturation stress within a new wood layer. Based on mechanical considerations, Fournier et al. (2006) showed that the change in curvature dCr [m
-1
] due to the maturation of an elementary diameter increment dD [m] depends on the diameter of the
stem D [m] and on a dimensionless parameter related to the biomechanical efficiency of the mechanism, hereafter denoted er:
2 4 D e dD dCr r = (2)
Integrating equation 2 over a finite diameter increment, the gravitropic efficiency can be estimated from the joined measurements of the change in curvature due to the gravitropic reaction ∆Cr and diameter growth given by the initial and final diameters Di and Df (Coutand
et al., 2007): 1 1 2 3 4 4 5 6 − ∆ = f i r r D D C e / 1 1 4 (3)
However, the total change in curvature dCtot during an elementary growth period is the sum
of the gravitropic reaction dCr and the bending due to the increasing weight dCw. The effect
of weight can also be expressed as a function of diameter growth, for a straight tilted stem whose allometry is defined by power laws (Alméras and Fournier, 2009):
3 2
)
1
2
(
)
1
(
)
1
(
sin
32
D
n
m
E
H
b
L
g
dD
dC
w H⋅
+
⋅
+
⋅
⋅
+
⋅
⋅
⋅
−
=
φ
(4)where g is the gravitational acceleration (9.8 kg.N-1), φ [rad] is the tilt angle of the stem, L [kg.m-3] is the load ratio of the stem (i.e., the ratio between the above-ground fresh mass of the plant and the volume of the stem), H [m] is the height (total length) of the stem, D [m] is the diameter at its base, E [N.m-2] is its apparent modulus of elasticity, n and m are two dimensionless parameters relative to the taper and distribution of loads within the stem, so that the diameter at a distance s from the base is D(s)=D⋅
(
1−s/H)
n and the load located distal to s is M(s)=MT⋅(
1−s/H)
m, where MT is the total above-ground mass of the tree. Parameter bH is the ratio between relative height growth and relative diameter growth, thatcan be deduced from the allometric relation between H and D ( bH H D
a
H = ⋅ ).
For stems of the size used in this study, preliminary calculations show that, when the stem reacts during an elementary diameter increment, we usually have |dCw| <<|dCr|, so that dCtot
may be a good approximation of dCr. Therefore, we expressed er in the following form: w f i tot r e D D C e 11− 2 3 4 4 5 6 − ∆ = / 1 1 4 (5)
where ew is a corrective term related to the effect of weight. Its value can be deduced from
equations 2 and 5 to check whether or not it is negligible:
D
n
m
E
H
b
L
g
e
H w⋅
+
⋅
+
⋅
⋅
+
⋅
⋅
⋅
−
=
)
1
2
(
)
1
(
)
1
(
sin
8
2φ
(6)This corrective term was calculated using species mean values for all parameters, obtained from morphological and mechanical measurements. Note that the sign of ew is opposite to
that of er, so that neglecting the corrective term would lead to an underestimation of the
gravitropic efficiency.
The efficiency of the curving process was estimated for each species from the statistical relation between the diameter growth (measured as 1/Di−1/Df according to equation 3)
occuring at a given level in a stem, and the change in curvature computed at the same level. We used data concerning the first 2 months only, because many stems reached the vertical position and were not fully reacting any more during the third month. As done by Coutand et
al. (2007), as the reaction could change with time from an upward curving to an autotropic
counter-curving, we applied equation 3 for the successive two-week periods, summing absolute values of changes in curvature, and comparing the sum to the total growth during the two months. Six stems were excluded from the analysis because the quality of digitization data was not good enough to obtain reliable estimates of changes in curvature. The parameter er estimated from this regression analysis indicates the mean efficiency of a
species, while the scatter of the relation indicates the variability of the process between stems and/or between positions along the stems. The gravitropic efficiency er and the corrective
term ew are both homogenous to a strain (i.e., a relative change in dimension), and will be
Results
Dynamics and kinematics of the up-righting movement
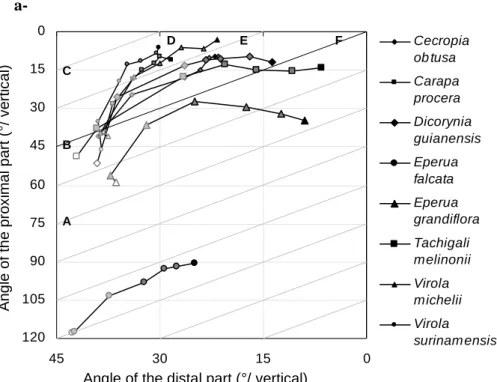
The mean up-righting dynamics of each species is displayed on figure 2. On figure 2a, the mean distal angle is plotted as a function of the mean proximal angle, for each date. The set of all dates represents the mean trajectory of a species. Each position on the chart defines the orientation and shape of a stem at a particular date. Some theoretical examples of stem shape are displayed on figure 2b, with correspondence to the position on figure 2a. A point located on the first diagonal (such as B and F in figures 2a and 2b) has the same angle in its basal part and its distal part, indicating that it is tilted but with a straight stem. A point above the first diagonal (as C, D, E) has its distal part more vertical than its basal part, indicating that the stem is curved upward. A point below the first diagonal (as A) is more tilted in its distal part than in its basal part, indicating a downward curvature. A vertical trajectory (such as between A, B and C in figures 2a and 2b) indicates that the proximal angle is constant while the distal angle increases, i.e., that the up-righting movement is achieved only by a change in curvature along the stem. A trajectory parallel to the diagonal (such as between C and D, in figures 2a and 2b) indicates that the proximal angle and the distal angle change at the same rate, suggesting that most of the change in curvature is achieved in the basal part and induces a rotation of the whole stem, and/or that changes in curvature occurring in middle and distal parts of the stem compensate each other. A horizontal trajectory (such as between D, E and F in figures 2a and 2b) indicates that the proximal angle increases while the distal angle is constant. This necessarily involves a change in orientation in the basal part together with a counter-curving process occurring in distal parts of the stem. This shift of the motor process is usually termed autotropic straightening, autotropism or automorphogenesis (Stankovic and Volkmann, 1998; Coutand et al., 2007), and is achieved by the production of reaction wood on the opposite side of the stem before it overshoots the vertical (Archer and Wilson, 1973). The angle at the start of the experiment results from the initially imposed 35° tilt angle, cumulated to the natural tilt angle of the plant, and the additional small perturbations due to the rotation of the soil in the pot and the bending of stems under their own weight. This results in different starting points, in particular for E. falcata and partially E. grandiflora, which have a curved stem as part of their normal architectural development, resulting from the strong plagiotropy of the leader axis. Distal parts of E. falcata were generally below horizontal after tilting.
The standard deviation of the angle within a species was typically 5° for the proximal angle and 10° for the distal angle. The mean trajectories can generally be described in 3 distinct phases, the first phase lasting two weeks (segment joining the white dot to the first light-gray dot), the second phase lasts 4 weeks (two next segments, starting from the light-gray dots) and the third phase lasts 6 weeks (three last segments connecting dark-gray dots to the black dot). During the first phase, almost no change in orientation occurred for E. falcata, E.
grandiflora, T. melinonii and V. surinamensis, while other species started up-righting mainly
by the distal parts (i.e., trajectory close to vertical in the figure). During the second phase, all species are decreasing both the proximal and the distal angle (trajectory between the vertical and the diagonal), indicating that the up-righting reaction takes place both by a change in orientation of the basal part and a change in curvature all along the stem. The change in proximal angle is substantially larger for C. obutsa and T. melinonii than for other species. During the third phase, the up-righting movement is globally slower (i.e., successive dots are closer to each other), and the trajectories are almost horizontal for E. grandiflora, C. obtusa,
T. melinonii and D. guianensis, indicating that the distal part of the stem is stabilized at a
non-zero angle from vertical (approx. 10° for C. obtusa and T. melinonii, 15° for D.
guianensis and 30° for E. grandiflora), while the basal part still rights-up. In other species,
the distal angle goes on decreasing, but the proximal angle always decreases at a larger rate (i.e., trajectories are between the diagonal and the horizontal). This indicates that an autotropic counter-curving process takes place for all species before the stem is close to reach the vertical.
This process is evidenced by the curvature analysis, of which examples are shown in figure 3. Upper charts display the shape of the stem at different dates, and lower charts show the corresponding local curvature as a function of the position along the stem. Comparison between successive dates in figures 3a,b,c shows that the up-righting movement starts with an increase in stem curvature all along the stem during the first six weeks. Afterwards, the autotropic straightening movement takes place, revealed by a very non-uniform change in curvature along the stem. In the basal parts, stem curvature continues increasing, but in the distal parts it strongly decreases until reaching values close to 0. The same mechanism is used for the straightening of stems that stabilize at a non-zero angle, as illustrated in figures 3d,e. In these two examples, the up-righting movement starts by an increase in curvature all along the stem during the first 6 weeks, but is followed by a decrease in curvature mainly located in distal part during the last period. This autotropic movement happens much before the stem reaches the vertical, and seems to be designed to maintain a constant tilt angle in distal parts while the stem straightens.
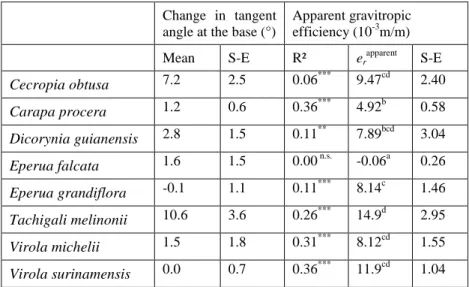
The change in proximal angle is due to the large changes in curvature occurring in the basal part of the stem (as illustrated in figure 3a,b,c), but also to a change in the tangent angle at the very base of the stem (see e.g. figure 3d, upper chart). The change in tangent angle occurring during the observation period has been quantified (Table 3) and the mean value happens to be <3° for most species, i.e., much less than the effect of changes in curvature. Two exceptions are C. obtusa (8°) and T. melinonii (11°), for which this change in tangent angle is a non-negligible contribution to the up-righting movement.
Apparent efficiency of the gravitropic reaction
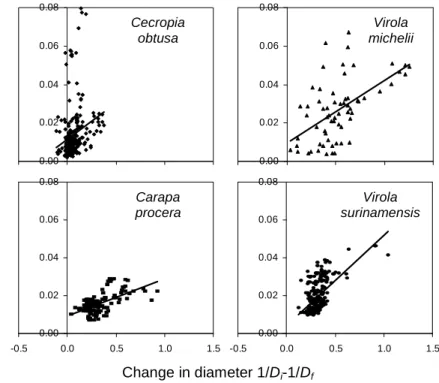
The amount of change in curvature is significantly related to the amount of diameter growth for all species, except E. falcata (Figure 4). The quality of the relation is variable between species, and is clearly reduced by the presence of some points with higher values of change in curvature for some species (C. obtusa, D. guianensis, T. melinonii and V. michelii). It was checked that these points do not belong to the same individuals. In the case of C. obtusa, a detailed analysis showed that points with a change in curvature >0.03 all belong to the distal parts of the stems (>70% of the length), where the pith is very large and the wood reduced to a thin strip. When only the distal parts of C. obtusa stems are taken in the regression, the estimated gravitropic efficiency is much larger (36.2±11.4 S-E) as suggested by the steep slope of this subset of points.
The overall species effect on the gravitropic efficiency is highly significant (p<0.001). Differences between species are indicated in table 3. For E. falcata, the gravitropic efficiency is not significantly different from 0. The gravitropic efficiency of C. procera is significantly lower than all other species except D. guianensis. Among other species, only the difference between E. grandiflora and T. melinonii is significant. Slope estimations suggest that C. obtusa, V. surinamensis and T. melinonii have the largest gravitropic efficiency.
Effects of the weight increment and net up-righting efficiency
The bending effect of the weight increment, quantified by the parameter ew, differs between
species (Table 4). For some species (D. guianensis, T. melinonii, V. michelii), it is completely negligible when compared to er. For most other species (C. obtusa, C. procera, E.
grandiflora, V. surinamensis), the correction is small (around 3% of the er values), and does
not change the ranking of species according to er. Differences in ew result from differences in
morphological and mechanical properties. The lowest values are obtained for the species with the smallest seedlings, and this is probably due to a size effect in equation 6: if the H/D ratio and other parameters are constant during growth, ew increases linearly with the stem
height. The relatively high values of C. obtusa and V. surinamensis are probably related to their lower modulus of elasticity (E), lower taper (n) and higher centre of mass (lower m). For E. falcata, the value of ew is much larger than for other species, mainly because its axis
remains plagiotropic, so that the lever arm on which the weight increment acts is much larger than for other species. This reveals that, despite the apparent er was close to 0, the actual
gravitropic efficiency er corrected
other species). This case evidences the fact that the stem gravitropic reaction is necessary not only to achieve changes in curvature, but also to achieve a “posture control” (Moulia et al. 2006), i.e., to keep a constant angle while it grows, because it must compensate for the weight increments that otherwise would induce a downward bending.
Anatomical observations
Tension wood was found in all observed sections, but its amount and location differed between species, and between proximal, middle and distal sections. In proximal sections, tension wood was always located in the upper side of the developed growth ring, and its extension usually covered the whole upper half, i.e., it was continuously produced on half of the cambium circumference. For C. procera, the circumferential extension was lower than for other species, and tension wood appeared as strips, showing that its production was not continuous in time. For T. melinonii, the production of tension wood in basal parts stopped before the end of the experiment, consistent with the fact that most stems of this species were already vertical at that level. In sections located at the middle of the stem, tension wood was almost always found in the upper half of the section, but its amount was lower than in basal sections, and it appeared as strips of lower circumferential extension. In many cases (mainly for T. melinonii and D. guianensis), its production completely stopped before the end of the observation period. A little amount of tension wood was sometimes found in the lower half of the middle sections of E. falcata and E. grandiflora. In distal sections, the production of tension wood in the upper half generally stopped earlier, and strips of tension wood were often found in the lower half.
Eccentric growth was observed in the direction where tension wood was produced in most species: it was unclear for D. guianensis, moderate for C. obtusa, E. falcata, and T. melinonii and severe for C. procera, E. grandiflora, V. surinamensis and V. michelii, where the growth ring was typically 3 to 5 times larger on the tension side than on the opposite side.
The diameter of the pith is often non-negligible on woody sections of this size, and its relative importance is larger on distal sections of the stem. Mean pith diameter was typically 15% of the total diameter for T. melinonii, 20% for D. guianensis, E. falcata, E. grandiflora and V. surinamensis, 30% for C. procera and V. michelii. In C. obtusa, the pith disappears and the stem becomes hollow, and the pith becomes larger (in absolute value) in distal parts of a growth units. It was typically 30% of the total diameter in proximal sections, 70% in middle sections and 90% in distal sections. The thickness of the bark generally ranged between 10% and 35% of the total radius, without important differences between species, except C. obtusa for which bark thickness was lower (2-15%).
Discussion
Up-righting patterns are similar between species
The dynamics of up-righting are qualitatively similar for the studied species. After 3 months, the tilted seedlings of all species almost completely recovered their initial orientation. The pattern was described as three successive phases, and their timing was very similar between species. This succession of three phases – “latent”, “gravitropic” and “autotropic” - of distinct qualitative behaviour is consistent with the observations of Coutand et al. (2007) working on poplars seedlings of equivalent age inclined at the same angle, and with the similar study of Sierra-de-Grado et al. (2008) on pine seedlings of different provenances. The similarity between the succession of phases and their timing for seedlings of tropical and temperate species belonging to distant taxa is remarkable. The biological significance of this fact may be related to the nature of the gravitropic mechanism and its kinematic constraints. The movement is achieved by the formation of new reaction wood fibres, so that the latent phase may be related to the time needed for their production and differentiation. Then, the gravitropic phase takes place by an upward change in curvature distributed along the stem, until the distal part of the stem becomes close to its equilibrium position. Finally, the autotropic phase, characterized by a counter-curving of the distal parts, is necessary to continue up-righting the basal part while preventing distal parts from overshooting the equilibrium position. This reinforces the conclusion of Coutand et al. (2007) who emphasized the similitude of righting process phenomenology between their poplars and mushroom stems of Coprinus (Meskauskas et al., 1999a; Meskauskas et al., 1999b), suggesting either (1) a common mechanism of control for the balance between gravitropic curving and autotropic straightening that could have been conserved during evolution, or (2) a strong selective pressure for efficient straightening processes that would have promoted analogous mechanisms (Moulia et al., 2006).
Relation between growth and changes in curvature
The bending effect of the increasing weight has been shown to be much lower that the up-righting effect of the gravitropic reaction for seedlings of most species. This result is probably general for orthotropic stems of this range of size. It should however be noticed that, because dimensional effects are different in equations 2 and 4, the effect of weight becomes less and less negligible when stems become larger (Alméras and Fournier, 2009). It is also non-negligible if the stem is partly plagiotropic, as it is the case for E. falcata (see also Alméras et al., 2004), because in this case, the bending moment is larger and the reaction is lower.
The species for which the effect of increasing weight was negligible all exhibited significant relations between changes in curvature and diameter growth. This confirms that: (1) stem changes in curvature are achieved through diameter growth; (2) dimensional effects (diameter and growth rate) are the main source of variations of the change in curvature between reacting stem parts of a same species; (3) the intrinsic efficiency of the mechanism can be viewed at first order as a population characteristic allowing the comparison of species or provenances (Sierra-de-Grado et al., 2008). However, a quite large scattering has been observed for many species, suggesting that within-stem differences in efficiency occur, probably in relation to longitudinal gradients in the intensity of the reaction as confirmed by kinematical and anatomical observations.
The gravitropic efficiency in seedlings depends on various anatomical characters
The gravitropic efficiency differs between species. The lowest value was found for E. falcata, and this is probably related to an incomplete reaction due to its plagiotropic habit, as confirmed by the low content in tension wood of middle and distal parts. In other species, the gravitropic efficiency ranged between 5 and 15 mm/m. The incertitude on the estimated value is quite large because of the large scattering, so that differences between species are not always statistically significant. However, all these values are clearly larger than one could expect from the application of the simplest form of Fournier’s model, assuming
homogeneous stiffness and concentric growth with a sine distribution of tension wood (Fournier et al., 1994a; Fournier et al., 2006). Under these assumptions, the gravitropic efficiency is equal to the difference in maturation strain between the upper and the lower side of the section, which is approximately equal to the maturation strain of tension wood (because maturation strains have a much lower magnitude in opposite wood). Maturation strains can be directly measured at the stem periphery (Yoshida and Okuyama, 2002), but metrological problems make this measurements very inaccurate for stems of the size used in this study. Values of maturation strain reported for tension wood on various tree species (Fournier et al., 1994b; Alméras et al., 2005; Kubler, 1987) rarely exceed 2 or 3 mm/m. Previous estimations of the gravitropic efficiency on stems of similar size (Fournier et al., 1994a; Alméras, 2001; Coutand et al., 2007; Sierra-de-Grado et al., 2008) all lead to values much higher than these, as ours do.
The above mentioned assumptions of the simplest form of Fournier’s model are generally adequate for big stems with a moderate reaction, but are no more met when the reaction is strong in response to a large tilt angle, and/or if the stems are small and an important part of the section is not made of wood. In this case, the influence of other factors cannot be neglected. Based on a more general representation of the heterogeneity of the section, Alméras and Fournier (2009) showed that the gravitropic efficiency can be expressed as the product of 3 factors:
α
∆
⋅
⋅
=
core ring rE
E
f
e
(7)where∆
α
[m/m] is the difference in maturation strain between the upper and the lower sides of the stem, and f is a form factor depending on the distribution of tension wood in the new ring and on its eccentricity (f is 1 in the simplest form of Fournier’s model), and Ering/Ecore isthe ratio of the elastic moduli of the new ring and the core of the section (also equal to 1 in the simplest form of Fournier’s model). Different factors can contribute to an optimal distribution of maturation stress within the new ring, increasing f in equation 7 (Alméras and Fournier, 2009): (1) differences in stiffness between tension and opposite wood can increase it up to approx. 20%, (2) optimal circumferential distribution of tension wood can increase it by 25%, and (3) eccentric growth can increase it by 100% or more. In addition, (4) the pith and bark imply a non-negligible effect of the stiffness ratio Ering/Ecore: it can increase the
efficiency by approx. 20-30% for young stems of most species. The cumulative influence of all these factors may well explain the large efficiencies found. Moreover, in the case of C.
obtusa, the distal part of the stem is hollow on 90% or more of its radius, and calculations
show that this can multiply the gravitropic efficiency by a factor 3-5. This is consistent with the very large efficiency (36 mm/m) obtained on this subset of points.
Diversity of up-righting strategies is related to developmental and ecological traits
Gravitropic reaction of angiosperm seedlings is achieved by a common basic mechanism, associated to a common dynamic pattern, but many features contribute to the differentiation of up-righting strategies. Differences concern both the target shape (i.e., the “gravitropic set-point angle” defined by Digby and Firn, 1995) and the way it is reached.
Clearly, trees in which the leader axis is plagiotropic (E. grandiflora and especially E.
falcata) stop reacting in the distal parts when their equilibrium angle is reached. Some
species with orthotropic stems (e.g. D. guianensis, T. melinonii) stop up-righting distal parts at an equilibrium angle 10° to 15° from vertical, but continue up-righting the proximal parts to at least the same angle, becoming slightly tilted but straight at the end of the observation period. Other species (e.g. C. procera, V. surinamensis, V. michelii) tolerate a much larger angle in the proximal part (20°-30°), but concentrate the reaction on distal parts, until they are closer to vertical (<10°). Having a relatively large equilibrium angle in the distal parts can provide an advantage for light interception, especially when there is asymmetric light (Ishii and Higashi, 1997). It is suitable for an exploratory and opportunistic development strategy. Interestingly, the 3 semi-tolerant species studied (D. guianensis, E. falcata, E.
grandiflora) have the largest equilibrium angles. In the long term, this may become a great
compensate the increase in weight when a tilted stem gets bigger (Alméras and Fournier, 2009). In later stages, branches rather than the main stem may be used for this horizontal exploration. On the opposite, a vertical apex maximizes the possibility of quickly growing in height, because the extended part will be also vertical and thus more stable than if the apex was inclined, and can therefore be built higher for a given amount of invested biomass. The three studied species with this pattern (C. procera, V. surinamensis, V. michelii) happen to be heliophilic species.
Changes in tangent angle at the base of the stem have been shown to contribute significantly to the up-righting process for some species (T. melinonii and C. obtusa). The underlying mechanism is unclear, but maturation strains in roots are likely to be involved (Leopold et al., 2000; Fisher and Tomlinson, 2002; Fisher 2008). As root anatomy has not been observed, we do not know why some species do use this mechanism and other don’t. However it is noteworthy that these two species are known for developing stilt roots (C. obtusa), or buttresses (T. melinonii) from the sapling stage (Mori et al., 2002). Most other studied species do not develop such organs (expect V. surinamensis that produces steep buttresses in later stages). The variable contribution of specific mechanisms at the stem base contributes to the diversity of up-righting strategies. The efficiency of the curving mechanism is also clearly variable. Differences in maturation strains of tension wood (i.e., in the intrinsic efficiency of the tissue) may play a role in these variations, but could not be directly evaluated. Tension wood of different species, while performing the same function, can have different anatomical aspect and ultra-structural features (Onaka, 1949; Clair et al., 2006b; Ruelle et al., 2006; Ruelle et al., 2007). Specific differences in tension wood maturation strains have rarely been demonstrated, because maturation strains are usually studied in natural conditions. In such conditions, the variability of maturation strains is driven by the uncontrolled stimulus and any species seems able to develop high tension strains and severe tension wood in severely leaning stems (Fournier et al., 1994a). In the case of seedling stems, we showed that other characters relative to the distribution of tension wood, eccentricity or pith diameter clearly vary between species and significantly contribute to the diversity in gravitropic efficiency at this stage.
Conclusion
This study showed that up-righting movements in stems of various tropical species are achieved by mechanisms that have many common features: at the level of a cross section the asymmetric development of reaction wood generates a change in curvature; at the stem level this process progresses in time and space with a similar pattern, involving the succession of a latent phase, a phase of gravitropic up-righting, and a phase of autotropic straightening. However, differences between species were found concerning the quantitative value of parameters describing this reaction: equilibrium angle of the stem, gravitropic efficiency, contributions of pith size and eccentric growth to this efficiency, effect of the stem weight, contribution of the changes tangent angle at the stem base. The value of these traits was found related to the architecture of the species (plagiotropic or orthotropic habit) and to their light requirements. It was recently pointed out that, in order to assess the ecological consequences wood functional diversity, there is a need to define wood traits, develop methods to evaluate them and carry out their measurement on a diversity of species (Chave 2009). The present work provides a first step towards these lines, by quantifying the diversity of traits related to the gravitropic function of wood. These traits were found related to the strategy of light interception, suggesting that their diversity may contribute to the differentiation of ecological strategies promoting the maintenance of biodiversity in tropical rain forests.
Acknowledgments
This research was carried out as part of the ‘‘Woodiversity’’ project supported by the French National Research Agency (ANR-05-BDIV-012-04). Authors wish to thank the people that
contributed to this work: Lisa Kleinig for help in the measurements of MOE, Catherine Coutand for providing the software for curvature analysis, Nick Rowe for providing the apparatus for bending tests, Fernand Boyer and Soepe Koese for making the inclined strands, Jean Weigel et Saintano Dufort for giving care to the seedlings, Jean-Yves Goret and Pascal Petronelli for collecting the seeds.
References
Adam B. 1999. POL95 - software to drive a Polhemus Fastrak 3 SPACE 3D
digitiser. Version 1.0. Clermont-Ferrand: UMR PIAF INRA-UBP.
Alméras T. 2001. Acquisition de la forme chez des axes ligneux d'un an de trois
variétés d'abricotier : confrontation de données expériementales à un modèle biomécanique. Ph D thesis, Agro-Montpellier, Montpellier (France).
Alméras T, Costes E, Salles JC. 2004. Identification of biomechanical factors
involved in stem shape variability between apricot-tree varieties. Annals of Botany 93, 1-14. Alméras T, Fournier M. 2009. Biomechanical design and long-term stability of
trees: morphological and wood traits involved in the balance between weight increase and the gravitropic reaction. Journal of Theoretical Biology 256, 370-381.
Alméras T, Thibaut A, Gril J. 2005. Effect of circumferential heterogeneity of
wood maturation strain, modulus of elasticity and radial growth on the regulation of stem orientation in trees. Trees 19, 457-467.
Archer RR. 1986. Growth stresses and strains in trees. Springer Verlag, Berlin/
Heidelberg/ New York
Archer RR, Wilson BF. 1973. Mechanics of the compression wood response. II. On
the location, action and distribution of compression wood formation. Plant Physiology 51,
577-582.
Chave, J. 2009. Towards a worldwide wood economics spectrum. Ecology Letters 12, 351–366.
Clair B, Alméras T, Sugiyama J. 2006a. Compression stress in opposite wood of
angiosperms: observations in chestnut, mani and poplar. Annals of Forest Science 63,
507-510.
Clair B, Ruelle J, Beauchêne J, Prevost MF, Fournier M. 2006b. Tension wood
and opposite wood in 21 tropical species. 1. Occurence and efficiency of the G-Layer. IAWA
Journal 27, 329-338.
Coutand C, Fournier M, Moulia B. 2007. The gravitropic response of poplar
trunks: key roles of prestressed regulation and the kinetics of cambial growth versus wood maturation. Plant Physiology 114, 1166-1180.
Darwin C, Darwin F. 1880. The power of movement in plants. London (UK): J.
Murray.
Detienne P, Jacquet P, Mariaux A. 1982. Manuel d'identification des bois
tropicaux. Tome 3 : Guyane Française.
Digby J, Firn RD. 1995. The gravitropic set-point angle (GSA): the identification of
an important developmentally controlled variable governing plant architecture. Plant, Cell
and Environment 18, 1434-1440.
Favrichon V. 1995. Modèle matriciel déterministe en temps discret : application à
l'étude de la dynamique d'un peuplement forestier tropical humide (Guyane française). Ph.D. thesis. Université Claude Bernard Lyon 1, Lyon (France) [In French].
Fisher JB, Tomlinson PB. 2002. Tension wood fibers are related to gravitropic
movement of red mangrove (Rhizophora mangle) seedlings. Journal of Plant Research 115,
39-45.
Fisher JB. 2008. Anatomy of axis contraction in seedlings from a fire-prone habitat.
American Journal of Botany 95, 1337-1348.
Fournier M, Baillères H, Chanson B. 1994a. Tree Biomechanics: Growth,
Cumulative Prestresses, and Reorientations. In Biomimetics, vol. 2. Plenum Press New York London: Plenum Press, NY.
Fournier M, Chanson B, Thibaut B, Guitard D. 1994b. Measurement of residual
growth strains at the stem surface. Observations of different species. Annals of Forest
Science 51, 249-266.
Fournier M, Stokes A, Coutand C, Fourcaud T, Moulia B. 2006. Tree
biomechanics and growth strategies in the context of forest functional ecology. In Ecology
and biomechanics, eds. A. Herrel T. Speck and N. P. Rowe, pp. 1-33: Taylor & Francis CRC
Press.
Hallé F, Oldeman RAA, Tomlinson PB. 1978. Tropical trees and forests. Berlin:
Springer-Verlag.
Hejnowicz Z. 1997. Graviresponses in herbs and trees: a major role for the
redistribution of tissue and growth stresses. Planta 203.
Humphrey TV, Bonetta DT. 2007. Sentinels at the wall: cell wall receptors and
sensors. New Phytologist 176, 7-21.
Iino M. 2006. Toward understanding the ecological functions of tropisms:
interactions among and effects of light on tropisms. Current Opinion in Plant Biology 9,
89-93.
Ishii R, Higashi M. 1997. Tree coexistence on a slope: an adaptive significance of
trunk inclination. Proceedings of the Royal Society of London 264, 133-140.
Jaouen G, Alméras T, Coutand C, Fournier M. 2007. How to determine sapling
buckling risk with only a few measurements. American Journal of Botany 94, 1583-1593. Kubler H. 1987. Growth stresses in trees and related wood properties. Forestry
Abstracts 48, 131-189.
Leopold CA, Jaffe MJ, Brokaw CJ, Goebel G. 2000. Many modes of movement.
Science 288, 2131 - 2132.
Meskauskas A, Frazer LN, Moore D. 1999a. Mathematical modelling of
morphogenesis in fungi: a key role for curvature compensation (‘autotropism’) in the local curvature distribution model. New Phytologist 143, 387–399.
Meskauskas A, Jurkoniene S, Moore D. 1999b. Spatial organization of the
gravitropic response in plants: applicability of the revised local curvature distribution model to Triticum aestivum coleoptiles. New Phytologist 143.
Mori S, Cremers G, Gracie C. 2002. Guide to the vascular plants of French Guiana.
Part 2: Dicotyledons: Bronx : New York Botanical Garden.
Morita MT, Tasaka M. 2004. Gravity sensing and signaling. Current Opinion in
Plant Biology 7, 712-718.
Moulia B, Coutand C, Lenne C. 2006. Posture control and skeletal mechanical
acclimation in terrestrial plants: implications for mechanical modeling of plant architecture.
American Journal of Botany 3, 1477-1489.
Moulia B, Fournier M. 2009. The power and control of gravitropic movements in
plants: a biomechanical and systems biology viewJournal of Experimental Botany 60, 461–
486.
Niklas KJ. 1999. The mechanical role of bark. American Journal of Botany 86,
465-469.
Ollivier M, Baraloto C, Marcon E. 2007. A trait database for Guianan rain forest
trees permits intra and inter-specific contrasts. Annals of Forest Science 64, 1-6.
Onaka F. 1949. Studies on compression and tension wood. Wood Research 1, 1-88. Rowe NP, Isnard S, Gallenmüller F, Speck T. 2006. Diversity of mechanical
architectures in climbing plants: an ecological perspective. In Ecology and biomechanics, eds. A. Herrel T. Speck and N. P. Rowe, pp. 1-33: Taylor & Francis CRC Press.
Ruelle J, Clair B, Beauchêne J, Prevost MF, Fournier M. 2006. Tension wood
and opposite wood in 21 tropical rain forest species. 2. Comparison of some anatomical and ultrastructural criteria. IAWA Journal 27, 341-376.
Ruelle J, Yoshida M, Clair B, Thibaut B. 2007. Peculiar tension wood structure in
Laetia procera (Poepp.) Eichl. (Flacourtiaceae). Trees 21, 345-355.
Sierra-de-Grado R, Pando V, Martinez-Zurimendi P, Penalvo A, Bascones E, Moulia B. 2008. Biomechanical differences in the stem straightening process among Pinus
pinaster provenances. A new approach for early selection of stem straightness. Tree Physiology 28, 835–846.
Sinoquet H, Rivet P. 1997. Measurement and visualization of the architecture of an
adult tree based on a three-dimensional digitising device. Trees 11, 265-270.
Stankovic B, Volkmann D. 1998. Autotropism, automorphogenesis and gravity.
Physiol Plant 102, 328-335.
Wright IJ, Ackerly DD, Bongers F, Harms KE, Ibarra-Manriquez G, Martinez-Ramos M, Mazer SJ, Muller-Landau HC, Paz H, Pitman NCA et al. 2007. Relationships
Among Ecologically Important Dimensions of Plant Trait Variation in Seven Neotropical Forests. Annals of Botany 99, 1003-1015.
Yamashita S, Yoshida M, Takayama S, Okuyama T. 2007. Stem-righting
Mechanism in Gymnosperm Trees Deduced from Limitations in Compression Wood Development. Annals of Botany 99, 487-493.
Yoshida M, Okuyama T. 2002. Techniques for measuring growth stress.
Holzforschung 56, 461-467.
Yoshida M, Yamamoto H, Okuyama T. 2000. Estimating the equilibrium position
by measuring growth stress in weeping branches of Prunus spachiana Kitamura f. spachiana cv. Plenarosea. Journal of Wood Science 46, 59-62.
Tables
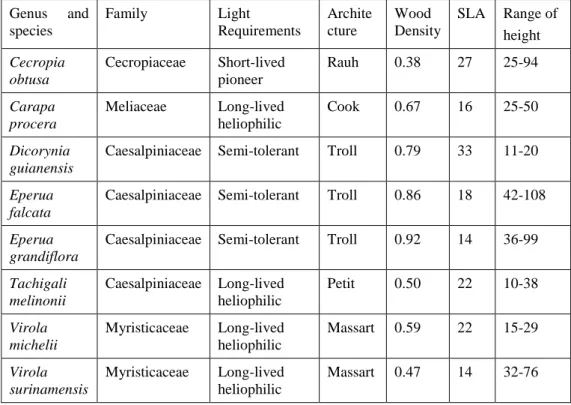
Table 1. Botanical names, light requirements (Favrichon, 1995), mean wood density (at 12%
moisture content) and specific leaf area (SLA, m2/kg) (from Detienne et al., 1982; Ollivier et
al., 2007), architectural model (Hallé et al., 1978) and range of height (cm) of the studied
seedlings. Genus and species Family Light Requirements Archite cture Wood Density SLA Range of height Cecropia obtusa Cecropiaceae Short-lived pioneer Rauh 0.38 27 25-94 Carapa procera Meliaceae Long-lived heliophilic Cook 0.67 16 25-50 Dicorynia guianensis
Caesalpiniaceae Semi-tolerant Troll 0.79 33 11-20
Eperua falcata
Caesalpiniaceae Semi-tolerant Troll 0.86 18 42-108
Eperua grandiflora
Caesalpiniaceae Semi-tolerant Troll 0.92 14 36-99
Tachigali melinonii Caesalpiniaceae Long-lived heliophilic Petit 0.50 22 10-38 Virola michelii Myristicaceae Long-lived heliophilic Massart 0.59 22 15-29 Virola surinamensis Myristicaceae Long-lived heliophilic Massart 0.47 14 32-76
Table 2. Comparison of 5 simplified formulae used in the calculation of the modulus of
elasticity in a bending test on a tapered stem segment. Results with each formula are compared to the results obtained from the full numerical computation.
Formula for the representative I R² Slope
(1) 4 1 1 1 64 78 9 A B C =
D
= n k k D n I π 0.969 0.931 (2)D
= = n k k D n I 1 4 2 64 π 0.920 0.856 (3) 7 8 9 A B C =D
= n k k D n I 1 4 3 1/ 1 / 64 π 0.909 1.080 (4) 2 1 1 4 2 64 12 3 4 5 6 + = n n D D D D I π 0.766 0.894 (5) 4 2 / ) 1 ( 5 64 + = Dn I π 0.976 0.988Table 3. Mean change in tangent angle at the base and efficiency of the gravitropic curving
process for each species during the two first months of observation (S-E is the standard error). Gravitropic efficiency is estimated from the slope of the relation in figure 4 according to equation 4. The linear relation between growth and change in curvature is highly significant for all species except E. falcata (n.s.: p>0.05, **: p<0.01, ***: p<0.001). Letters indicate significant differences between species (the er is not significantly different at the
95% level for species sharing the same letter).
Change in tangent angle at the base (°)
Apparent gravitropic efficiency (10-3m/m) Mean S-E R² erapparent S-E
Cecropia obtusa 7.2 2.5 0.06*** 9.47cd 2.40 Carapa procera 1.2 0.6 0.36*** 4.92b 0.58 Dicorynia guianensis 2.8 1.5 0.11** 7.89bcd 3.04 Eperua falcata 1.6 1.5 0.00 n.s. -0.06a 0.26 Eperua grandiflora -0.1 1.1 0.11*** 8.14c 1.46 Tachigali melinonii 10.6 3.6 0.26*** 14.9d 2.95 Virola michelii 1.5 1.8 0.31*** 8.12cd 1.55 Virola surinamensis 0.0 0.7 0.36*** 11.9cd 1.04
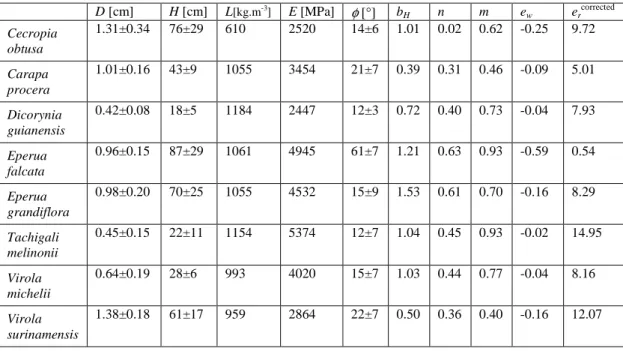
Table 4. Mean (± standard deviation) morphological and mechanical traits of the species
measured at the end of the observation period, and computed values of gravitropic efficiency
(ercorrected) accounting for the weight increment correction (ew). D: diameter at the base, H:
height, L: load ratio, E: modulus of elasticity, φ: tilt angle (from vertical), bH: ratio of relative
height growth to relative diameter growth, n: taper exponent, m: load distribution exponent.
D [cm] H [cm] L[kg.m-3] E [MPa] φ [°] b H n m ew er corrected Cecropia obtusa 1.31±0.34 76±29 610 2520 14±6 1.01 0.02 0.62 -0.25 9.72 Carapa procera 1.01±0.16 43±9 1055 3454 21±7 0.39 0.31 0.46 -0.09 5.01 Dicorynia guianensis 0.42±0.08 18±5 1184 2447 12±3 0.72 0.40 0.73 -0.04 7.93 Eperua falcata 0.96±0.15 87±29 1061 4945 61±7 1.21 0.63 0.93 -0.59 0.54 Eperua grandiflora 0.98±0.20 70±25 1055 4532 15±9 1.53 0.61 0.70 -0.16 8.29 Tachigali melinonii 0.45±0.15 22±11 1154 5374 12±7 1.04 0.45 0.93 -0.02 14.95 Virola michelii 0.64±0.19 28±6 993 4020 15±7 1.03 0.44 0.77 -0.04 8.16 Virola surinamensis 1.38±0.18 61±17 959 2864 22±7 0.50 0.36 0.40 -0.16 12.07
Figure legends
Figure 1. Assessment of the method for the computation of the modulus of elasticity (MOE)
in a bending test on a tapered segment. Each series corresponds to a simplified formula used in the calculation of the second moment of area I in equation (1) (see text for details), and is plotted as a function of the full numerical calculation taking the real taper into account.
Figure 2. a- Representation of the mean up-righting dynamics of the tilted seedlings. Each
point represents the mean distal angle of a species plotted against the mean proximal angle (angles are relative to vertical). Different species are figured by different symbols, and successive dates (separated by 2 weeks) are figured by dots of different grey levels, showing specific trajectories. White dots refer to the start of the experiment, and black dots to the end. The black diagonal line represents straight stems, i.e., stems for which the proximal and the distal angle are equal. Any stem below this line is curved downward, and any stem above this line is curved upward. Gray diagonal lines represent trajectories such that the proximal angle and the distal angle change at the same rate. Any trajectory above the diagonal implies an upward change in curvature along the stem. A trajectory below the diagonal indicates a downward change in curvature.
b- Visual illustration of the changes in shape of a stem corresponding to a vertical trajectory
from A to B and C, followed by a diagonal trajectory from C to D and a horizontal trajectory from D to E and F.
Figure 3. Three examples of up-righting dynamics involving a counter-curving process in
the distal part. Upper charts show the shape of the stems in a vertical plane at different dates (units = cm). Lower charts show the field of curvature along the stems at the same dates (unit = rad/cm). At the beginning of the up-righting movement, the curvature increases at all levels in the stem. At the last dates, the curvature still increases in the proximal parts of the stem, but starts decreasing in the distal parts.
Figure 4. Relationship between changes in curvature and diameter growth. Each plot is
relative to a species, and each dot is relative to a point along a stem where both diameter and curvature were measured. Horizontal axis: normalized change in diameter 1/Di−1/Df, where
Di [cm] is the diameter at the beginning of the observation time and Df [cm] is the diameter
two month after. Vertical axis: sum of absolute changes in curvature counted every two weeks [rad/cm] during the same time. The slope is proportional to the gravitropic efficiency of the species er (see equation 3). Regression results are gathered in table 3. All plots are in
Figure 1
0 2000 4000 6000 8000 0 2000 4000 6000 8000Reference MOE (MPa) 1 2 3 4 5 M O E ( M P a ) fr o m s im p lif ie d f o rm u la e 1 -5
Figure 2
a- 0 15 30 45 60 75 90 105 120 0 15 30 45 Cecropia ob tusa Carapa procera Dicorynia guianensis Eperua falcata Eperua grandiflora Tachigali melinonii Virola michelii Virola surinamensis A D E C F B b- A B C D F EAngle of the distal part (°/ vertical)
A n g le o f th e p ro x im a l p a rt ( °/ v e rt ic a l)
Figure 3
a- Cecropia obtusa b- Virola michelii c- Virola surinamensis
-0.01 0.00 0.01 0.02 0 20 40 60 80 0 20 40 60 80 0 20 40 60 80 08/02 22/02 21/03 05/05 -0.03 0.00 0.03 0.06 0 10 20 30 0 10 20 30 0 10 20 30 08/02 22/02 21/03 05/05 -0.01 0.00 0.01 0.02 0 20 40 60 80 0 20 40 60 80 0 20 40 60 80 08/02 22/02 21/03 05/05
d- Tachigali melinonii e- Eperua grandiflora
-0.06 -0.03 0.00 0.03 0 10 20 30 40 0 10 20 30 40 0 10 20 30 40 08/02 22/02 21/03 05/05 -0.06 -0.03 0.00 0.03 0 10 20 30 40 50 0 10 20 30 40 50 0 10 20 30 40 50 08/02 22/02 21/03 05/05
Position along the stem (cm)
L o c a l c u rv a tu re S te m s h a p e
Position along the stem (cm)
S te m s h a p e L o c a l c u rv a tu re