https://doi.org/10.4224/40001909
Vous avez des questions? Nous pouvons vous aider. Pour communiquer directement avec un auteur, consultez la
première page de la revue dans laquelle son article a été publié afin de trouver ses coordonnées. Si vous n’arrivez pas à les repérer, communiquez avec nous à [email protected].
Questions? Contact the NRC Publications Archive team at
[email protected]. If you wish to email the authors directly, please see the first page of the publication for their contact information.
https://publications-cnrc.canada.ca/fra/droits
L’accès à ce site Web et l’utilisation de son contenu sont assujettis aux conditions présentées dans le site LISEZ CES CONDITIONS ATTENTIVEMENT AVANT D’UTILISER CE SITE WEB.
READ THESE TERMS AND CONDITIONS CAREFULLY BEFORE USING THIS WEBSITE.
https://nrc-publications.canada.ca/eng/copyright
NRC Publications Archive Record / Notice des Archives des publications du CNRC :
https://nrc-publications.canada.ca/eng/view/object/?id=e4660701-e417-4ab9-8f3b-e1358e372511 https://publications-cnrc.canada.ca/fra/voir/objet/?id=e4660701-e417-4ab9-8f3b-e1358e372511
NRC Publications Archive
Archives des publications du CNRC
For the publisher’s version, please access the DOI link below./ Pour consulter la version de l’éditeur, utilisez le lien DOI ci-dessous.
Access and use of this website and the material on it are subject to the Terms and Conditions set forth at
Canadian energy storage report: 2017 case study for the Alberta market
Regoui, Chaouki; Baker, Ryan; Gonzales-Calienes, Giovanna; Shi, Steven;
Grinberg, Yuri; Kannangara, Miyuru; Malek, Kourosh; Wang, Qianpu;
Energy Storage for Grid Security and Modernization
Canadian Energy Storage Report:
2017 Case Study for the Alberta Market
Prepared by:Chaouki Regoui, Ryan Baker, Giovanna Gonzales-Calienes, Steven Shi, Yuri Grinberg, Miyuru Kannangara, Kourosh Malek, Qianpu Wang, Farid Bensebaa, Adam Tuck, Will Skrivan
Project: A1-010127
Document #: NRC-EME-55956
© 2020 National Research Council of Canada, All rights reserved. No part of its contents may be used, copied, disclosed or conveyed to any party in any manner, in whole or in part, whatsoever without prior written permission from the NRC.
Elements of this document, or information used in the analysis contained in this report, were provided by collaborators who are part of the contributing partners committee. Their contributions to this report are greatly appreciated, and include data or authors from:
Acelerex
Alberta Innovates and Solas Energy Consulting Rocky Mountain Power Inc.
WEICAN
Review of this document was provided by the advisory board. Their contributions are greatly appreciated.
Note that this report reflects the beliefs and opinions of the NRC authors based on best available information at the time of writing. This report does not necessarily represent the views of the advisory board members, their affiliated organization, or any other stakeholder groups.
ii
Preface
Added August 30, 2019
Since the time the analyses described in this Alberta Chapter study were performed, significant changes to energy policy and environmental regulations in Alberta have been implemented. Some of the specific changes in policies/regulations and their anticipated impacts on the inputs and results of these analyses are listed in the table below.
Policy Key Change Since
Time of This Analysis
Estimated Impacts of Change to Analysis Results
Renewable
Electricity Program (REP)
Announcement that there are no future rounds of REP1
The report assumptions are based on future rounds of REP which are no longer planned.
Without the REP, there would be less incentive to develop renewable generation in the Alberta grid. In terms of the impacts for this analysis, removing the REP increases the uncertainty in the future state of the g id used i Pilla s odel. However, in the longer term, for example 2027 and beyond, the technology cost of ES is expected to decrease. It is anticipated that some ES projects would be able to compete with a conventional generation fleet in Alberta as they offer grid stability and resilience benefits that conventional generation cannot. In Pillar 2, individual ES systems were modelled first in Use Cases or Grid Service Bundles without, and then with, a Capacity Market. Also, those Use Cases were repeated in a sub scenario without, and then with, Transmission Deferral. Transmission Deferral is an option to deal with capacity additions in the AESO 2017 LTO to transmission-constrained regions. So at the project or individual ES level in Pilla , the p ese e / a se e of the ‘EP does t affect the simulation results with or without a Capacity Market. Also unchanged are the
T a s issio Defe al su s e a io s esult trends related to markets / services opportunity cost and long vs short duration ES. However, the exact impact on the discrete results of the Transmission Deferral sub scenario is unknown.
iii Capacity Market Announcement on
July 24, 2019 that the energy-only market will continue and there will not be a transition to a capacity market2
At the time of the study, a capacity market in Alberta was being evaluated and designed. In Pillar
s odel, the effe ts of apa it a ket e e referenced from other jurisdictions in North
America where a capacity market was in effect. As a capacity market offers a potential additional
revenue stream for qualifying ES projects, the continuation of the energy-only market could decrease the number of potential ES projects by 20% in Alberta over our study period3.
In the Pillar 2 analysis, comparing all E“ NPV s ith and without a Capacity Market, NPV decreases on average 24% (+/- 10%). Although a Capacity Market increased NPV for all ES modelled in Pillar 2, it did t ha ge hether or not that NPV was a profit or a loss. Therefore, revenue from a Capacity Market was significant, but as t a a ho se i e . Fi a ial esults ithout a d ith a Capacity Market are shown in Tables 2-17 and 2-18, and in Figures 2-2 to 2-4.
Carbon Tax Repealed on May 30, 20194
I Pilla s odel, the a o ta i pa ts the generation mix of the model. As part of the Alberta Carbon Tax, the Carbon Levy was officially repealed on May 30, 2019. This reduced the fuel cost of conventional thermal-based generation in Alberta. This policy change was evaluated in this analysis in the +/- 40% fuel cost scenarios.
The CCIR is still in effect in Alberta, and therefore adds constraints to conventional thermal-based generation to be developed in the future. The CCIR is apped to the Ca o Ta pa a ete i ou study model and assumed to have a value of $30 per metric tonne.
2 https://www.aeso.ca/market/capacity-market-update/
3 The potential 20% decrease in the number of potential ES projects is based on the information collected for
this study regarding the preliminary design of the planned Capacity Market framework for Alberta. It assumes that only an energy storage system with a minimum 4-hour duration will be qualified to participate in the then pla ed Capa it Ma ket. Fo the pote tial E“ p oje ts of the pilla s output, o l of the lo g-duration potential ES projects (see Appendix 6.1) qualify to participate in the planned Capacity Market. The continuation of energy-only market will reduce the revenue stream for those potential projects, but may or may not impact the deployment of the potential project.
iv
In Pillar 2, a carbon tax was not included in the analysis; hence, repealing the Carbon Tax does not change the simulation results.
After an in-depth internal analysis of the impacts of these recent policy/regulations summarized above, it is the opinion of the authors that the results presented in this report are still valid and relevant. The goal of this initiative is to perform objective, comprehensive analyses of the opportunities for Energy Storage in Canada, acknowledging, and attempting to account for, the rapidly changing energy and environmental landscapes. In addition, the methodology and analytical framework presented are intended to be adaptable and open to a wide range of inputs. Therefore, the same framework can be replicated for other provinces, as originally planned for the ES study initiative, to create a consistent basis of analyses. Most importantly, this report is intended to provide information and data that can be used to support informed discussions among a diverse range of stakeholders. The authors believe it still supports that purpose.
i
Executive Summary
Canada is in the enviable position of being relatively rich in natural resources, and has one of the cleanest, least expensive and most reliable electricity grids in the world. However, an increase in the integration of renewables, a rise in smart grid technologies, and changes in demand and policies at a national and provincial level have created an increased awareness that fundamental changes in the way we build, own and operate our electricity systems may be required, and in many cases, are well underway. Many studies, organizations and experts worldwide have concluded that these changes provide a perfect opportunity for energy storage (ES) technologies to demonstrate their value in supporting energy security and climate change goals, as well as creating a more integrated and optimized energy system. However, given the complexities of the analysis and the marketplace, few comprehensive studies exist at a national or provincial level that comprehensively address the market potential and costs and benefits, in addition to the economic and environmental impacts of
significant ES utilization.
Understanding the potential value of ES may help provide cost effective solutions for secure and reliable electric grids, and may also provide opportunities as an economic engine to drive the global competitiveness of
Canadian energy products and home-grown expertise. However, most studies undertaken to date have reviewed ES on a project-by-project basis, which makes it difficult to ascertain the full value and costs of implementing the technology. It is within this context that the NRC, through its Energy Storage for Grid Security and Modernization program, has undertaken the development of a Canadian Energy Storage Study, with support and input from the following: N‘Ca s Offi e of E e g ‘esea h a d De elop e t OE‘D , st ategi partners and consultants, stakeholders across the value chain, and an expert advisory board. This study, consisting of analysis in three pillars (areas of study) is intended to provide a neutral and independent analysis jurisdiction by jurisdiction across Canada that outlines the potential costs and benefits of the adoption of ES technologies. The authors make no policy recommendations in this report. Any conclusions and results should not be interpreted as policy advice. The data and results are meant to support a range of conversations and calculations beyond the scope of this study.
This study contains the general framework for all jurisdictions, as well as the detailed analysis for Alberta. As the preliminary release of the study, it is expected that the framework and the Alberta chapter will be updated in
Pillar 1 - Grid Needs and ES
Market Opportunity
• Identify ES use cases
• Define specific application
requirements
• Identify the impacts on
grid power planning and
operations
• Review the current market
structure
Pillar 2 - Technology
Assessment and Valuation
• Assess ES technologies and
trends
• Match technology and
application requirements
• Propose valuation and
performance frameworks
• Evaluate individual ES
profitability and dispatch
on the electricity grid
Pillar 3 - Environmental and
Socio-Economic Assessment
• Assess environmental and
socio-economic metrics
• Assess GHG emissions at
the grid level
• Compare life cycle GHG
emissions of ES
ii
the future to take into account further refinements based on stakeholder feedback as other jurisdictions proceed, as well as reflect any specific regulatory or technical changes that occur over the duration of the project. Subsequent provinces will be completed independently, due to the varied nature of the markets, generation and supply mix, and providers/technologies used in each market. However, the overall framework will be consistent, and will leverage learning, both across Canadian jurisdictions, and from other early ES markets.
Pillar 1 - Grid Needs and ES Market Opportunity
The 2017 Long Term Outlook report published by Alberta Electric System Operator (AESO) states that Alberta will need significant new investment in electricity generation by 2030 to support the transition toward cleaner sources of energy and meet the electricity needs of a growing province. As one of the most deregulated ele t i it a kets i Ca ada, Al e ta s ge e atio i by capacity in 2019 consists of approximately 38% Coal, 45% Natural Gas (30% Cogeneration, 10% Combined Cycle, 5% Simple Cycle), 5% Hydro, 9% Wind and 3% Other. The AESO began operating the current energy generation market structure in January 2001, which currently consists of a physical clearing market for all wholesale electricity. In addition to generation, the system is also comprised of regulated transmission and distribution components, as well as a partially deregulated retail component.
This study includes a scenario with a capacity market in Alberta for the purposes of exploring market mechanisms which could impact the adoption of ES technologies. While Alberta currently has no plans to establish a capacity market, the authors felt that this analysis was still valuable to include because it helps to evaluate the business case for various ES technologies under different scenarios. While several initiatives are underway at the AESO and Alberta Energy to manage a transition away from coal, such market changes certainly have the potential to affect wholesale price volatility and impact the adoption of ES technologies.
Following a production cost modelling approach, optimized for ES analysis without preference to technology, the main findings of this pillar are that selected ES technologies are increasingly attractive for a number of specialized power grid uses, such as
operating reserves. The capacity market included in the scenario analysis would increase the value of benefits and project NPV for all ES technologies evaluated, making the energy and capacity markets the second-largest ES benefit after operating reserves. None of the ES services currently possible on Alberta's grid are found to be cost-competitive enough to support a
transformational change in Alberta's energy sector away from coal. With consideration to the expected load growth in Alberta and generation retirement / development plan, a scenario of approximately 1152 MW of ES deployment is presented which has a potential net benefit of $155M. This analysis found that
electricity prices exhibit less volatility when ES systems are deployed in the bulk electric system. Finally, the cost
Key Findings in Pillar 1
• Deploying approximately 1152MW of ES in the Alberta Integrated Electric System (AIES) will help reduce the impact of fuel price volatility and will create a potential net benefit of $155M.
• The cost of ES technology has a significant impact on ES deployment. A 40% reduction in the cost of ES technology will yield a 60% increase in ES deployment.
• Considering load growth in Alberta and the generation retirement/development plan, the costs of ES deployments will become
comparable to conventional generation sources in 2024.
iii
of ES technology has a significant impact on its level of market penetration – a 40% reduction in ES costs is estimated to yield a 60% increase in ES deployment.
Pillar 2 – Technology Assessment and Valuation
Although at the system-level the AIES operation can be optimally designed to accept ES systems at certain nodes, with certain technology attributes and costs, it is not guaranteed that these deployments of individual storage technologies are equally economically or technically optimized at a project-level. Thus while the analysis in Pillar 1 is technology-agnostic and takes a system level approach to aggregated ES on the AIES, the analysis in Pillar 2 is performed at the project level. It simulates an individual ES technology operating on the AIES with the aim to determine which technologies outlined in Pillar 1 are viable under current and proposed regulation and market guidelines.
In the Pillar 2 analysis, three ES technologies were evaluated that are representative of the more
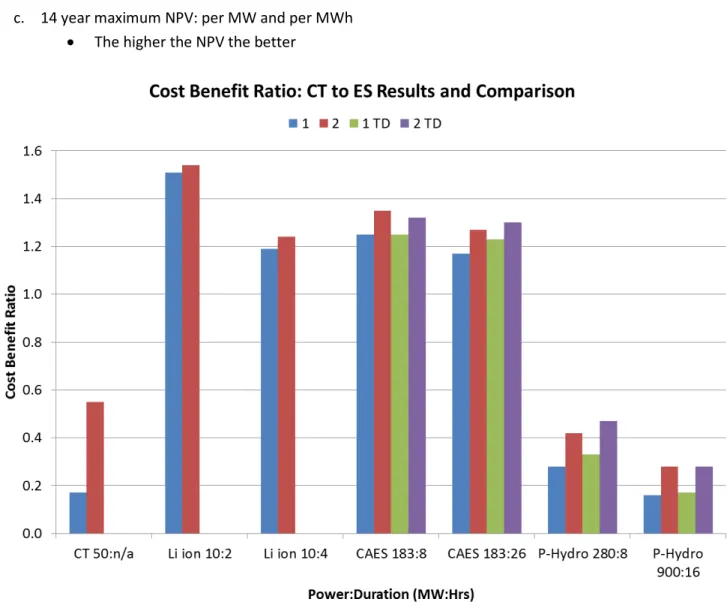
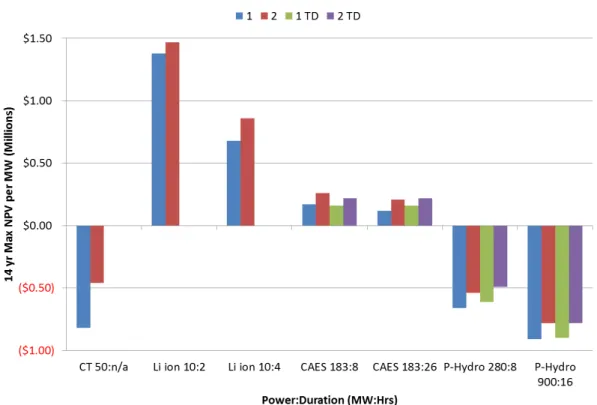
cost-competitive and mature ES options and for which cost and data sets were available from the U.S. DOE: Lithium-ion (Li-Lithium-ion), Compressed Air Energy Storage (CAES), and Pumped Hydro (P-Hydro). Results are based on given technology lifetimes first normalized to the 14-year study period to select ones for further analysis. Evaluation results were categorized into profitability and dispatch. Second, profitability was further broken down into cost-benefit ratio or Return on Investment (ROI), and Net Present Value (NPV), but over the entire technology lifetime. The greatest ROI was 1.54 or 54% for 15-year Li-io MW H pa ti ipati g i oth AE“O s u e t Energy Market and Ancillary Services Market (except Load Shed Service for imports and Transmission Must Run / Dispatch Down Service) and the estimated Capacity Market. The greatest NPV was $137M for 40-year ($48M normalized to the 14 year study period) CAES 183MW 8Hr participating in the same markets and services. Three factors that significantly impacted ROI and NPV profitability were technology, markets and services, and financial structure. Regarding technology, cost reductions for Li-ion meant that a one-time stack replacement cost does not significantly impact overall profitability. However, longer technology lifetimes increase multiple major maintenance and repair costs for CAES and P-Hydro, which are mature technologies and do not have significant cost declines.
Key Findings in Pillar 2
• In terms of profitability, without including the AESO Tariffs, ES valuation analysis showed the largest ROI of 1.54 for Li-ion (10MW, 2Hr) and largest Net Present Value of $137M for CAES (40-year 183MW, 8Hr), both operating in Alberta's Markets and Services including the estimated Capacity Market.
• Within Alberta's Markets and Services, Operating Reserves (OR) dominated revenue streams among the three ES technologies evaluated. All three ES technologies also benefitted from participating in the estimated Capacity Market.
• To be profitable, ES must match price and load requirements of markets and services in
iv
Higher P-Hydro capital costs relative to those of CAES meant that even for similar energy ratings, P-Hydro was unprofitable (CAES 183MW 8Hr or 26 Hr compared to P-Hydro 280MW 8Hr). Regarding markets and services, price and load data significantly impact the
requirements for ES technology response time and the optimal capacity and duration ratings. Of the markets and services studied, proportionately, the largest benefits were from Operating Reserves (OR). It follows that ES technologies that could participate in one or more OR services captured the most benefits, contributing to profitability. OR Regulating dominated for fast response ES such as Li-ion, and OR Contingency Supplemental dominated for slower response technologies such as CAES. All ES technologies participating in the estimated Capacity Market showed an increase in profitability, although not as large as for OR. Increasing the duration of a simulated CAES system (183MW capacity) from 8Hrs to 26Hrs increased revenues within the Transmission Deferral sub scenario, but at the expense of overall NPV. Hence there is an opportunity cost because the main value is in shorter duration services and longer ES duration does not support the increase in capital cost. Switching to P-Hydro, when o pa ed to Pilla s a i u E“ a ket size of MW . H , the energy of the 900MW 16Hr P-Hydro unit made it larger than the energy de a d f o AIE“ E e g Ma kets a d A illa Services, rendering that P-Hydro unit unprofitable. Regarding financial structure, a 12% Return on Equity (ROE) made Capital Expenditures (Equity) the largest cost for the combustion turbine (CT) and ES technologies studied. A high ROE coupled with the longer lifetime, larger capacity, and higher capital cost of P-Hydro ES technologies meant their Capital Expenditure (Equity) costs increased faster than their revenues.
It was found that long duration markets and services have the highest ES usage, however, these do not necessarily generate the largest revenues. Multiple sub-hourly grid services such as OR can provide the largest revenues. However, in the case of Li-ion Regulating Reserves, they can pose the risk of significant wear and tear on the system, possibly reducing stack lifetime. In the case of Li-ions cycle counts and Depth of Discharge (DoD), the largest number of cycles was at DoDs that corresponded to sub-hourly dispatch (3% DoD) and at least hourly dispatch (20% and 40% DoD) for various grid services. These hourly and sub-hourly services potentially reducing stack lifetime were represented by the combined effects of participating in operating reserves, energy and capacity markets.
Pillar 3 - Environmental and Socio-Economic Assessment Economy
Many industry reports predict ES costs to decrease significantly over the next five years, driven by scale and related cost savings, improved standardization and technological improvements, and supported in turn by increased demand as a result of regulatory / pricing innovation, high renewables penetration, interests in system operators to seek non-wires solutions, and the needs of an aging and changing power grid in the context of a modern society.
As global ES markets continue to evolve, several potential sources of revenue available to ES systems have emerged, and ultimately, the mix of available revenue streams for a particular ES system varies significantly across jurisdictions.
terms of response time, capacity, and duration.
• Co pa i g all NPV s ith a d ithout a Capacity Market, NPV decreases on average 24% (+/- 10%). Although a Capacity Market increased NPV for all ES modelled in Pillar 2, it did t ha ge hethe o ot that NPV as a profit or a loss.
v
Regarding the socio-economic impacts of ES deployment, most economic impacts are generated during the construction phase, similar to the impacts that occur during the deployment of renewable energy projects. During the construction phase, ES projects are expected to create 2,853 jobs from 2021 to 2030 (based on Pillar 3 analyses described in this report). However, the economic impact is likely to be lower than the economic impact in, for example, solar PV projects, as ES systems are usually modular and imported with lower construction-phase costs.
Environment
The projected incremental environmental benefits from ES deployment in the Alberta electricity system are not significant in comparison to the projected GHG
emissions reductions of the Alberta electric grid from 2017 to 2030 due to other factors including coal phase-out and renewable energy additions. The grid-level GHG emissions without ES decrease by 45% while system-level GHG emissions with ES decrease by 46%.
The comparative life cycle GHG impact between Li-ion battery systems and CAES systems indicates that Li-ion battery systems are more environmentally friendly than CAES systems, and Li-ion batteries generate
approximately 22% - 24% less GHG emissions than CAES systems.
The overall contribution of the operations stage to the overall life cycle impact depends upon the round-trip efficiency alongside the changes on the power-grid mix. In the case of CAES systems, it is predicted that CAES has noticeably higher emissions during the operations phase, when emissions originate from natural gas combustion during system operations and are exacerbated by low CAES system round-trip efficiency.
Due to the cradle-to-gate impact, further study is recommended to perform a comparative analysis of GHG life cycle impact on ES systems for different ES technologies and grid services. GHG use-phase impact is affected by the variations in emission intensities in the power-grid mix when the ES system is charged and discharged according to a specific grid service requirement.
Résumé
Le Ca ada a de uoi se joui , a il est elati e e t i he e essou es atu elles et dispose d u des seau le t i ues les plus p op es, les oi s he s et les plus fia les au o de. Pou ta t, l e ploitatio oissa te des énergies renouvelables, lesso des te h ologies de seau le t i ues i tellige ts et l olutio de la de a de et des politi ues atio ales et p o i iales o t sus it u e o s ie tisatio a ue su le esoi d appo te des changements fondamentaux dans la manière dont nous construisons, possédons et exploitons nos systèmes
le t i ues. Da s u g a d o e de as, es ha ge e ts so t d ailleu s la ge e t e ta s. De o eu tudes, o ga isatio s et sp ialistes da s le o de o t o lu ue de tels ha ge e ts o stitue t l occasion e de o t e l utilit des te h ologies de sto kage de l e gie “E , o seule e t da s la alisatio des o je tifs li s à la s u it de l e gie et au ha ge e t li ati ue, ais aussi da s la ge se d u i uit de
Key Findings in Pillar 3
• The incremental GHG benefits from ES deployment are negligible in comparison to the projected GHG emissions reductions of the Alberta electricity system from 2017 to 2030 from new renewables and coal phase-out. The grid-level GHG emissions decrease annually by an average of 4% from the previous year.
• The GHG life cycle impact of Li-ion battery ES systems are mostly due to the emissions during manufacturing (cradle-to-gate stage) of the ES system components, specifically the battery pack.
vi
l e gie opti is et ieu i t g . Malheu euse e t, fa e au o ple it s de l a al se et du a h , peu d tudes atio ales ou p o i iales e a i e t de faço e hausti e les a a tages et les oûts pote tiels du “E, sa s pa le de so i pa t su l o o ie et l e i o e e t.
P ise la aleu e tuelle du “E ous aide ait à appo te des solutio s e ta les pou des seau d le t i it sûrs et fiables. Parallèlement, un tel exercice mettrait en relief les possibilités du SE en tant que moteur
o o i ue sus epti le d a oît e la o p titi it des p oduits e g ti ues a adie s et de l e pe tise lo ale da s le o de. Toutefois, la plupa t des tudes alis es jus u à p se t e se pe he t ue su des p ojets pa ti ulie s, si ie u il est diffi ile d ta li glo ale e t la aleu et le oût de la ise e œu e des te h ologies de “E. C est da s e o te te ue le CN‘C, pa le t u he e t de so p og a e « “to kage d e gie pou la s u isatio et la ode isatio des seau », a e t ep is u e tude su le sto kage de l e gie au Ca ada. Il a pou ela fi i de l aide et de l appo t du Bu eau de e he he et de
d eloppe e t e g ti ues B‘DE de ‘NCa , de pa te ai es st at gi ues et d e pe ts-conseils, des i te e a ts de toute la haî e de aleu et d u e o issio o sultati e d e pe ts. L tude po te su t ois axes (champs de recherche) et avait pour but de brosser un tableau objectif et indépendant des avantages et i o ie ts pote tiels de l adoptio des te h ologies de “E au Ca ada, da s ha ue p o i e ou territoire. Les auteurs ne formulent aucune recommandation. Leurs conclusions ou résultats ne devraient en aucun cas
t e i te p t s o e des o seils pou o ie te les politi ues pu li ues. Ils o t d aut e ut u ali e te la discussion et pousser la réflexion au-delà des o je tifs i diats de l tude.
Cette tude p opose u ad e g al pou toutes les o p te es, ai si u u e a al se d taill e de la situatio e Al e ta. Puis u il s agit de sa p e i e outu e, le ad e et la pa tie su l Al e ta devraient ult ieu e e t t e peaufi s d ap s les o e tai es fo ul s pa les i te e a ts à esu e ue les
o p te es s i pli ue t ai si u e fo tio de la a i e do t les te h i ues et la gle e tatio olue t durant le projet. Plus tard, on brossera un portrait distinct de la situation dans les autres provinces, car la nature du a h a ie, de e ue le la ge des apa it s de p odu tio et des sou es d app o isio e e t, et les fournisseurs/technologies qui composent le marché. Le cadre général restera cependant le même et sera
o ifi pa les e seig e e ts ti s des di e ses o p te es a adie es, de e ue d aut es d ou h s initiaux du SE.
1er axe — Besoi s du réseau d’éle tri ité et dé ou hés possi les pour le SE
1
eraxe
— Besoins du réseau
et débouchés possibles
pour le SE
•Établir les utilisations du SE •Préciser les contraintes
d'ordre pratique •Établir l'impact sur la
planification et l'exploitation du réseau
•Examiner la structure actuelle du marché
2
eaxe
— Évaluation et
appréciation des
technologies
•Évaluer les technologies de SE et les tendances
•Jumeler les technologies aux contraintes pratiques
•Proposer un cadre pour l'évaluation et le rendement •Déterminer le seuil où une
technlogie devient rentable ou pas dans le réseau
3
eaxe
— Retombées
environnementales et
socioéconomiques
•Évaluer les paramètresenvironnementaux et socioéconomiques
•Déterminer la quantité de GES libérée par le réseau
d'électricité
•Comparer le cycle de vie des émissions de GES des technologies de SE
vii
Le appo t de su les pe spe ti es à lo g te e pu li pa l Al e ta Ele t i “ ste Ope ato AE“O i di ue ue ette p o i e de a i esti de faço app ia le da s la p odu tio d le t i it d i i à 2030 pour faciliter le passage vers des sources oi s pollua tes tout e satisfaisa t la de a de d le t i it d u e populatio e plei e oissa e. L u des a h s les plus d gle e t s du pa s, le a h al e tai de l le t i it de se a a t isait pa u e apa it de p odu tio ui se partit comme suit : 38 % du charbon, 45 % du gaz naturel (30 % pour la production combinée, 10 % pour la production par cycle combiné et 5 % pour la production par cycle simple), 5 % de l h d o le t i it , % du vent et 3 % d aut es sou es. L AE“O a comme à e ploite la st u tu e a tuelle du a h de la p odu tio d e gie e ja ie , ui o siste a tuelle e t e u ajuste e t du a h e fo tio de l off e et de la de a de pou toute l le t i it vendue en gros. Outre la production, le système comprend également des composantes de transport et de dist i utio gle e t es, ai si u u e o posa te de d tail pa tielle e t d gle e t e.
L tude o p e d u s a io da s le uel l Al e ta est dot e d u a h de p odu tio , le ut ta t
d e plo e les a is es ui pou aie t i flue su l adoptio des te h ologies de “E. Bie ue la p o i e e a esse a solu e t pas l i te tio de passe à u a h de p odu tio pou l i sta t, les auteu s oie t
u u e telle a al se p se te de l i t t, a elle fa ilite l aluatio de di e ses te h ologies de “E da s diff e tes situatio s. Quoi ue l AE“O ait la plusieu s i itiati es et ue l o ga is e pu li Al e ta E e g doi e g e le passage du ha o à de ou elles sou es d e gie, ul e iera que des changements de ce ge e, su le a h , au o t u e i flue e su la olatilit du p i de g os et su l adoptio des te h ologies de SE.
Lo s ue l o e ou t à u od le ui epose su le oût de p odu tio , opti is pou l a al se du “E, toutes technologies confondues, on constate que certaines technologies présentent de plus en plus d att ait pou des a ti it s p ises, asso i es au seau d le t i it , e t e aut es les se es d e ploitatio . Le a h de p odu tio , à la ase du s a io de l a al se,
valoriserait les avantages et augmenterait la valeur actualisée nette (VAN) prévue de toutes les
technologies de SE examinées. Le marché de production et elui de l e gie e olte aie t les plus g a ds fruits, après les réserves d e ploitatio . Au u des services de SE qui pourraient voir le jour sur le réseau al e tai est assez concurrentiel pour amener un
ha ge e t ui t a sfo e ait le se teu de l e gie p o i ial e l aff a hissa t du ha o . Compte tenu de la hausse de la charge prévue dans la province et des p ojets de d eloppe e t/d saffe tio d i stallatio s de p odu tio , le s a io e isage le d ploie e t d i stallatio s apa les de sto ke e i o MW d le t i it , a e u fi e et pote tiel de 155 M$. L a al se i di ue ue le d ploie e t de s st es de sto kage d e gie à la g a deu du seau, ou p es ue, e d ait le p i de l le t i it oi s olatil. E fi , le
Principales constatations du 1
eraxe
• Le d ploie e t d i stallatio s apa les de
sto ke e i o
MW
d le t i it
da s l Al e ta I teg ated Ele t i “ ste
(AIES) rendrait le prix des combustibles
moins volatil et engendrerait un bénéfice
net potentiel de 155 M$.
• Le coût de la technologie de SE a un
impact notable sur son déploiement. En
réduisant ce coût de 40 %, le déploiement
s la gi ait de %.
• Étant donné la progression de la demande
en Alberta et les plans de développement
ou de désaffection des installations de
production, en 2024, il en coûtera autant
pour déployer une technologie de SE que
pou
p odui e de l le t i it de la
viii
coût de ces technologies influe de manière notable sur leur degré de pénétration sur le marché. Ainsi, une baisse de 40 % de leur coût déboucherait, estime-t-on, sur une hausse de 60 % au niveau du déploiement.
Deuxième axe — Évaluation et appréciation des technologies
M e si l o ussissait à opti ise l e ploitatio de l AIE“ da s so e se le pou ue l o puisse i t g e des installations de SE à des points névralgiques, sous réserve des propriétés et du coût de la technologie, rien
e ga a tit ue le d ploie e t d u e te h ologie de sto kage ou u e aut e est aussi o o i ue ou
te h i ue e t opti ale au i eau du si ple p ojet. C est pou uoi, alo s ue l a al se alis e da s le ad e du p e ie a e est te h ologi ue e t ag osti ue et suit u e app o he s st i ue à l i t g atio du “E à l AIE“, elle du deu i e a e s effe tue au niveau du projet. Cette analyse simule une technologie de SE i t g e à l AIE“ pou d te i e les te h ologies du p e ie a e ui se aie t e ta le, ta t do la réglementation existante et celle envisagée, et les lignes directrices du marché.
Trois technologies de SE parmi les plus matures et économiquement les plus concurrentielles pour lesquelles on dispose de do es su le oût et d aut es aspe ts, g â e au d pa te e t de l É e gie a i ai , o t ai si t évaluées : les batteries au lithium ionique (Li-ion), le stockage par air comprimé (CAES) et les centrales à réserve pompée (P-H d o . Les sultats s appuie t su la ie utile de la te h ologie, d a o d u ifo is e pou la période de 14 a s de l tude, afi de fa ilite le hoi de elles ui fe aie t l o jet d u e a al se plus pouss e. Les sultats de l aluatio o t t di is s e deu : technologie rentable ou pas rentable. Ensuite, la catégorie « e ta le » a t su di is e d ap s le atio oût/a a tage ou le e de e t du apital i esti (RCI), et la valeur actualisée nette (VAN) pour la vie entière de la technologie. Le meilleur RCI (1,54 ou 1,54 %) est celui du
stockage de 10 MW pendant 2 h dans des batteries au lithium ionique sur une période de 15 ans, sur le marché de l le t i it et des se i es au iliai es de l AE“O e ept le Load “hed “e i e — service de délestage instantané — et le Transmission Must-Run/Dispatch Down Service — service de transmission obligatoire/de vente sous contrat) et sur le marché de production estimé. La plus grande VAN se chiffrait à 137 M$ pour le stockage de 183 MW par air comprimé pendant huit heures sur une période de 40 ans (48 M$ lo s ue l o ramène la VAN à la période de 14 a s de l tude , pou les es a h s et se i es.
Trois facteurs ont un impact prononcé sur le RCI et la VAN : la technologie, le marché et les services, et la structure financière. En ce qui concerne le premier, la réduction du coût des batteries au lithium ionique ferait e so te ue e u il e oûte pou e pla e u e seule fois les atte ies au ait pas d i flue e sig ifi ati e su leu e ta ilit . E e a he, u e ie utile plus lo gue e ait di e s oûts d e t etie et de fe tio importants augmenter pour le CAES et la P-Hydro, deux technologies matures dont le coût ne devrait pas diminuer de manière appréciable.
ix
Le coût en capital plus élevé de la P-Hydro,
comparativement à celui du CAES signifie que, même avec une cote énergétique identique, les centrales à
se e po p e atteig e t pas le seuil de e ta ilit (183 MW sur 8 h ou 26 h pour le CAES contre 280 MW sur 8 h pour la P-Hydro). Sur le plan des marchés et des services, les données indiquent que le prix et
l i po ta e de la ha ge o t u e i flue e ota le su la réactivité requise des technologies de SE ainsi que sur leur capacité optimale et la durée. Parmi les marchés et les services examinés, les plus grands avantages vont p opo tio elle e t au se es d e ploitatio . O e déduit que les technologies de SE qui pourraient être intégrées à un ou plusieurs de ces services sont celles qui récoltent le plus de bénéfices, donc concourent davantage à la rentabilité. Les technologies de SE fort réactives comme les batteries au lithium ionique
o ie e t le ieu au se es d e ploitatio réglementées, tandis que celles à moins grande réactivité comme le CAES se prêtent davantage aux
se es d e ploitatio suppl e tai es d u ge e. Toutes les technologies de SE employées sur le marché de p odu tio à l tude o aisse t u e hausse de
e ta ilit , e si elle est pas aussi a u e ue pour les réserves d e ploitatio . Qua d la du e de stockage du système du CAES (capacité de 183 MW) passe de 8 à 26 h dans la simulation, on note une hausse des revenus dans le scénario secondaire du report de transmission, mais cette hausse se fait aux dépens de la valeur actualisée nette globale. Il existe donc un coût de e o iatio . La aiso est ue la aleu se o e t e su tout da s les se i es de ou te du e et u u plus long stockage ne compense pas le coût en capital plus élevé des technologies. Du côté de la P-Hydro, lorsque l o o pa e ette te h ologie à la taille a i ale du a h du sto kage d e gie du p e ie a e MW pendant 4,74 h), on se rend compte que les 900 MW stockés pendant 16 h par la centrale P-Hydro sont
supérieurs à la demande pour le a h de l e gie et les se i es au iliai es de l AIE“. La te h ologie est donc pas rentable. En ce qui concerne la structure financière, un rendement des capitaux propres (RCP) de 12 % fait des d pe ses d i o ilisatio DI le oût le plus le pour la turbine à combustion (TC) et les technologies de “E e a i es. “i l o ajoute u e ie utile plus lo gue, u e plus g a de apa it et u oût e apital
supérieur, le RCP élevé de la P-H d o sig ifie ue les d pe ses d i o ilisatio asso i es à ette technologie de SE augmentent plus vite que les recettes. Les marchés et les services de longue durée sont ceux qui recourent le plus au SE. Cependant, ils ne produisent pas nécessairement les revenus les plus importants. Beaucoup de services de réserves d e ploitatio de oi s d u e heu e peu e t e effet e ge d e les e e us les plus i t essa ts. Les se es gle e t es des atte ies au lithiu io i ue peu e t a oi s s a o pag e
Principales constatations du 2
eaxe
• “u le pla de la e ta ilit , si l o e lut
les ta ifs de l AE“O, l aluatio des
te h ologies de sto kage d e gie
montre que les batteries au lithium
ionique (stockage de 10 MW sur 2 h)
produisent un meilleur RCI (1,54) et une
plus forte valeur actualisée nette (137 M$)
que le CAES (sur 40 ans, stockage de
183 MW sur 8 h), pour les marchés et les
se i es de l Al e ta, do t u e tuel
marché de production.
• Parmi les marchés et services albertains,
les se es d e ploitatio so t elles ui
engendrent les meilleurs revenus pour les
trois technologies de SE évaluées. Ces
technologies profiteraient aussi de leur
intégration au marché de production
éventuel.
• Pour être rentable, cette technologie doit
satisfaire aux contraintes de prix et de
charge des marchés et des services
(réactivité, capacité, durée).
• La VAN diminue en moyenne de 24 %
(±10
% selo l e iste e ou pas d u
marché de production. Bien que le
marché de production hausse la valeur
actualisée nette de toutes les
te h ologies od lis es da s l a al se du
2
eaxe, il ne modifie en rien la rentabilité
x
d u is ue d usu e i po ta t pou le seau, e ui e dui ait la vie utile. Le nombre de cycles le plus élevé pou es atte ies s o se e au p ofo deu s de d ha ge ui o espo de t à u e d ha ge su ho ai e % de la profondeur de décharge) et à une production sous contrat au moins horaire (20 % et 40 % de la profondeur de décharge) pour divers services du réseau. Les services horaires et subhoraires susceptibles de raccourcir la vie utile des atte ies so t eu ui o i e t la pa ti ipatio au se es d e ploitatio , au a h de l e gie et au marché de production.
Troisième axe — Évaluation environnementale et socioéconomique Économie
De o eu appo ts de l i dust ie p oie t u e fo te di i utio du oût du sto kage d e gie au ou s des i p o hai es a es, e aiso des o o ies d helle ui a aisse o t les oûts, d u e eilleu e
uniformisation et des perfectionnements techniques, le tout étant appuyé par une hausse de la demande attribuable aux innovations sur les plans de la réglementation et des prix, à une forte pénétration du marché par les sou es d e gie e ou ela le, au d si des e ploita ts de t ou e des solutio s qui les affranchiront des lig es de t a spo t et au esoi s d u seau d le t i it ieillissa t ui s adapte à la so i t o te po ai e. A e l olutio des a h s du sto kage d e gie da s le o de, plusieu s d ou h s pote tiels o t u le jour pou les s st es de “E, de so te ue les possi ilit s de e e u d u s st e do a ie t passa le e t d u e d oit à l aut e.
Du ôt des eto es so io o o i ues, la plupa t des i pa ts d u d ploie e t du “E su l o o ie so t enregistrés pendant la o st u tio , o e est le as lo s du d ploie e t des p ojets tou ha t l e gie
e ou ela le. E effet, la phase de o st u tio des p ojets de “E de ait e ge d e emplois de 2021 à 2030 (selon les analyses du troisième axe décrites dans le rapport). Cependant, ces retombées se
at ialise o t sa s doute plus le te e t ue elles, pa e e ple, des p ojets de p odu tio solai e d e gie photo oltaï ue, a les s st es de sto kage d e gie so t sou e t odulai es, e ui e t aî e de oi s grands coûts de construction.
xi Environnement
Le d ploie e t p u du “E da s le seau d le t i it al e tai e p se te a ue des a a tages i i es pou l e i o e e t, o pa ati e e t à eu ue devraient entraîner la baisse du volume de GES libéré pa le seau e t e et sulta t d aut es fa teu s, do t l a a do du ha o et l i t g atio de sou es d e gie e ou ela le. Les issio s de GE“ du réseau devraient reculer de 45 % sans SE contre 46 % avec le SE.
Lo s ue l o o pa e l i ide e des atte ies au lithium ionique sur les GES durant leur vie utile à celle du CAES, on constate que les premières sont moins dommageables que le second. En effet, les batteries au lithium ionique libèrent environ de 22 % à 24 % moins de GES que le CAES.
La pa t ue la phase d e ploitatio d u e te h ologie appo te à l i pa t e i o e e tal glo al de ette dernière dépend du rendement général de la
te h ologie e uestio et des ha ge e ts u elle appo te à la o positio du seau d app o isio e e t en électricité. Pour le CAES, des émissions passablement plus importantes doivent être prévues durant la phase d e ploitatio , su tout si le s st e ûle du gaz atu el pou sto ke l le t i it . Cette situation sera
exacerbée par le rendement global peu élevé des technologies de CAES.
E aiso de l i pa t « de l id e au a h », o p o ise u e a al se o pa ati e plus pouss e des
pe ussio s glo ales du sto kage d e gie su les GE“ pou diff e ts se i es d le t i it et te h ologies de “E. Le fait ue l i te sit des issio s a ie lo s ue l o ha ge et d ha ge les s st es de “E e fo tio des
esoi s du seau odifie a l i pa t de la phase d e ploitatio su le olu e de GE“.
Principales constatations du 3
eaxe
• Le d ploie e t du sto kage d e gie
a lio e a la situatio des GE“ ue de
façon négligeable, comparativement à la
du tio des issio s ue l i t g atio
de ou elles sou es d e gie
e ou ela le au seau d le t i it
al e tai et l a a do du harbon
devraient entraîner entre 2017 et 2030. La
quantité de GES libérée par le réseau
devrait baisser en moyenne de 4 % par
année.
• L i pa t des s st es de “E à atte ies au
lithium ionique sur les GES durant leur vie
utile résultera principalement de la
fa i atio de l id e au a h des
composants, surtout les blocs de
batteries.
xii
Table of Contents
Preface ii Executive Summary i Résumé v List of Figures xvList of Tables xvii
Introduction 1
1 Grid Needs and Market Opportunity Pillar 3
1.1 Introduction to Pillar 1 ... 3
1.2 Background ... 4
1.2.1 Economic, Policy, Market, and Technical Considerations... 4
1.2.2 ES Benefit Categories and Potential Use Cases ... 8
1.2.3 Referenced Studies and Analyses ... 14
1.3 Pillar 1 Methodology ... 14
1.3.1 Model Operation ... 16
1.3.2 Benchmark, Scenarios, and Sensitivities ... 18
1.4 Summary of Inputs and Assumptions ... 19
1.4.1 Inputs and Assumptions to the Model ... 20
1.5 Simulation Results ... 24
1.5.1 Benchmark Simulation ... 24
1.5.2 Case 1: ES Capacity Scenario ... 24
1.5.3 Case 2: Transmission Deferral/Avoidance Scenario ... 28
1.5.4 Case 3 and 4: Sensitivity Study - Fuel Prices ... 31
1.5.5 Case 5 and 6: Sensitivity Study - Influence of ES Technology Costs ... 34
1.6 Overall Conclusions Related to the Potential Market for ES in Alberta ... 37
2 Technology Assessment and Valuation Pillar 39 2.1 Introduction to Pillar 2 ... 39
2.1.1 Relation to Pillar 1 ... 39
2.2 Background: Analysis, Market, and Technical Considerations ... 40
2.2.1 Market Considerations ... 40
2.2.2 Analytical Tools and Methodologies... 43
2.2.3 Technical Considerations ... 44
xiii
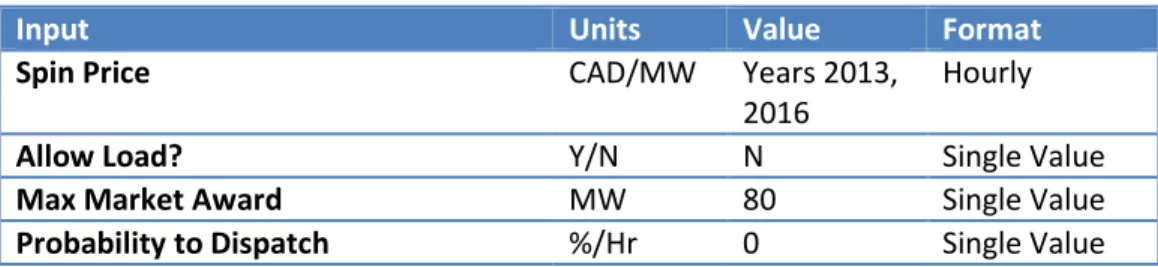
2.4 Model Inputs and Assumptions ... 47
2.4.1 Current Market Inputs ... 47
2.4.2 Future Market Inputs ... 53
2.4.3 Technology Inputs ... 55
2.4.4 Financial Inputs ... 57
2.5 Model Assumptions and Implications ... 58
2.6 Simulation Results ... 59
2.6.1 Comparing Use Case and Sub Scenario Outputs ... 59
2.6.2 Summary of TEA Simulation Output Observations ... 68
2.6.3 Selecting ES Technologies for Analysis of Stackable Present Value Costs and Benefits by Market and Services ... 69
2.6.4 The Impact of STS and DTS Rates for Distributed Energy Storage Systems ... 77
2.7 Conclusions... 77
3 Environmental and Socio-Economic Impact Assessment Pillar 79 3.1 Introduction to Pillar 3 ... 79
3.2 GHG Emissions Analysis ... 79
3.2.1 Background ... 80
3.2.2 Methodology ... 83
3.2.3 Application of the Methodology ... 85
3.2.4 Evaluation of Environmental Impact of Energy Storage Systems... 99
3.3 Socio-Economic Impact Assessment ... 106
3.3.1 Methodology for Economic Impact Assessment of ES Projects ... 107
3.3.2 Socio-Economic Impact of Deploying ES in Alberta ... 108
3.4 Conclusions: Environmental and Socio-Economic Impact ... 109
4 Summary and Path Forward 111 5 References 113 6 Appendix I: Simulated Potential Energy Storage Facilities in the Benchmark and ES Capacity Scenarios 121 6.1 Potential Energy Storage Facilities ... 121
6.2 Fuel Consumption ... 124
7 Appendix II: Wind and Solar Generation Stations Input to the Model 127 7.1 Wind Energy Generators ... 127
7.2 Solar Energy Generators ... 127
xiv
8.1 Technology Capital Cost and Category ... 128 8.2 Technical and Economic Life... 128
9 Appendix IV: Sample Simulation Model Input Data (Types) 129
10 Appendix V: Some Alberta Electricity Market Data 131
11 Appendix VI: Examples of Energy Storage Benefits (Battery) 133
12 Appendix VII: Treatment of ES Technology Options 134
13 Appendix VIII: Resulting Scenarios for Energy Storage Valuation 137 14 Appendix IX: Annual Services Revenue for Li-ion 10MW 2Hr and 4Hr in Use Case 2 140 15 Appendix X: Transmission Deferral Sub Scenario for CAES 183MW 8Hr and 26Hr in Use Case 2 142
16 Appendix XI: Summary of Alberta’s Climate Change Framework 146
17 Appendix XII: Summary of Life Cycle Inventory – Li-ion Battery and CAES 147
18 Appendix XIII: ES Deployment Scenarios by Technology 149
19 Appendix XIV: ES Environmental Impact at Grid Level for Different ES Deployment Scenarios 150 20 Appendix XV: Estimated Coal-Fired Generation Facilities Offline Schedule 151
xv
List of Figures
Figure 1: Three pillars of analysis in the Canadian Energy Storage Roadmap project ...1
Figure 1-1: Alberta Integrated Electricity System Summary ...7
Figure 1-2: Grid-level ES analysis methodology ... 15
Figure 1-3: Pillar 1 simulation cases ... 18
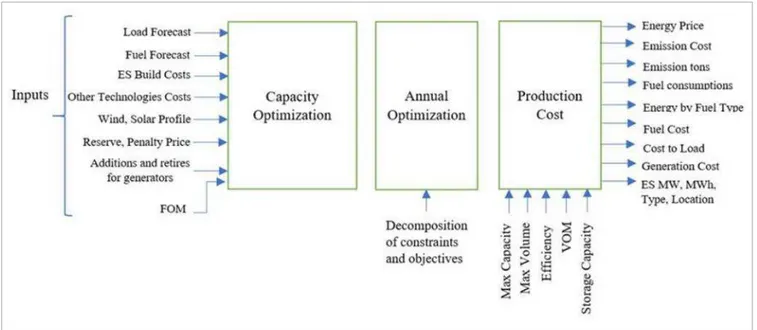
Figure 1-4: Example model inputs and outputs of the simulation tool used in all three of the simulation stages 19 Figure 1-5: Power/Energy distribution by storage technology category (ES Capacity scenario) ... 25
Figure 1-6: Hourly electricity prices over the study period (Benchmark vs. ES Capacity)) ... 26
Figure 1-7: Hourly Electricity Price Comparison (Benchmark vs ES Capacity) in 2030 ... 26
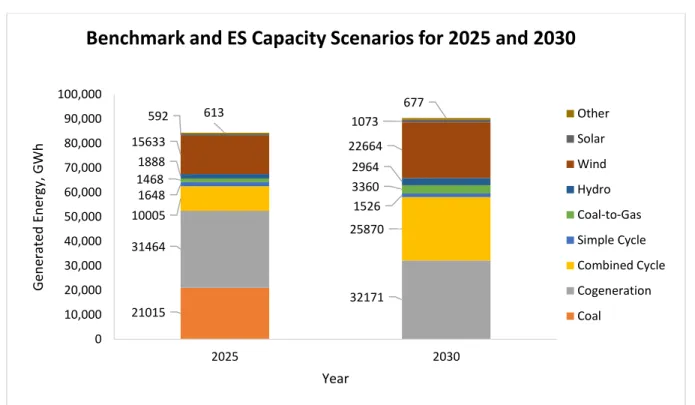
Figure 1-8: Energy generation mix for the Benchmark and ES Capacity Scenario, in years 2025 and 2030. ... 27
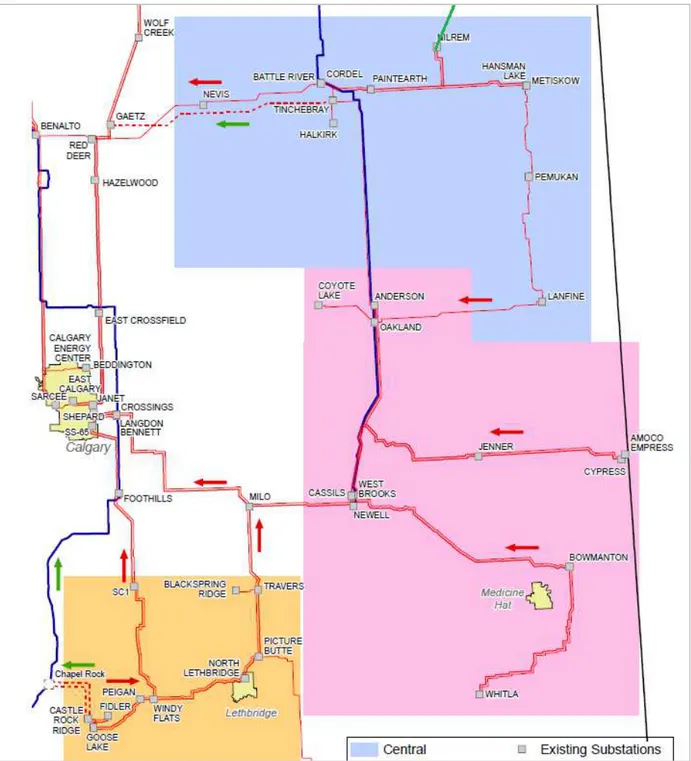
Figure 1-9: Proposed AESO transmission lines in Southern and Central Alberta ... 29
Figure 1-10: AESO alternative ES scenario facilities (Cordel region, North Lethbridge region, and Goose Lake region). ... 30
Figure 1-11: Energy from various generation assets by fuel type (influence of fuel prices, years 2025 and 2030). ... 34
Figure 1-12: Energy from various generation assets by fuel type (influence of technology costs, years 2025 and 2030) ... 36
Figure 2-1: Simulation Results for CT and ES Technology NPV (y-axis Truncated to -$100M) ... 62
Figure 2-2: Simulation Output (a) Cost Benefit Ratios at Given Technology Lifetime, Capacity and Duration ... 65
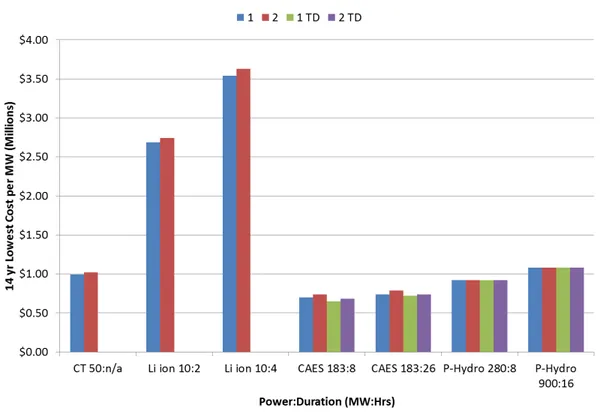
Figure 2-3: Simulation Output (b) Present Value Cost or Least Cost Normalized per MW per 14 Years of Study . 66 Figure 2-4: TEA Simulation Output (c) NPV Normalized per MW per 14 Years of Study ... 67
Figure 2-5: CT 50MW Stacked Costs and Benefits for GS 2 with an Estimate of the 2021 Capacity Market ... 71
Figure 2-6: Li-ion 10MW 2Hr Stacked Costs and Benefits for GS 2 with an Estimate of the 2021 Capacity Market ... 72
Figure 2-7: CAES 183MW 8Hr Stacked Costs and Benefits for GS 2 with an Estimate of the 2021 Capacity Market ... 73
Figure 2-8: CAES 183MW 26Hr Stacked Costs and Benefits for GS 2 with an estimate of the 2021 Capacity Market ... 74
Figure 2-9: Li-ion 10MW 2Hr Project Year 1 Daily Revenue for GS 2 with an Estimate of the 2021 Capacity Market ... 75
Figure 2-10: Li-ion 10MW 2Hr Project Year 1 Cycle Count at each Depth of Discharge (DoD) in GS 2 with an Estimate of the 2021 Capacity Market ... 76
Figure 3-1: Overall GHG Emissions Estimation Methodology ... 84
Figure 3-2: Main Phases of Life Cycle Assessment (ISO 2006c) ... 85
Figure 3-3: Flow-diagram of the System Function and Related Unit Processes ... 88
Figure 3-4: Utility-scale Battery Energy Storage System Topology adapted from (Holger, et al. 2017) ... 91
Figure 3-5: Schematic Diagram of Gas Turbine Generation and Compressed Air Energy Storage System ... 93
Figure 3-6: Annual Marginal Price-setting Technology (AESO 2017b) ... 97
Figure 3-7: Net Fossil Fuel GHG Emission Reductions due to Energy Storage Operation in the Alberta Electric Grid (2024-2030) ... 101
Figure 3-8: ES Environmental Impact at Grid Level for Different ES Deployment Scenarios ... 102
Figure 3-9: Annual Grid-level GHG Emissions with ES in the Alberta Electric Grid (2017-2030) ... 103
xvi
Figure 3-11: Life Cycle GHG Impact Comparison for ES Technologies ... 105 Figure 3-12: Dependency of the Changes of the Operations Phase GHG Emissions from ES Technologies on the
Variations of the GHG Emissions from Grid Generation Sources. Adapted from (Hiremath, Derendorf and Vogt 2015) ... 106 Figure 3-13: Methodology of Estimating Socio-economic Impact ... 107 Figure 3-14: Socio Economic Impact of Deploying Energy Storage Systems in the Province of Alberta ... 109 Figure 6-1: Fuel Consumption, MMBTU and Percentage of Total Fuels (Benchmark and ES Capacity Scenarios)
over Study Period ... 124 Figure 6-2: Generated Energy from Various Generation Assets by Fuel Type (Base Case with and without Energy
Storage) ... 125 Figure 10-1: Alberta Electricity System Overview (As of January 2017 ) and Generation Capacity by Primary Fuel
Sources ... 131 Figure 10- : Al e ta s Ele t i it Ge e atio Fuels as of Ma h ... 132 Figure 10-3: Coal Units in Alberta and their Operators ... 132 Figure 14-1: 10MW 2Hr Li-io fo G“ ith N‘C s Esti ate of the Capa it Ma ket ... 140 Figure 14-2: 10MW 2Hr Li-ion fo G“ ith N‘C s Esti ate of the Capa it Ma ket ... 141 Figure 15- : Costs a d Be efits CAE“ MW H “ta ked fo G“ ith N‘C s Estimate of the 2021 Capacity
Market and Transmission Deferral Sub Scenario ... 142 Figure 15-2: CAES 183MW 26Hr Stacked Costs and Be efits fo G“ ith N‘C s Esti ate of the Capa it
xvii
List of Tables
Table 1-1: List of grid benefit categories and ES use cases considered in this study ...8 Table 1-2: Storage Technology Categories ... 22 Table 1-3: Fuel Price Summary ... 23 Table 1-4: Forecast Load and Energy Profile ... 23 Table 1-5: Generator Installed Capacity ... 23 Table 1-6: Deployment timeline for potential ES facilities (Benchmark simulation) ... 25 Table 1-7: Benefits and cost reductions over the study period, ES Capacity Scenario ... 27 Table 1-8: Planned New Transmission Lines ... 28 Table 1-9: Transmission vs ES: Generation Cost and Cost to Load (Acelerex Production Cost Model) ... 30 Table 1-10: Transmission vs Energy Storage: Capital and Maintenance Costs (Acelerex Production Cost Model). 31 Table 1-11: Potential ES capacity (high fuel prices variant) ... 31 Table 1-12: Potential ES (low fuel prices variant) ... 32 Table 1-13: Average Annual Electricity Price, Influence of Fuel Prices (AESO, $/MWh) ... 32 Table 1-14: Potential ES capacity (high ES technology cost case) ... 34 Table 1-15: Potential ES capacity (low ES technology cost case) ... 35 Table 1-16: Average Annual Electricity Price, Influence of ES technology capital costs(AESO, $/MWh) ... 35 Table 2-1: Overview of AESO Markets and Services ... 41 Table 2-2: Typical Technology Input Parameters using the 10MW 4Hr Li ion Battery as an example ... 46 Table 2- : T pi al Ma ket I put Pa a ete s usi g a esti ate AB s E e g Ma ket i as a e a ple ... 46 Table 2-4: Financial Assumptions using IPP as an example, where IPP is an Independent Power Producer ... 47 Table 2-5: Summary of Grid or Markets and Services Benefits Modelled by ESVT ... 49 Table 2-6: Matching TEA tool benefits to Alberta market services, and defining TEA use cases for CT, ES, and
ES&TD ... 51 Table 2-7: Alberta Input Data for Operating Reserves: Regulating, or Frequency Regulation ... 52 Table 2-8: Alberta Input Data for Operating Reserve Contingency Spinning, or Synchronous/Spinning Reserves 52 Table 2-9: Alberta Input Data for Operating Reserve Contingency Supplemental, or Asynchronous/Non-Spinning
Reserves ... 52 Table 2-10: Alberta Input Data for Black Start Services ... 52 Table 2-11: Alberta Input Data for an Estimate of the 2021 Capacity Market, or System Supply Capacity ... 53 Table 2-12: Data for Transmission Deferral Sub Scenario ... 54 Table 2-13: Alberta Input Data for Transmission Deferral Sub Scenario ... 55 Table 2-14: Technology Name, Lifetime (yrs), Power (MW) and Duration (Hr) of ES Systems and CT Studied.
Source Data and Reference Details in Appendix VII. ... 56 Table 2-15: Possible Ownership Types ... 57 Table 2-16: IPP Financial Inputs ... 57 Table 2-17: TEA Simulation Results for CT and ES Technology NPV (CT revenues from Operating Reserves
ould t e i luded at the ti e of this epo t due to a u fo esee aluatio tool e o ... 61 Table 2-18: TEA Simulation Results for CT and ES Technologies by (a) Cost Benefit, (b) Least Cost per MW and
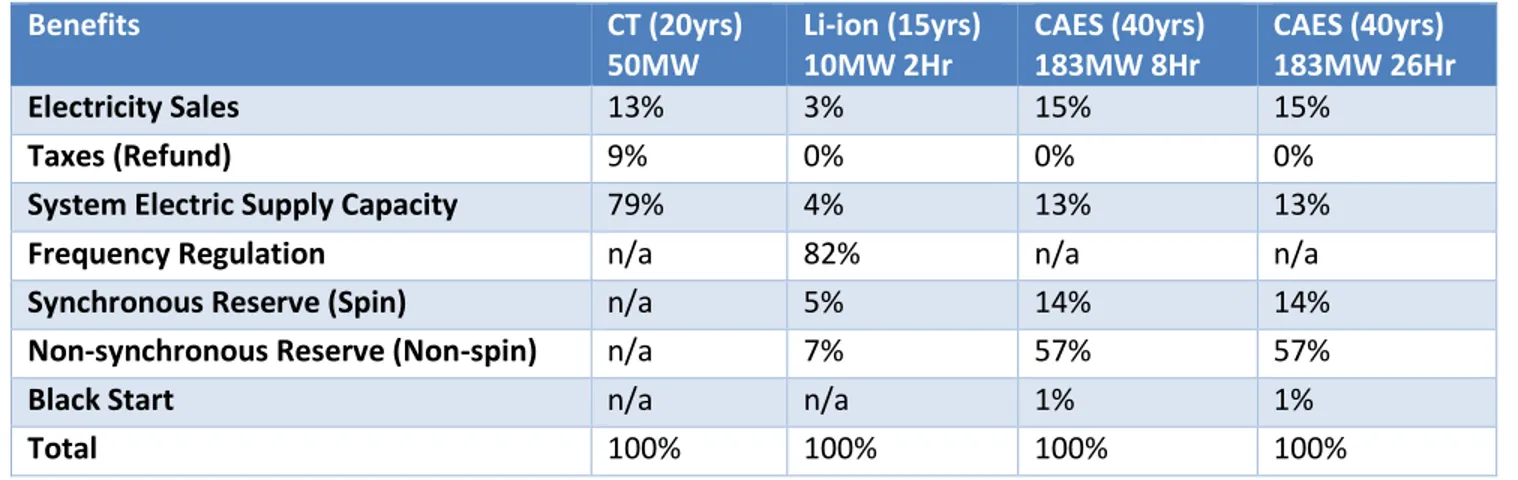
MWh, and (c) Maximum NPV per MW and MWh ... 63 Table 2-19: CT and ES Present Value Benefits in CAD over Given Lifetimes for GS 2 with an Estimate of the 2021
xviii
Table 2-20: CT and ES Present Value Benefits in % over Given Lifetimes for GS 2 with an Estimate of the 2021 Capacity Market ... 70 Table 2-21: CT and ES Present Value Costs in CAD over Given Lifetimes for GS 2 with an Estimate of the 2021
Capacity Market ... 70 Table 2-22: CT and ES Present Value Costs in % over Given Lifetimes for GS 2 with an Estimate of the 2021
Capacity Market ... 70 Table 2-23: Li-ion 10MW 2Hr Project Year 1 Cycle Count at each Depth of Discharge (DoD) for GS 2 with an
Estimate of the 2021 Capacity Market. ... 76 Table 3-1: Component Mass Breakdown and Performance of the Modelled Battery (LFP) (Majeau-Bettez,
Hawkins and Stromman 2011) ... 86 Table 3-2: Major assumptions made for cradle-to-gate and recycling phases for Li-ion battery used in stationary
application ... 90 Table 3-3 : Share of BESS Components on Cradle-to-Gate GHG Emissions (%) ... 92 Table 3-4: CAES LCA Main Assumptions ... 93 Table 3-5: Emission Intensities of Generation Types ... 97 Table 3-6: GHG emissions during manufacturing and recycling for Li-ion and CAES Systems ... 100 Table 3-7: Operations phase GHG Emissions for ES Technology Comparisons at Different Generation Mix
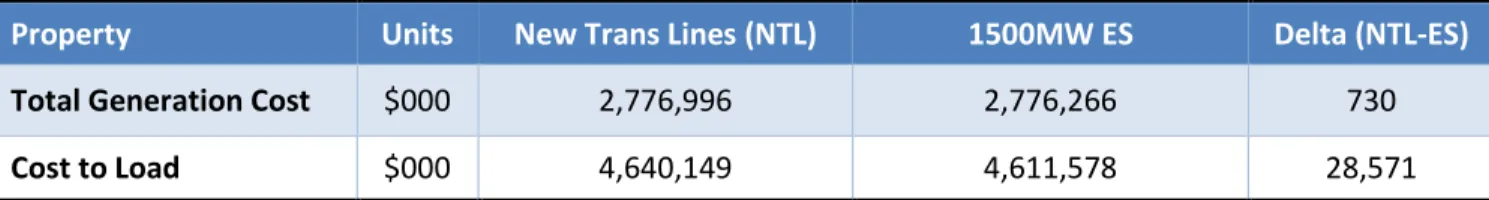
Scenarios... 104 Table 3-8: Life Cycle GHG Emission Intensities of ES Technology Types ... 106 Table 3-9: Main Assumptions of Socio-Economic Impact Assessment ... 108 Table 3-10: Direct Impact Comparison to Renewable Technologies ... 109 Table 6-1: Detailed Recommended Energy Storage Locations, Build Year, Category and Capacity in the Base Case
... 123 Table 6-2: Benefit Calculation Assumptions ... 126 Table 7-1: Wind Generator Locations ... 127 Table 7-2: Solar Generator Locations ... 128 Table 8-1: Energy Storage Technology Capital Cost and Capacity by Category ... 128 Table 8-2: Energy Storage Technology Technical and Economic Life ... 128 Table 9-1: Sample Simulation Model Input Data ... 130 Table 11-1: Example of Benefits Provided by Battery Energy Storage to Various Stakeholders ... 133 Table 12-1: Examples of Electrochemical and Mechanical ES Technologies ... 134 Table 12-2: Power (MW) and Duration (Hr) of ES Technologies and Baseline CT Studied ... 135 Table 12-3: Sources from SAND2015-1002 for ES Technology Cost and Performance Data Listed in Table 11-2
(Akhil, Huff and Currier 2015) ... 135 Table 13-1: TEA Scenarios and Output Format for Twenty-two TEA Use Case Simulations ... 137 Table 13-2: TEA Simulation Outputs by (a) Cost Benefit, (b) Least Cost per MW and MWh, and (c) Maximum NPV
per MW and MWh ... 138 Table 15- : CAE“ MW H Costs a d Be efits fo G“ ith N‘C s Esti ate of the Capacity Market and
Transmission Deferral Sub Scenario ... 143 Table 15- : CAE“ MW H Costs a d Be efits fo G“ ith N‘C s Esti ate of the 2021 Capacity Market and
Transmission Deferral Sub Scenario ... 145 Table 16- : “u a of Al e ta s Cli ate Cha ge F a e o k (Alberta 2017b, Canada 2017, Lee-Andersen 2017)
xix
Table 17-1: Life Cycle Inventory Table for Li-ion Battery Pack System (Majeau-Bettez, Hawkins and Stromman 2011) ... 147 Table 17-2: Life Cycle Inventory Table for CAES System (Oliveira, et al. 2015) ... 148 Table 18-1: ES Allocation Scenarios by Technology for the Base Case ... 149 Table 19-1: ES Environmental Impact at Grid Level for Different ES Deployment Scenarios ... 150 Table 20-1: Estimated Coal-Fired Generation Facilities Retirement Schedule ... 151
1
Introduction
The National Research Council Canada (NRC) and its partners are embarking on a 5-year project to develop a Canadian Energy Storage Study. This work builds upon previous work in Canada and internationally to perform a comprehensive independent analysis of the potential costs and benefits of adopting Energy Storage (ES)
technologies in each jurisdiction. In order to do this in a uniform fashion and ensure a fact-based approach to the detailed assessment of the various factors under consideration, the project team is focusing on three pillars of analysis, shown in Figure 1. This common framework will be applied to each province in turn, and released as chapters of the overall Canadian Energy Storage Study.
Figure 1: Three pillars of analysis in the Canadian Energy Storage Study project
Across all three pillars, engagement of key stakeholders such as regulators, power producers, and policy makers, along with storage technology vendors and system integrators, is critical. This has been initiated through the creation of an advisory board which has members from many key organizations. Given that the project is ongoing over a number of years, it is expected that the project team will continue to identify and engage key stakeholders within each province, assess particular stakeholder needs and opportunities, organize and document stakeholder input, and disseminate study results. This study will also leverage recent Program of Energy Research and Development (PERD) projects (2A02.002, NRESOT-04 and NRESOT-05), focusing on real time load data collection and analysis, a CanmetENERGY project on the Canadian ancillary services market, and an NRC TEA (Techno Economic Analysis) platform including a Canadian ES valuation tool and databases therein (ES-Select Canada).
Results for each province will be completed independently due to the varied nature of the markets, generation and supply mix, and providers / technologies used in each market. However, the overall framework will be consistent and will leverage learning across Canadian jurisdictions, as well as from other early ES markets such as California and PJM in the Eastern U.S.
As outlined in the detailed project scope below, the project will be completed in phases, starting with overall framework development, applying it first in Alberta and then Ontario, and then moving to the other Canadian
Pillar 1 - Grid Needs and
Market Opportunity
• Identify ES Use Cases
• Define specific application
requirements
• Identify the impacts on
grid power planning and
operations
• Review the current market
structure
Pillar 2 - Technology
Assessment and Valuation
• Assess ES technologies and
trends
• Match technology and
application requirements
• Propose valuation and
performance frameworks
• Evaluate individual ES
profitability and dispatch
on the electric grid
Pillar 3 - Environmental and
Socio-Economic Assessment
• Assess environmental and
socio-economic metrics
• Assess GHG emissions at
the grid level
• Compare life cycle GHG
emissions of ES
2
jurisdictions. These individual chapters will then be capped by an overall national picture of ES and its impact on the electricity grid. The current report is focused on ES market opportunities in Alberta.
The goal of this analysis will be to allow the market to compete in an open and fair manner, both for ES technologies and for existing assets and technologies. More specifically, it is expected that this analysis will produce the following results:
Pillar 1 result: A clear understanding of the market need for the services that ES might provide in each jurisdiction, at the generation, transmission, and distribution levels, including the development of standardized use cases.
Pillar 2 result: An assessment of the realistic market opportunity for ES, including an analysis of the current and future state of the art of individual technologies, the value of each technology in individual use cases, and the identification of specific regulatory or market barriers that might prevent
deployment.
Pillar 3 result: A uniform assessment of the environmental and economic impacts of the adoption of ES, including the possibility of increased engagement of the electricity and manufacturing sectors in new technology commercialization, both for local use and export opportunities.
3
1 Grid Needs and Market Opportunity Pillar
Pillar 1 is a macro-level analysis that generates outputs that are used by the other two Pillars. The Pillar 1 analysis identifies ES use cases, defines specific application requirements, and identifies the impacts on grid power planning and operations. Details on the Pillar 1 objectives, background, methodology, and results are found in the sections below.
1.1 Introduction to Pillar 1
The ES industry is seen by many analysts and advocates to be rapidly advancing with regard to cost,
performance, and market penetration. This is mainly based on various analyses which show that ES provides various benefits to an electricity grid/market. Therefore, many project developers and planners are looking to ES in order to increase resiliency and reliability, and help end users manage energy costs in utility, commercial and consumer markets. According to a report compiled by Bloomberg New Energy Finance and IEA, in 2016 there were 5 GWh of ES installed globally (excluding pumped hydro), and this number is expected to grow to 300 GWh by 20305.
The objective of Pillar 1 of this study is to perform an independent analysis of the potential benefits and costs of implementing ES. The analysis involves optimizing the size, location, and timing of potential ES deployments on the Alberta grid in order to maximize the benefits to the ratepayers in the province of Alberta over the study time horizon of 2017 to 2030. The study also considers various policy changes and goals, both existing and expected at a federal and provincial level.
In order to achieve these goals, the NRC, with the support of organizations on the Advisory Board, the
Contributing Partners Committee, and Acelerex Consulting, conducted a technology-agnostic ES production cost model analysis for the province of Alberta. This analysis extended the 2017 Alberta Long Term Outlook6 to
specifically look at the potential value streams that ES might provide over the long-term, while comparing this to the overall cost of deployment and operation. Various ES benefits were evaluated, including opportunities to reduce the price paid for electricity usage, reduce peak demands, avoid the cost of transmission and distribution investments, avoid capital investments in new capacity, increase renewable penetration, and reduce GHG emissions.
This study required a large amount of grid and market data which was collected from various sources including federal and provincial governments, industry representatives, and internationally-accepted benchmarking reports. From these data, a large-scale, complex co-optimization model was built to simulate various scenarios of ES development in Alberta.
The results of this pillar are the total potential market size for ES in the province including an optimization of the location, type, and timing of ES deployments that would result in the lowest-cost system given the scenarios and assumptions that have been outlined below. It should be noted that changes to the market, technology, or policies, or increased scope of the study to include other storage technologies or sites (such as ES specifically optimized to be distributed behind the meter) may provide a different view than that presented in this study.
5
https://www.greentechmedia.com/articles/read/global-energy-storage-double-six-times-by-2030-matching-solar-spectacular#gs.KvJY1h0