Supporting information for: Radical-Initiated and
Thermally-Induced Hydrogermylation of Alkenes
on the Surfaces of Germanium Nanosheets
Haoyang Yu,
†Tobias Helbich,
‡Lavinia M. Scherf,
¶Jian Chen,
§Kai Cui,
§Thomas F.
Fässler,
¶Bernhard Rieger,
‡and Jonathan G.C. Veinot
∗,††Department of Chemistry, University of Alberta, 11227 Saskatchewan Drive, Edmonton, Alberta, T6G 2G2, Canada
‡Catalysis Research Center Wacker-Lehrstuhl für Makromolekulare Chemie, Department of Chemistry, Technische Universität München, Lichtenbergstraße 4, 85748 Garching, Germany ¶Lehrstuhl für Anorganische Chemie mit Schwerpunkt Neue Materialien, Department of Chemistry, Technische Universität München, Lichtenbergstraße. 4, 85748 Garching, Germany §Nanotechnology Research Centre, National Research Council Canada, 11421 Saskatchewan Drive, Edmonton, AB, T6G 2M9, Canada.
List of Figures
S1 Powder diffraction patterns of CaGe2 . . . 9
S2 Powder diffraction patterns of HGe-flakes . . . 10
S3 Energy dispersive spectroscopy output of HGe-flakes . . . 11
S4 X-ray photoelectron survey spectroscopy of HGe-flakes . . . 12
S5 Diffuse reflectance spectroscopy of HGe-Flakes and GeNSs . . . . . . 13
S6 X-ray photoelectron survey spectroscopy of CaGe2, and GeNSs . . . 14
S7 High resolution X-ray photoelectron spectroscopy of CaGe2 and GeNSs . . . 15
S8 Electron diffraction simulation of GeNSs multilayers. . . . . . 16
S9 TEM images of functionalized GeNSs . . . 17 S10 High resolution X-ray photoelectron spectroscopy of functionalized GeNSs . 18
Material
All reagents were purchased from Sigma-Aldrich and used without further purification unless otherwise stated. All solvents, except acetone, were dried using an Innovative Technology, Inc. Grubbs-type solvent purification system. Acetone was dried over molecular sieves (3 Å), degassed via 3 freeze-pump-thaw cycles using an argon charged double manifold. All solvents and liquid reagents were degassed via 3 freeze-pump-thaw cycles using an argon charged double manifold and stored in MBraun glove box with nitrogen working gas.
Material Synthesis
Synthesis of CaGe2
A stoichiometric mixture of calcium (Sigma, 99.0 %) and germanium (Sigma, 99.999 %) was pressed to a pellet and subsequently melted together in an arc furnace installed in an argon- filled glove box (MBraun, H2O and O2 levels < 0.1 ppm). To ensure effective homogenization,
the resulting silver, metallic regulus was melted upon simultaneous heating from the top and bottom in the arc furnace, ground thoroughly in an agate mortar, pressed again to a pellet, melted from both sides in the arc furnace and ground into a powder again.1 The resulting product was evaluated using X-ray powder diffraction and XPS.
Synthesis of HGe-flakes
All manipulations were performed in an argon atmosphere. A standard Schlenk flask was charged with 100 mL of concentrated HCl. After cooling to -30 ˚C in a low temperature freezer, CaGe2 (1.00 g) was added. The mixture was maintained at -30 ˚C for at least 7 d and
shaken 10 times per day at regular intervals.2 Then the reaction mixture was filtered using a glass frit under nitrogen to provide shiny metallic shiny flakes that were washed with 3 times dry, degassed acetone followed by drying in vacuum on the Schlenk line. The resulting HGe-flakes were characterized using XRD and FTIR and stored in a nitrogen filled glove box until further use.
Radical-initiated hydrogermylation
In a nitrogen charged glove box, HGe-flakes (5 mg) were transferred into a dry 5 mL Biotage® microwave tube. Dry degassed toluene (2 mL), AIBN (10 mg) and 1-dodecene (1 mL, 4.5 mmoles) were added and the tube was sealed. The reaction mixture was subsequently ultrasonicated in a bath sonicator (Fisher Scientific FS30) for 3-hours after which it was heated to and maintained at 65 ˚C and stirred for 12 hours. The resulting red suspension was transferred to a PTFE centrifuge tube, methanol (40 mL) was added and the mixture was centrifuged (12,000 rpm for 10 min) to yield a deep red pellet. The solid was redispersed in a minimal amount of toluene (2 mL). Methanol (40 mL) was added and the mixture was centrifuged (12,000 rpm for 10 min). This suspension/precipitation procedure was repeated twice after which the dodecyl-GeNSs were freeze dried from benzene and finally dispersed in toluene.
Thermally-Induced Hydrogermylation
In a nitrogen charged glovebox, HGe-flakes (5 mg) were transferred into a dry 5 mL Biotage® microwave tube. 1-dodecene (2 mL, 9.0 mmoles) was added and the tube was sealed. The reaction mixture was subsequently ultrasonicated in a bath sonicator (Fisher Scientific FS30) for 3-hours after which it was heated to and maintained at 190 ˚C for 12 hours. After the reaction, the dark brown mixture was transferred to a PTFE centrifuge tube, methanol (40 mL) was added and the mixture was centrifuged (12,000 rpm for 10 min). The solid was redispersed in a minimal amount of toluene (2 mL). Methanol (40 mL) was added and the mixture was centrifuged (12,000 rpm for 10 min). This suspension/precipitation procedure was repeated twice after which the dodecyl-GeNSs were freeze dried from benzene and finally dispersed in toluene.
Materials Characterization
Fourier Transformed Infrared (FT-IR) Spectroscopy
FT-IR Spectra were acquired using a Thermo Nicolet Magna 750 IR Spectrometer. Samples were prepared by drop coating a toluene dispersion of the material of choice onto an electronic- grade Si-wafer (N-type, 100 surface, 100 mm thickness and 10 ohm·cm resistivity) and dried under nitrogen atmosphere.
Electron Microscopy
Bright-field transmission electron microscopy (TEM) images were acquired using a Hitachi- 9500 or JEOL JEM-ARM200CF S/TEM electron microscope at accelerating voltages of 300 kV or 200 kV, respectively. HRTEM images obtained from a Hitachi-9500 were processed using Gatan Digital Micrograph software (Version 3.22.1461.0). HRTEM images were enhanced with commercial software HREM-Filters Pro/Lite v.2.5.1 equipped in Gatan Digital Micrograph. The CrystalKitX was employed for the selected area electron diffraction (SEAD) pattern simulation.
The crystallographic data using for the simulation is from Cultrara et al. 3 TEM samples were prepared by depositing a drop of GeNS suspensions in toluene onto a holey/lacey carbon coated copper grid (Electron Microscopy Inc.)The grid was kept in a vacuum chamber for at least 24 h prior to data collection.
Atomic Force Microscopy (AFM)
AFM was performed using a Bruker Dimension EdgeTM system with NanoDrive version 8.02
software. The tapping mode cantilever was purchased from Bruker (Resonance frequency: 300 kHz, force constant 42 N/m). Thin films of GeNSs (5 mg of exfoliated sheets in 2 mL of toluene) were spin coated (90 seconds, 1000 rpm) onto a Si (111) wafer substrate that had been cleaned using a standard Piranha protocol.
X-ray Photoelectron Spectroscopy (XPS)
XPS was performed using a Kratos Axis Ultra instrument operating in energy spectrum mode at 210 W. Samples were prepared by depositing a suspension of t h e material of choice onto a copper foil substrate followed by drying in air. Prior to analysis, the Ge (111) wafer reference was cleaned by immersing in 30% v/v H2O2 for 90 s followed by 10 minutes etching
in 10% v/v HF. The base and operating chamber pressure were maintained at 10-7 Pa. A monochromatic Al K source (λ = 8.34Å) was used to irradiate the samples, and the spectra were obtained with an electron take-off angle of 90˚. CasaXPS software (VAMAS) was used to interpret high-resolution spectra. All spectra were internally calibrated to the C1s emission (284.8 eV). After calibration, a Shirley-type background was applied to remove most of the extrinsic loss structure.
Thermogravimetric Analysis (TGA)
TGA was performed using a Mettler Toledo Star TGA/DSC system. The sample being evaluated was placed in a Pt pan and heated under N2 atmosphere from 35 to 700 ˚C at a
Powder X-ray Diffraction (XRD)
PXRD data were collected using an Inel MPD MultiPurpose Diffractometer equipped with a CPS 120 curved position sensitive X-ray detector and Cu K α (8.047 KeV energy) source or Stoe STADI P diffractometer equipped with a Ge(111) monochromator for Cu Kα radiation (λ = 1.54056 Å) and a Dectris MYTHEN DCS 1K solid-state detector. CaGe2 was ground in an
agate mortar and filled into 0.3 mm glass capillaries which were then sealed. The sample was measured within a 2θ-range of 5–87.5° (PSD steps, 1.5°; time/step,15 s).GeH powders were deposited on an amorphous silica holder.
Diffuse Reflective Spectroscopy
Diffuse Reflective spectroscopy data was collected using an Agilent TechnologiesTM Cary Series (Model# 5000) UV-Vis-NIR spectrophotometer. Samples were prepared by drop coating a toluene dispersion of the material of choice onto an electronic- grade Si-wafer (N-type, 100 surface, 100 mm thickness and 10 ohm·cm resistivity) and dried under nitrogen atmosphere.
Raman Spectroscopy
Raman spectroscopy was performed using a Renishaw inVia Raman microscope equipped with a 514 nm diode laser operating at a power of 3.98 mW on the sample. Samples were prepared by mounting the suspension on gold-coated glass.
Surface Coverage
The thickness of the carbon overlayer can be calculated using the overlayer model described in literature:4–6
(
IOv IGe)(
SFGe SFOv)(
rGe rOv)
=(
1-e - dOv lOvcosq e -dOv lGecosq)
(S1)where I is the peak intensity, ρ is the atomic volume density, SF is the sensitivity factor, dOv is
the overlayer thickness, λ is the photoelectron escape length, and θ is the photoelectron take-off angle determined by the surface orientation relative to the analyzer. The subscript Ov signifies an overlayer component; the subscript Ge signifies a Ge component. The take-off angle (θ) is 0˚for this work, and atomic volume density is assumed identical where each Ge atom is bonded to one alkyl chain and three other Ge atoms, giving Equation S2:
(
IOv IGe)(
SFGe SFOv)
=(
1-e -dOv lOv e --dOv lGe)
(S2)Extending this structure to a NS provides a Ligand-Sheet-Ligand Model for functionalized Ge NSs:
This model describes a nanosheet that is covalently bonded to two overlayers at both sides, where the thickness of the each carbon overlayer can be determined using Equation S3:
(
IOv IGe)(
SFGe SFOv)
=(
1-e -dC-C+dGe lC-C)(
1+e -(dC-C+dGe) lC-C)
(
1-e -dGe lGe)(
e -dC-C lGe)
(S3) From Equation S3, (1-e -dC-C+dGelC-C )describes signal generated in d
C-C layer, (1+e
-(dC-C+dGe)
lC-C )describes
signal collected from d1 (= 1) and d2 layers, (1-e
-dGe
lGe) describes signal generated from d
Ge layer,
and (e
-dC-C
lGe ) describes signal collected from d
2 layer. While EquationS3 describes the relationship
d
Ged
C-Cd
3d
1between carbon and germanium intensities collected from a single GeNSs (n = 1), photoelectrons generated from the sheets stacked beneath can also reach the detector and must be considered. When two layers of functionalized GeNSs are involved (n = 2), the correlation of carbon layer thickness dC-C and germanium layer thickness dGe can be expressed as Equation S4:
(
IC-C IGe)(
SFGe SFC-C)
=(
1-e -dC-C+dGe lC-C)(
1+e -(dC-C+dGe) lC-C +e -(2dC-C+dGe) lC-C +e -(2 dC-C+2dGe) lC-C)
(
1-e -dGe lGe)(
e -dC-C lGe +e -2dC-C lGe)
(S4)When three layers of functionalized GeNSs are involved (n = 3) Equation S5 is used:
(
IC-C IGe)(
SFGe SFC-C)
=(
1-e -dC-C lC-C)(
e -(2 m-1)×dC-C lC-C m=1 3å
+ e -2 m×dC-C+m×dGe lC-C m=0 2å
)
(
1-e -dGe lGe)(
e -(2 m+1)×dC-C+m×dGe lGe m=0 2å
)
(S5)Equation S6 give photoelectrons collected from the top n layers of functionalized GeNSs:
(
IC-C IGe)(
SFGe SFC-C)
=(
1-e -dC-C lC-C)(
e -(2 m-1)×dC-C lC-C m=1 nå
+ e -2 m×dC-C+m×dGe lC-C m=0 n-1å
)
(
1-e -dGe lGe)(
e -(2 m+1)×dC-C+m×dGe lGe m=0 n-1å
)
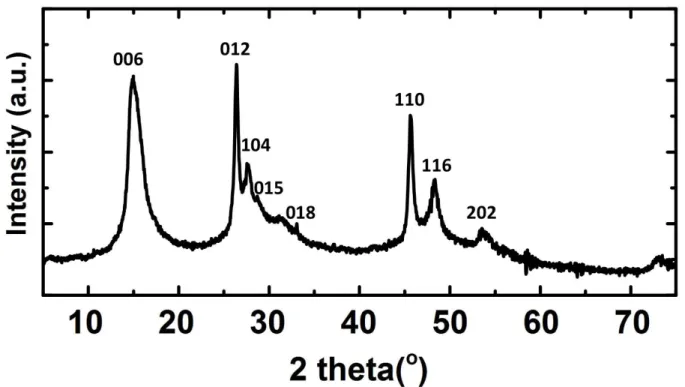
(S6)Figure S2: XRD patterns of as-synthesized HGe-flakes. The reflections of the regularly stacked sheets can be indexed by tr6 CaGe2 unit cell with a = 3.99 Å and c = 33.0 Å.
Figure S3: EDX output for HGe-flakes. 0 1 2 3 4 5 6 keV 0 20 40 60 80 100 cps/eV Ge Ge C Cl Cl O Ca Ca
Figure S4: Survey X-ray photoelectron spectrum of HGe-flakes.
800
700
600
500
400
300
200
100
0
Ge LMM Ge 3d Ge3p Cl 2p C 1sa
.u
.
B.E.(eV)
O 1sFigure S5: Diffuse reflectance spectroscopy of HGe flakes (black), radical- induced functionalized (red) and thermally-induced functionalized (blue) dodecyl-GeNSs.
Figure S6: Survey X-ray photoelectron spectra of CaGe2 (top), dodeceyl-terminated GeNSs
prepared by thermally-induced hydrogermylation (middle) and dodeceyl-terminated GeNSs prepared by radical-initiated hydrogermylation (bottom).
750
600
450
300
150
0
Ge LMMB.E.(eV)
a
.u
.
Radical
Thermal
Ca 2p Ge LMM Ge 3d Ge 3p Cl 2p C 1s O 1sCaGe2
Figure S7: High-resolution X-ray photoelectron spectra of CaGe2 (top), dodecyl-terminated
GeNSs prepared by thermally-induced hydrogermylation (middle) and dodecyl-terminated GeNSs prepared by radical-initiated hydrogermylation (bottom).
Figure S8. Electron diffraction pattern simulation results for non-fully exfoliated GeNSs using a)
h2 and b) tr6 unit cell parameters. The diffraction patterns shown in the red boxes are enlarged by
Figure S9: Top: Bright-field TEM images (a,b) and HRTEM (c) of dodecyl-terminated GeNSs prepared by thermal hydrogermylation. Bottom: bright-field TEM images (d,e) and HRTEM (f) of dodecyl-terminated GeNSs prepared by radical-initiated hydrogermylation.
a)
b)
c)
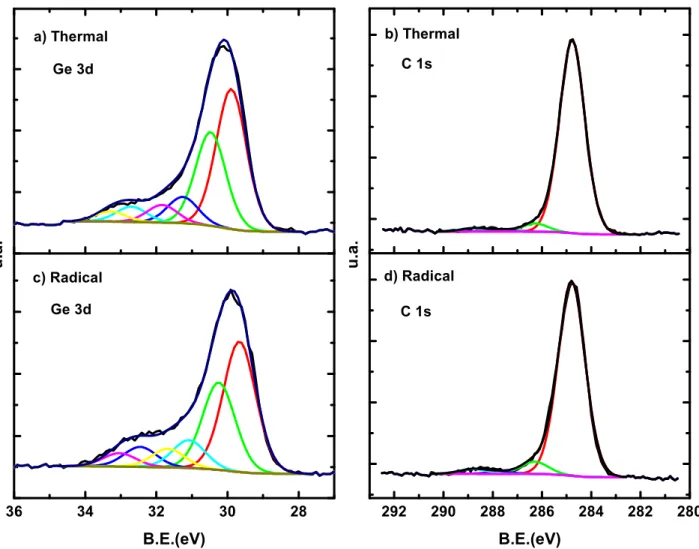
Figure S10: High-resolution X-ray photoelectron spectra of dodecyl-terminated GeNSs Ge 3d (left) and C 1s (right) signals, prepared by thermally-induced hydrogermylation (top) and dodecyl-terminated GeNSs prepared by radical-initiated hydrogermylation (bottom)
References
(1) Helbich, T.; Lyuleeva, A.; Höhlein, I. M. D.; Marx, P.; Scherf, L. M.; Kehrle, J.; Fässler, T. F.; Lugli, P.; Rieger, B. Radical-Induced Hydrosilylation Reactions for the Functionalization of Two-Dimensional Hydride Terminated Silicon Nanosheets. Chem. – Eur. J. 2016, 22 (18), 6194– 6198.
(2) Bianco, E.; Butler, S.; Jiang, S.; Restrepo, O. D.; Windl, W.; Goldberger, J. E. Stability and Exfoliation of Germanane: A Germanium Graphane Analogue. ACS Nano 2013, 7 (5), 4414–4421. (3) Cultrara, N. D.; Wang, Y.; Arguilla, M. Q.; Scudder, M. R.; Jiang, S.; Windl, W.; Bobev, S.; Goldberger, J. E. Synthesis of 1T, 2H, and 6R Germanane Polytypes. Chem. Mater. 2018, 30 (4), 1335–1343.
(4) Plymale, N. T.; Dasog, M.; Brunschwig, B. S.; Lewis, N. S. A Mechanistic Study of the
36 34 32 30 28 Ge 3d Ge 3d u .a . B.E.(eV) c) Radical a) Thermal 292 290 288 286 284 282 280 C 1s d) Radical u .a . B.E.(eV) C 1s b) Thermal
Oxidative Reaction of Hydrogen-Terminated Si(111) Surfaces with Liquid Methanol. J. Phys.
Chem. C 2017, 121 (8), 4270–4282.
(5) Webb, L. J.; Nemanick, E. J.; Biteen, J. S.; Knapp, D. W.; Michalak, D. J.; Traub, M. C.; Chan, A. S. Y.; Brunschwig, B. S.; Lewis, N. S. High-Resolution X-Ray Photoelectron
Spectroscopic Studies of Alkylated Silicon(111) Surfaces. J. Phys. Chem. B 2005, 109 (9), 3930– 3937.
(6) Knapp, D.; Brunschwig, B. S.; Lewis, N. S. Chemical, Electronic, and Electrical Properties of Alkylated Ge(111) Surfaces. J. Phys. Chem. C 2010, 114 (28), 12300–12307.