HAL Id: hal-01652057
https://hal.archives-ouvertes.fr/hal-01652057
Submitted on 29 Nov 2017HAL is a multi-disciplinary open access archive for the deposit and dissemination of sci-entific research documents, whether they are pub-lished or not. The documents may come from teaching and research institutions in France or abroad, or from public or private research centers.
L’archive ouverte pluridisciplinaire HAL, est destinée au dépôt et à la diffusion de documents scientifiques de niveau recherche, publiés ou non, émanant des établissements d’enseignement et de recherche français ou étrangers, des laboratoires publics ou privés.
The impact of water and nitrogen depletion on Aphis
pomi infestation in the apple orchard and its relation
with the useful fauna and ants.
M. Laghfiri, I. Madani, A.J. Boutaleb, A. Blenzar, Marie Odile Jordan,
Marie-Helene Sauge, Pierre-Eric Lauri, C. Smaili
To cite this version:
M. Laghfiri, I. Madani, A.J. Boutaleb, A. Blenzar, Marie Odile Jordan, et al.. The impact of water and nitrogen depletion on Aphis pomi infestation in the apple orchard and its relation with the useful fauna and ants.. Journal of Materials and Environmental Science , Mohammed Premier University, 2018, 9 (1), pp.145-154. �10.26872/jmes.2018.9.1.18�. �hal-01652057�
Laghfiri et al., JMES, 2018, 9 (1), pp. 145-154 145
J. Mater. Environ. Sci., 2018, Volume 9, Issue 1, Page 145-154
https://doi.org/10.26872/jmes.2018.9.1.18
http://www.jmaterenvironsci.com
Journal of Materials and Environmental Sciences ISSN : 2028-2508 CODEN : JMESCN
Copyright © 2017, University of Mohammed Premier Oujda Morocco
1. Introduction
The modernization of the arboriculture sector and its arboreal intensification requires the control of all production factors, including irrigation, fertilization and plant protection. The green Apple aphid, Aphispomi, is among the pests that must be watched and controlled.It can be developedin a fairly rapid way in favorable conditions. Thus, it is considered the second major scourge of Apple after Cydiapomnella. It is known by its polyphagia and mainly by its resistance to several active substances such as pyrethroid and neonicotinoid [1] . In addition to the Apple tree, on which the green apple aphid is considered very harmful, it also attacks other Rosaceae core and sometimes also other Rosaceaepip [2,3].
The stomata closure is the most important tool adopted by plants to reduce water losses in a situation of water stress [4] .This closure will result in physiological, morphological and phenological changes. The CO2 input is also prevented when the closure causes the disruption of the photosynthetic activity. Closing traps much of the energy to be dissipated by translation, which results in the increase of leaf temperature.
Previous studies have shown the effect of aphids on plant photosynthesis [6] and on the induction of gene involved in the senescence of leaves [7]. In contrast, the abundance of aphids was affected by the physiological state of host plant [8], in particular, the nitrogen status in the plant [9,10]. Moreover, the water status of plant tissues can affect the growth of aphid by making it difficult of tap the phloem exudate [11]. In addition, several studies reported that development of pests is favored by the performance of plant growth [12,13]
The soil and plants water stress influenced the growth rate of aphid’s population on Cowpea. Thus, the number of aphids per plant was significantly lower in the resistant varieties than that observed in the aphid-susceptible varieties [4]. Therefore, the current study aimed at work we will evaluating the ability of strategically using nitrogen fertilization and irrigation practices through their positive impact on plant growth and water and nitrogen status of the plant tissues to control the green apple green aphid infestations.
Journal of materials and Environmental Sciences ISSN : 2028-2508
Copyright © 2017,University of
Mohammed Premier Oujda Morocco
The impact of water and nitrogen depletion on Aphis pomi infestation in the
Apple orchard and its relation with the useful fauna and ants
M. Laghfiri
1, I. Madani
1, A.J. Boutaleb
2, A. Blenzar
1,M.O. Jordan
3,
M.H. Sauge
3, P. E. Lauri
3,C. Smaili
41. Laboratory of Biology, Faculty of Science Meknes, University MoulayIsmailPB 11201, Avenue Zitoune Meknes, Morocco 2. Laboratory of Entomology,School of Agriculture, Meknes
3.Laboratory of NARI, Avignon, France 4. Laboratory of NARI, Kenitra, Maroc
Abstract
This work aims to establish an ecologically integrated strategy for pest management to assess the impact of water and nitrogen depletion on Aphis pomi infestation in the Apple orchard.The results of the study of the impact on the green Apple aphid show a significant effect on the availability of water and nitrogen on the level of Aphis pomi infestation. Indeed, the normal fertigation regime (T1 = 100%) proved to be more favorable to a prominent development of aphids, in comparison with a 25% water and nitrogen deficit regime (T2 = 75%), that minimize infestation. As for the evolution of wingless aphid and green aphid with wing, the Aphis pomi, at both regimes, the general shape of the evolution of winged curves looks like the one of the wingless ones, with small differences. The number of leaves was higher in the T1 regime than that of T2. Moreover, the study of the orientation effect on the infestation of aphids has shown that the North andthe West sides were more infested than the East and the South ones. A negative effect on Syrphesp and ChrysoperlaCarnea densities was noticed under water and nitrogen depletion.
Received 06Jun 2017, Revised 16Aug 2017, Accepted 26 Aug 2017 Keywords Aphis pomi water depletion nitrogendepletion infestation, useful fauna. laghfirimalaaynine@gmail.com Phone: +212613397660
Laghfiri et al., JMES, 2018, 9 (1), pp. 145-154 146 2. Materials and Methods
2.1. Experimental
plot
The study was carried out at the EL HARTI farm located in the region of ImouzzerKandar at a 998 meter altitude. The altitude of the region and its climate, brand a favorable conditions for the crops of Rosacea and mainly apple crops.The main agricultural activity of the region remains the apple production.
The experiment was realized in an orchardof the variety gala Grafted on M9 rootstock. The trees are3 years old, with a density of 2025 trees/hectare, and a spacing of 3,95m between rows and1,25m between trees on the row. The medium height of the trees is 3,5m and the rows are orientated North-South.
A new system of irrigation on the targeted plot was installed on April 1st, 2015 to ensure an independent irrigation management system of the rest of the farm (photo 1).A micro station was installed to manage the irrigation and contain thefertilization. This station consists of:
A pump of a flow rate in order of 5,5 m3/hour which was installed at the basin storing water
A filter with discs
Eight solenoid valve assuring each the irrigation of a treatment
A small water storage basin (18 m3) was constructed close to the water source and the experimental plot (photo 5). This basin also served in a tank for the direct mixture of the final solution of fertilizers
2.2. Production practices of the trial 2.2.1. Irrigation
The irrigation and the nitrogen inputs were the main factors of concern in this experiment.They wereconducted according to the method of the fixed doses with different frequencies.
Reasoning the irrigation started with the soil characteristics. A soil samples were taken from the experimental plot and sent for the analysis of some physical properties such as soil field capacity (FC), permeability, porosity, and soil bulk density (SBD). Then, the soil root depth (Z) was determined by observing the soil volume containing the maximum root concentration. Finally, the moistened sol surface percentage (MSSP) was estimated using Keller and Karmeli (1974) method.
These different parameters were combined to calculate the Maximum Net Dose (MND) to be given using the following formula.
MND = f x (FC-PWP) x SBD x Z x MSSP)
Where f is a factor determining the soil available water content percentage threshold value to start the irrigation. In other words, the f value will determine the irrigation frequency.
All the parameter determining MND are calculcate or measure at the start of the trial. The f is the only variable parameter in the formula. Two value were chosen for this study; f1 = 10% and f2 = 20 %.
The value of 10% assigned to f1 means that the irrigation will start once 10% of the soil available water content was depleted. The same thing applies for 20 %. Therefore, the MND value changes whenever f value changes.
2.2.2.Root fertilization (NPK and Ca)
To avoid interactions of the effects of the water deficit with the effects of a high salinity, the method of fertilization adopted in this test is the fixed EC fertilization. It consists of giving the trees a nutrient solution with a fixed electrical conductivity (EC-fixe), with different nutrient content according to the requirements of the different Phenological stages. Also, the depletion rate applied was the same for water and fertilizer. For example, a treatment with a 50% depletion rate will receive 50% less water and 50% less fertilizer in comparison with the 100% treatment.
The fertilization programs adopted throughout the cycle blooming to maturation were as follows (table 1)
2.3. Determination of the parameters used 2.3.1. Determination of the daily water dose
The determination of the three daily doses of irrigation is based on the method of the water balance sheet. The calculation of cultural evapotranspiration (ETc) is carried out using evapotranspiration data from references "ETo" provided by the weather station available in the experimental site. The formula used for calculating ET0 is Penman Monteith
ET =
0.4O8∆. Rn − G γ
900
t+273
u
2(e
a− e
d)
∆ + γ. (1 + 0.34u
2)
Laghfiri et al., JMES, 2018, 9 (1), pp. 145-154 147 ETc = ET0 * Kc
The cultural coefficient Kc used in this study depends on the phonological stage of the apple tree that is published in the newsletter 56 of the FAO [14]. The following picture introduces values of Kc for different stages of growth of the apple tree (table2)
Table 1.Fertilization Program according to the phonological stages. Phenological stage Period Fertilizer (g/m3) Ammonium Nitrate Phosphoric acid Calcium Nitrate Potassium Nitrate Blosson From 18/04 to 01/05 140 25 50 0 Fruit-set From 02/05 to 31/05 170 30 60 0 Swelling From 01/06 to 19/06 170 30 60 0 From 20/06 to 26/06 0 0 0 0 From 27/07 to 10/07 140 0 80 60 From 11/07 to 10/07 140 0 0 60 Maturation From 27/07 to 01/05 140 0 0 0 From 03/08 to 12/08 140 0 80 0
Table 2.Kc values according to FAO (Bulletin 56).
Stage Kc
Fruit set 0.45
Swelling 0.90
Maturation 0.70
Harvest 0.10
The irrigation daily doses which depend of the depletion rates defined as a percentage of the water requirements of the apple trees are the following:
D1= 50% ETc D2= 75% ETc D3=100% ETc 2.3.2.Definition of the treatments applied
Once all the parameters were determined, six irrigation treatments were defined. Two other treatments were added. One based on the data of a neutron probe (T7) and another one considered as a Check(T8).Theoverall treatments are listed in table 3.
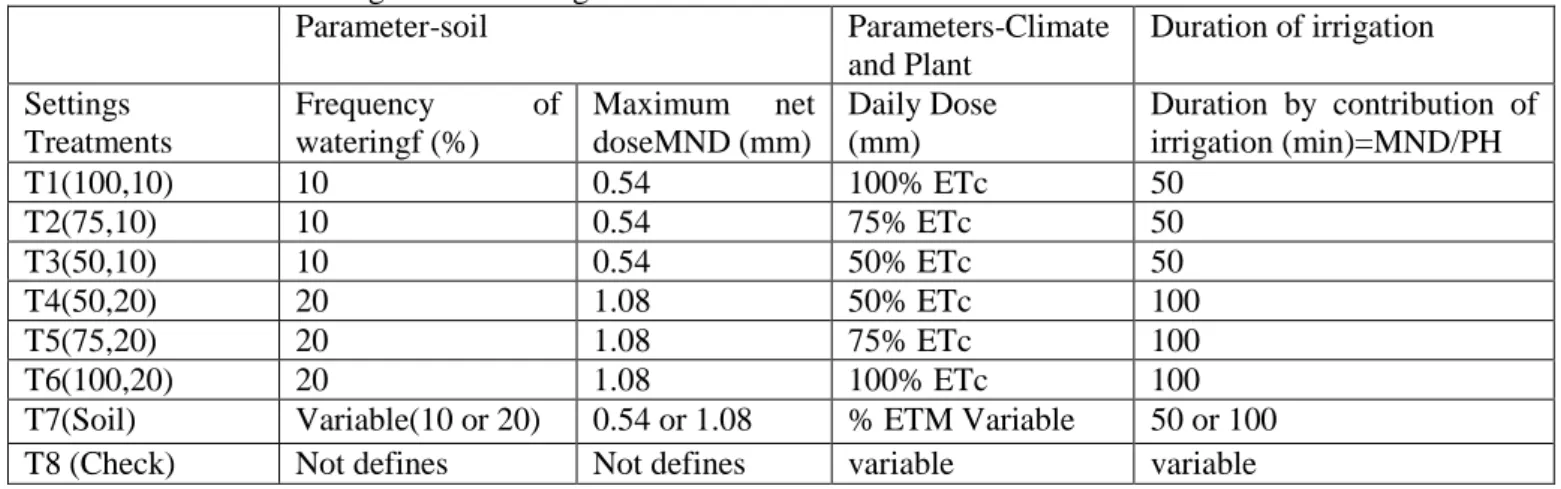
Table 3.Parameters of irrigation according to treatments
Parameter-soil Parameters-Climate and Plant Duration of irrigation Settings Treatments Frequency of wateringf (%) Maximum net doseMND (mm) Daily Dose (mm) Duration by contribution of irrigation (min)=MND/PH T1(100,10) 10 0.54 100% ETc 50 T2(75,10) 10 0.54 75% ETc 50 T3(50,10) 10 0.54 50% ETc 50 T4(50,20) 20 1.08 50% ETc 100 T5(75,20) 20 1.08 75% ETc 100 T6(100,20) 20 1.08 100% ETc 100
T7(Soil) Variable(10 or 20) 0.54 or 1.08 % ETM Variable 50 or 100
T8 (Check) Not defines Not defines variable variable
2.3.3.Monitoring of the populations of aphids
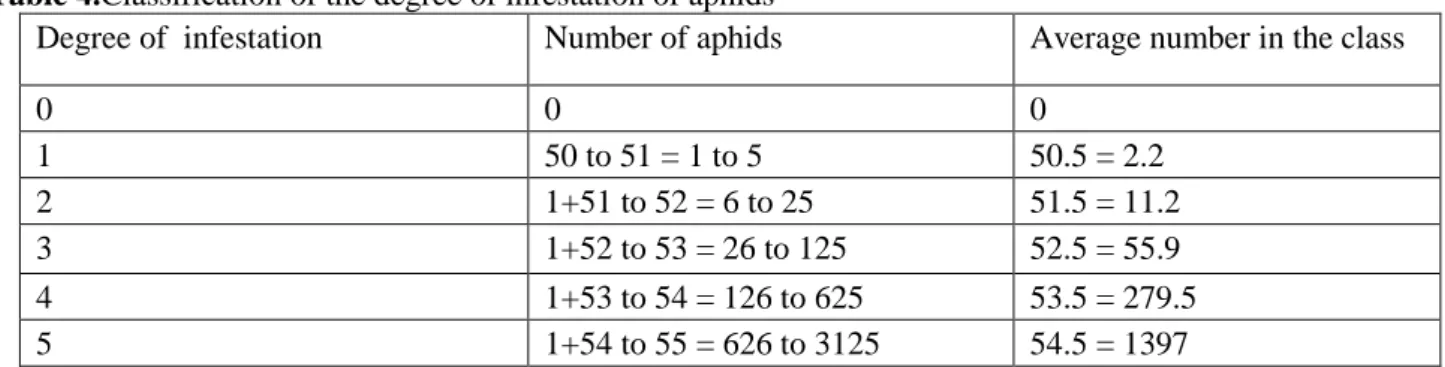
To assess the degree of infestation of aphids on the trees, a monitoring was done every week on mixed branch where the degree of infestation for every type of vegetative and fruit-bearing branch at the four cardinal directions and in both treatments of fustigation according to the classification of [15] (table 4) was wrote down.
Laghfiri et al., JMES, 2018, 9 (1), pp. 145-154 148 Table 4.Classification of the degree of infestation of aphids
Degree of infestation Number of aphids Average number in the class
0 0 0 1 50 to 51 = 1 to 5 50.5 = 2.2 2 1+51 to 52 = 6 to 25 51.5 = 11.2 3 1+52 to 53 = 26 to 125 52.5 = 55.9 4 1+53 to 54 = 126 to 625 53.5 = 279.5 5 1+54 to 55 = 626 to 3125 54.5 = 1397
By giving a degree of infestation on the scale of the tree (number of shoot infested) and from the degree of infestation (number of individuals by shoot), an indication of infestation (IF) was calculated according to following expression:
IF= Σ (d x fd)/ (5 x Σfd)[16].
With d=degree of infestation included between 0 and 5 and fd =frequency of shoot by tree with the degree of including infestation d between 0 and 5.
For the winged and for the benefits they are directly counted with the bare eye on every marked branch and at every direction at the same time by the notation of the degree of infestation of aphides throughout the period of trial. Besides, a monitoring of other arthropods was assured, also, during the period of this study.The evolution of their enrolment in touch with types of fertigation and the different correlations with aphids and the natural enemies were noted.
2.4. Statistical analyses
All the data collected was subjected to analysis of variance (ANOVA) using the statistical software SAS (SAS Institute, Cary, NC, USA), SPSS (Version 20), and Excel 2010 version. The test of Shapiro-Wilk normality allowed us to verify the normality of the infestation index before subjecting it to the analysis of variance.
3. Results and discussion
3.1.Effect of water and nitrogen stress on the infestation of wingless populations of the green apple aphid. The follow-up of the wingless populations of the green apple aphid in the orchard was carried out by an infestation score assigned to each interval according to the number of aphid individuals it contains (Table 4). The objective is to evaluate the effect of water and nitrogen stress on green apple aphid infestation, based on surveys carried out once or twice a week on trees subjected to two fertilization regimes (T1 and T2). The results obtained are shown in Fig 1.
Fig. 1.Comparison of average infestation index (mean ± standard error) of populations of Aphis pomi on apple for two fertigation regimes (T1 and T2).
Figure 1 shows that aphid infestation remained different at both treatments throughout the follow-up period. Indeed, it is more important in the T1 treatment than in the T2 treatment.
A gradual evolution of the level of infestation was observed from the first week of May to reach its maximum one month later; always with a higher infestation rate in trees that receive more water and fertilizing elements (T1) than those subjected to water and nitrogen stress (T2).
-0.1 0 0.1 0.2 0.3 0.4 0.5 02/05/2014 04/05/2014 11/05/2014 20/05/2014 25/05/2014 01/06/2014 08/06/2014 15/06/2014 19/06/2014 22/06/2014 25/06/2014 29/06/2014 02/07/2014 06/07/2014 09/07/2014 13/07/2014 17/07/2014 20/07/2014 23/07/2014 31/07/2014 In d e x o f i n festat io n T1 T2
Laghfiri et al., JMES, 2018, 9 (1), pp. 145-154 149 PRICE and al [17] confirmed that deficiency of water may also affect the composition and concentration of secondary plant compounds, which has a marked effect on the survival of aphid larvae [4]. The induced changes in the condition of plants hosts can have important consequences on the dynamics of herbivore populations through effects on the development and survival of immature individuals.
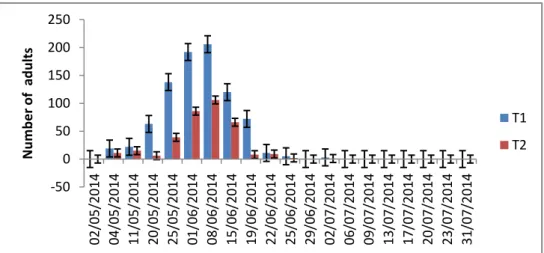
3.2.Effect of restriction of water and nitrogen on the fluctuation of adult populations of green apple aphid. Winged aphids decrease usually occur when conditions become unfavorable to normal development (no feeding, difficult environmental conditions, predation and / or high parasitism, etc.), in order to leave the environment to other hosts where circumstances, of normal survival, are available. Unlike wingless adults, adult surveys were based on a direct count of their number at the selected shoots. The main purpose of their monitoring was to see if there is a possible impact of the restriction of water and nitrogen on their appearance and disappearance. The figure below shows the results of the monitoring over time.
Fig. 2.Cumulative comparison of Aphis pomi adults (total number ± standard error) between the two fertigation regimes at the peach level.
The first appearance of the adults, at the level of the two regimes (regime T2) began from the first week of May (04/05/2014). Towards the beginning of the third week of May (exactly in 20/05/2014), a highly significant effect of water and nitrogen on the development of winged individuals begun. Significant differences between the two fertigation regimes with respect to the winged individuals of the green apple aphid appeared. These differences remained significant until mid-May with a still greater number of adults on trees with water and nitrogen than those under stress.
As for the disappearance of the winged forms, it was relatively early in the T2 regime compared to the T1 regime. Indeed, a complete exit of the aphids of the regime T2 was observed from 25/06/2014, whereas the departure of those of the regime T1 takes place the 02/07/2014).
Plants primarily need, for their growth and development, water, mineral substances from the soil, CO2 and O2 from the atmosphere. Indeed, fresh plant matter constitutes 70-80% of water [18]. However, water stress can affect the normal functioning of the apple tree, as in other fruit trees, by affecting the different parts and metabolic and physiological activities of this fruit tree [19]. Water deficit can also cause a decrease in the total production of leaves and lateral branches of the young apple trees . However, no differencewas found between the leaves of first-order shoots and those grown on second-order shoots[20].Our results on the positive correlation between Aphis pomi and nitrogen fertilization are consistent with the results found by NEVOet al.[21] who reported that nitrogen fertilization of cotton has strongly affected morphology, fertility and intrinsic growth rate of the populations of A. Gossypii. The same conclusions were also drawn by JAHN et al[22] with respect to the effect of nitrogen on fertility, intrinsic growth rate, and survival and body length of H. Setariae on rice plants in the wetlands of the rainforest of in Nigeria.
3.3. Effect of branch orientation on aphid infestation in each of the two fertigation treatments.
During the period of study the four cardinal directions of the tree were considered.Therefore, in each orientation two branches (one vegetative and the other fruiting) were marked and followed in order to have a good representativeness of the data collected on one side, and to see if there is any impact of the orientation on the distribution of infestations of aphid populations within the tree on the other side. The results are shown in the in Fig 3 and Fig 4.
-50 0 50 100 150 200 250 02/05/2014 04/05/2014 11/05/2014 20/05/2014 25/05/2014 01/06/2014 08/06/2014 15/06/2014 19/06/2014 22/06/2014 25/06/2014 29/06/2014 02/07/2014 06/07/2014 09/07/2014 13/07/2014 17/07/2014 20/07/2014 23/07/2014 31/07/2014 N u m b e r o f ad u lts T1 T2
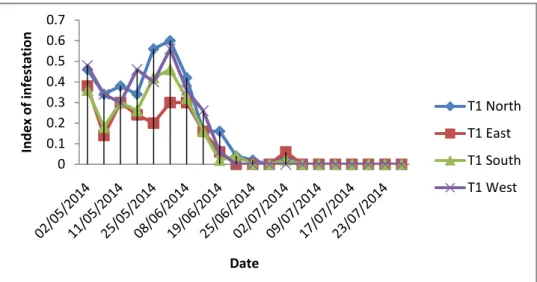
Laghfiri et al., JMES, 2018, 9 (1), pp. 145-154 150 Fig. 3.Comparison of the infestation index (IF ± standard error) at the four cardinal positions in the fertilization regime T1.
Fig. 4.Comparison of infestation index (IF ± standard error) at the four cardinal positions in the T2 fertigation regime.
The results show clearly that there was a significant difference between the cardinal positions the infestation index at the level of the two fertigation regimes (Fig 1 and 2).
Indeed, during early May, no impact of the orientation on the infestation index was recorded at the level of the T1 regime since the survival conditions of the aphids were still favorable (Fig 3). However, the effect of orientation on aphid populations at the T2 regime wassignificant where survival conditions were not adequate for normal development.Therefore, the first week of themonth of May showed a significant concentration of aphids at the North and West orientation, while the second week of the same month revealed a high concentration only at the northern orientation (Fig 4).
On the other hand, from the second week of May to the first week of June, a significant effect of the orientation factor on the aphid infestation rate was observed. Several cardinal positions were found in the trees under the effect of the two fertigation treatments (T1 and T2).This difference caused by the North and West orientations to be the most infested while that of the South and East have remained relatively less infested than other orientations. However, the infestation was similar in the four cardinal directions and in the two treatments (favorable and deficient) towards the second week of June, after which a reappearance of a significant effect of orientation on the index of infestation took place directly after 4 days with still more infestation in the North position than in the other positions of the tree (Figs 3 and 4).
3.4. Evolution of the auxiliary fauna and its impact on the infestation of the green peach aphid at the level of the two fertilization regimes T1 and T2.
In order to compare the diversity of the auxiliaries in the two treatments and also to see if there is a change in their action on the aphids between the favorable and the deficit regimes. The same predators were observed in both regimes with different densities, while only a small number of parasitoids were recorded in T1 treatment.
0 0.1 0.2 0.3 0.4 0.5 0.6 0.7 In d e x o f i n festat io n Date T1 North T1 East T1 South T1 West 0 0.1 0.2 0.3 0.4 0.5 in d e x o f i n festat io n Date T2 North T2 East T2 South T2 West
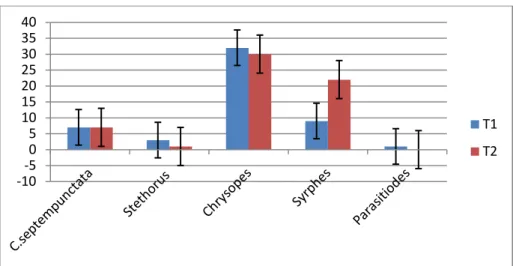
Laghfiri et al., JMES, 2018, 9 (1), pp. 145-154 151 Fig. 5.The auxiliaries recorded in all the follow-ups according to the fertigation regime.
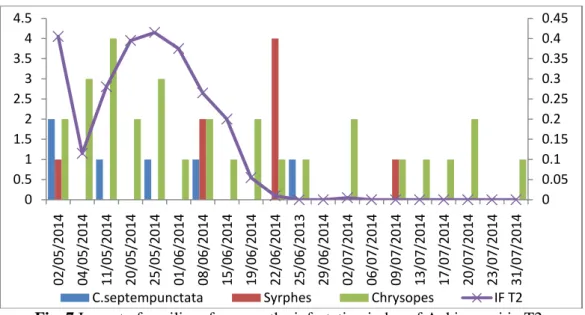
It appears from Figure 5 that there is an effect of water and nitrogen on the diversity of all auxiliary taxa encountered except seven-point ladybugs. However, statistical analysis revealed a significant effect of the fertilization regime on lacewings and ladybirds of the genus Syrphe, which can be explained by the abundance of T1 aphids that constitute a food support attracting predators and parasitoids.Therefore, it is an indirect effect of water and nitrogen on beneficial fauna. Thus, the most favorable diet attracts more natural aphid enemies through populations of aphids. Another consideration is that aphidspopulation on nitrogen-rich treatments are larger.Predators would consume fewer aphids to obtain the same aphid biomass as in other predator-prey relationships [23]. The same conclusion can be drawn from Fig. 6 and 7 which represent the simultaneous evolution of the aphids and auxiliaries. It can be noticed that the lacewings and the lady beetles have been able to control the outbreaks of the aphids and more particularly in theT1 treatment. This is explained by the abundance of aphid at T1.
Fig. 6.Impact of auxiliary fauna on the infestation index of Aphis pomi in T1. -10 -5 0 5 10 15 20 25 30 35 40 T1 T2 0 0.1 0.2 0.3 0.4 0.5 0.6 0 1 2 3 4 5 6 02/05/2014 04/05/2014 11/05/2014 20/05/2014 25/05/2014 01/06/2014 08/06/2014 15/06/2014 19/06/2014 22/06/2014 25/06/2013 29/06/2014 02/07/2014 06/07/2014 09/07/2014 13/07/2014 17/07/2014 20/07/2014 23/07/2014 31/07/2014
Laghfiri et al., JMES, 2018, 9 (1), pp. 145-154 152 Fig. 7.Impact of auxiliary fauna on the infestation index of Aphis pomi in T2.
3.5. Evolution of the average number of winged populations of Aphis pomi in the presence of ants
The evolution, over time, of ant populations is shown in Fig 8. There were no significant differences between the two fertigation regimes with respect to the development of ant numbers during the period of study.
Fig. 8.Average number of ants (mean ± standard error) over time at the two fertilization regimes T1 and T2. Figure 9 shows the evolution over time of the average number of wingless populations of Aphis pomi in the presence of the populations of ants on the apple trees subjected to the two treatments, T1 and T2.
Fig. 9.Numerical evolution of the mean number of wingless populations of Aphis pomi in the presence of ants on trees of the apple tree under two fertilization regimes T1 and T2.
0 0.05 0.1 0.15 0.2 0.25 0.3 0.35 0.4 0.45 0 0.5 1 1.5 2 2.5 3 3.5 4 4.5 02/05/2014 04/05/2014 11/05/2014 20/05/2014 25/05/2014 01/06/2014 08/06/2014 15/06/2014 19/06/2014 22/06/2014 25/06/2013 29/06/2014 02/07/2014 06/07/2014 09/07/2014 13/07/2014 17/07/2014 20/07/2014 23/07/2014 31/07/2014
C.septempunctata Syrphes Chrysopes IF T2
-50 0 50 100 150 200 02/05/2014 04/05/2014 11/05/2014 20/05/2014 25/05/2014 01/06/2014 08/06/2014 15/06/2014 19/06/2014 22/06/2014 25/06/2014 29/06/2014 02/07/2014 06/07/2014 09/07/2014 13/07/2014 17/07/2014 20/07/2014 23/07/2014 31/07/2014 T1 fourmis T2 fourmis 0 1000 2000 3000 4000 5000 0 50 100 150 200 02/05/2014 04/05/2014 11/05/2014 20/05/2014 25/05/2014 01/06/2014 08/06/2014 15/06/2014 19/06/2014 22/06/2014 25/06/2014 29/06/2014 02/07/2014 06/07/2014 09/07/2014 13/07/2014 17/07/2014 20/07/2014 23/07/2014 31/07/2014 T1 pucerons aptères T2 pucerons aptères
Laghfiri et al., JMES, 2018, 9 (1), pp. 145-154 153 It seems that there is a month difference between the maximum development of the aphids (at the beginning of June) and that of the evolution of the ants (at the beginning of July), whereas, normally, one must have a superposition of the two evolution peaks as the ants are attracted by the drops of the honeydew excreted by the aphids. Moreover, regardless of the number of aphids at the two fertigation regimes, the ant numbers remained virtually constant throughout the period of the presence of the green apple aphid on the branches. This can be explained by the movement of these ant populations to other important aphid colonies on other shoots of trees other than those studied (8 shoots per tree).
Fig. 10.Numerical evolution of the average number of winged populations of Aphis pomi in the presence of ants on trees of the apple tree subjected to two fertilization regimes T1 and T2.
On the other hand, a delay in the appearance of the adults in the aphid colonies was observed during the season, as the first apparitions occurred only towards the end of April, for the two fertigation treatment, whereas they should normally take place at the end of March (Figure 10). This may be due to favorable nutrition conditions (availability of nitrogen) and also to the positive effect of micro-climate (water resources) at the two fertigation regimes in the absence of any treatment that could disrupt development as well as the other benefits of these aphids to ants such as protection from predators and parasitoids and maintenance of colonies.
The same conclusions were drawn by Remaudiereand al[24], who reported that the ants treated by ants are more numerous than those that are not and that the reproduction of A. Fabae populations may be favored by the presence of ants if the benefits derived from these aphids exceed the costs generated by the protection and hygiene of their colonies.
As for the orientation effect on the Aphid pomi outbreak, we found out that the green apple aphid is attracted by the northern orientation. Laghfiriet al [25] found that the green peach aphid is more dominant in orientation north and west.
4. Conclusions.
The species Aphis pomi has strongly proven that they are dependent on water and trophic status of apple trees. In fact, a fairly large infestation was recorded in the two considered regimes of fertigation, especially between mid-May and mid-June. However, the distinction between the levels of infestation of the wingless aphids of the two fertigation regimes appeared statistically in early June. On the other hand, the winged aphids were too affected by water and nitrogen condition. Thus, the first winged individuals were being recorded on the trees of the second fertigation system (75%) towards the second week of May. However, as they occur in the first regime (100%) during in late May, the winged population was always more important than that recorded in the other regime. The importance of winged individuals is directly related to the availability of water and nitrogen supply of trees as well as the density of the wingless aphids.
Concerning the cardinal positions of the tree, a significant impact was demonstrated during the study period. The aphids seem to be attached particularly to the North orientation and secondly to the West one. The other two directions remained less infested than the first ones.
0 20 40 60 80 100 120 140 160 0 50 100 150 200 250 300 350 400 450 02/05/2014 04/05/2014 11/05/2014 20/05/2014 25/05/2014 01/06/2014 08/06/2014 15/06/2014 19/06/2014 22/06/2014 25/06/2014 29/06/2014 02/07/2014 06/07/2014 09/07/2014 13/07/2014 17/07/2014 20/07/2014 23/07/2014 31/07/2014 T1 ailés T2 ailés T1 fourmis T2 fourmis
Laghfiri et al., JMES, 2018, 9 (1), pp. 145-154 154 References
1. F. Servine, C. Laetitia, Lyon Laboratory Unit Resistance to Phytosanitary Products. 14(2012). 187. 2. A. Sekkat, Thèse doctorat d’Etat. Univ. Scien.Tech. du Languedoc : 220p.
3. A. Sekkat,.et K. Laghrissi, Acte. Int. Agro. Vet., 4 (1984) 105-111.
4. F. Tardieu et E. Dreyer, INRA : Institut National de Recherche Agronomique (1997).41-59. 5. S. Agele, T. Ofuya, et P.James, J. CropProtec. 25 (2006) 78.
6. M.W. Varn, Virginia Polytechnic InstitLite and State University. 25 (1987) 165. 7. V. Pegadaraju, C. Knepper, J. Reese, J. Shah, J. Plant Physiol. 139 (2005) 1934. 8. T.C.R. White, Biol. Rev. 83 (2008)248.
9. F T. Davies, C J. He, A. Chau, Heinz K M., Cartrnill A D., J. Hortic. Sci. 129 (2004) 353. 10. T.L. Wikinson, A.E. Douglas, Entomol. Exp. AppI. 106 (2003) 113.
11. II. Will, B. Van, J. Entomol. Exp. AppI. 127(2008) 245.
12. L. DeBruyn, J. Scheirs, R.Verhagen, Oecologia.130(2002) 599. 13. T. Teder, T.Tainmararu, J. Ecol. Entornol. 27 (2002)104.
14. R.G. Allen, L.S.Pereira, Raes, D. Crop evapotranspiration-Guidelines for computing crop water
requirements-FAO. Irrigation and drainage paper 56. FAO, Rome, 300 (1998) 9.
15. F. Leclant, Bull. Techn. Inform. 249(1970). 259-274.
16. F. Leclant, Thèse de doc. Etat. Univ. Scie. Tech. Languedoc, (1978). 318p. 17. P W. Price, Oikos. 62 (1991) 251.
18. R. Heller, R.Ensault et C. Lance, Edition MASSON (1993) 42-67.
19. A.Tayim.,Mémoire de Fin d’Etudes, Option : Sciences et Techniques en Productions Fruitières, ENA de Meknès. ( 2006). 128p.
20. S.L. Steinberg, JC.Miller et MJ. Mcfarland, Australian J. Plant Physiol 17 (2002) 23 – 36. 21. E. Nevo, M. Coll, J. Econ. Entomol.94(2001)32.
22. G. Jahn, L.Almazan, J. Pacia, J. Envir. Entomol.34 (2005) 943.
23. A. A. Aljetlawi, E. Sparevik et K.Leonardsson., J. Anim. Ecol. 73(2004) 239-252. 24. G. Remaudiere, G. Iperti, F. Leclant, M.F. Mivhel,Entomophages, 6-1970)32p.
25. M. Laghfiri, B. Khalil, I. Madani, J A. Boutaleb, A. Blenzar, I. J. Sci. Research 4 (2015). 1542-1557.