HAL Id: hal-03128346
https://hal.archives-ouvertes.fr/hal-03128346
Submitted on 3 Feb 2021HAL is a multi-disciplinary open access archive for the deposit and dissemination of sci-entific research documents, whether they are pub-lished or not. The documents may come from teaching and research institutions in France or abroad, or from public or private research centers.
L’archive ouverte pluridisciplinaire HAL, est destinée au dépôt et à la diffusion de documents scientifiques de niveau recherche, publiés ou non, émanant des établissements d’enseignement et de recherche français ou étrangers, des laboratoires publics ou privés.
Authenticating the TV User by Biometric Continous
Measurements
Regina Bernhaupt, Guillaume Pottier, Michael Pirker, Dimitri Drouet,
Alexandre Battut
To cite this version:
Regina Bernhaupt, Guillaume Pottier, Michael Pirker, Dimitri Drouet, Alexandre Battut. Authenti-cating the TV User by Biometric Continous Measurements. International Broadcasting Convention, Sep 2017, Amsterdam, Netherlands. �hal-03128346�
AUTHENTICATING THE TV USER BY BIOMETRIC
CONTINUOUS MEASUREMENTS
R. Bernhaupt, G. Pottier, M. Pirker, D. Drouet & A. Battut
ruwido austria gmbh, Austria & IRIT, France
ABSTRACT
This paper presents results from a feasibility study investigating biometric continuous measurements to identify the user holding a remote control. The study investigated a combination of accelerometers, temperature and humidity sensors and measuring skin conductance/resistance to investi-gate if a simple pick-up of a remote control can be sufficient to identify us-ers in a household. Results show that eight repetitions of the movement of pick-up are enough to identify five users in a household with the necessary recognition rate validity of close to 100%. To investigate the overall user experience and acceptance of such an approach, a user study with twelve participants was performed, with an UI simulating the authentication and the personalization of the content. The hedonic quality is improved by such a method and pragmatic quality is reasonable compared to other re-mote controls and overall results indicate that users in this study accept the solution. Based on this study we developed a set of guidelines that help to implement such a solution in the user interface to support the nec-essary user experience dimensions of identity, stimulation, perception of privacy and overall user acceptance.
INTRODUCTION
We are living in an era of recommendations, customised services and tailored content. In order to provide content that is interesting for a (single) user, the system must identify the user – either by having the user identify herself in front of the TV by entering a pin-code, or using alternative means of identification via connected devices. At this identification step, any modern remote control including an orientation sensor can help: it can provide the in-formation who currently controls the TV, replacing tedious log-in procedures, by identifying the user based on biometric continuous measurements.
Identification of users based on biometrics characteristics is nothing new in the living room. Innovative projects like Bernhaupt et al (1) and Wilfinger et al (2) using fingerprint have been already conducted in 2010 and 2009.
The goal of this research was to investigate the feasibility of a remote control (currently already applied in the market) that identifies the user via simple biometric data within a few seconds after being picked up. Building on findings from the biometrics research field that showed that bio-feedback obtained by measuring skin conductance or resistance,
beat, temperature or humidity can be used to identify a set of users, this study explored the combination of a 9-axis sensor in conjunction with Galvanic Skin Response sensors (GSR) for user identification, limited to the pick-up gesture of the remote control, either with the left or the right hand.
The main goals of this feasibility study were to investigate:
· the number of different users that can be distinguished using the sensor data,
· which part of the sensor data or combination of data from the sensors allows user identification with a precision of 95% or higher, and
· the number of different users that can be identified within 3 seconds after picking up the remote control.
RELATED WORK
Physical or behavioural characteristics of humans can be used to identify or authenticate a user while carrying or holding a device. The biometric information used can be divided into soft biometrics and hard biometrics. Soft biometrics (walking gait, weight or bio-impedance) are characteristics that can change over time and are not unique to a user, but still provide some information about the user, allowing identification with a certain degree of accuracy. Zewail et al (3) stated that hard biometrics, like a fingerprint or DNA, are unique to a user, hardly vary, and can be used to classify a user without any doubt.
As stated by He (4) both soft and hard biometrics have been used extensively in the last 15 years to try to identify the user of a system, especially when it comes to mobile phones. There is a broad variety of sensors that have been used. Thus, we limit the related work to the sensors that were applied in our study.
User’s Behavioural Characteristics
According to Terada et al (5), behavioural characteristics can be salient enough to allow differentiation of multiple users by the way they pick up an item. Identification when a de-vice is activated only needs three degrees of freedom as shown by Wolf and Willaredt (6) to identify usage of a device. Terada and colleagues (5) investigated how to identify a user from acceleration data before usage of a device (a hair dryer) to predict usage of electric appliances in advance for the home. They used acceleration data combined with angular velocity (pitch, roll, jaw) at a 100Hz sampling rate. In a study with 10 participants, each performing 10 repetitions of a task, they achieved a recognition accuracy of about 78% for 10 users (ranging from 54% to 100% for the individual users), as well as an average identi-fication accuracy of 94% for a sub-group with high accuracy (four persons) and 82% accu-racy for a low accuaccu-racy sub-group (four persons). Additionally, the same procedure was carried out with a family of four (father, mother, daughter, son), where accuracy of identifi-cation averaged 70%. To enhance identifiidentifi-cation of users via 3-, 6- or 9-axis data, the work of Weiss and Lockart (7) is interesting, showing that also gender, weight and height of a user can be predicted.
Electrical Properties of the Skin
A central physiological characteristic to identify a user is the electrical property of the skin. In 2012 Sato et al (8) presented Swept Frequency Capacitive Sensing (SFCS). They use an electrode with sinusoid sweeps to send current into a conductive object. Then they measure the returned sampled signal that they call the “capacitive profile”. This signal is specific to a touch pattern, so it is compared with other records in order to recognize which pattern was realized.
In 2015, Sato et al (9), extended their work, now measuring bio-impedance with at least a pair of electrodes, allowing the identification of users based on different touch gestures and beyond touch: enabling the identification of users sitting on chairs (measuring differ-ences between clothing resistance). The concept they used has similarities with SFCS, but measures both amplitude and phase components among all combinations of six embed-ded electrodes. They used a wave generator and a RF gain-and-phase detector to capture the frequency response over a wide range of frequencies (1kHz to 1.5MHz in 150 linear steps). 12 subjects delivered 2640 samples per device over a 22-day period, which were analysed for classification accuracy (CA), false acceptance rate (FAR), and false rejection rates (FRR). For analysis, they used 21 of the 22 days of data for training, and tested the data of the remaining day for every combination of days and averaged the results for all combinations. Their results were a 96% CA for a hand-pad device, as well as a 88.5% CA on a phone device.
Harrison et al (10) investigated user differentiation via capacitive fingerprinting, where they achieved a 96% accuracy for distinguishing between two users. These authors highlight that their approach is compact, low-powered and inexpensive, and in real-time with a very short initial calibration. The drawbacks of the system are that it can only differentiate among a small set of concurrent users who can only touch it sequentially, not simultane-ously. These authors also use SFCS and emphasize that this capacitive fingerprinting should not be confused with galvanic skin response (GSR) which measures the conductivi-ty of the skin. In an experiment, they tested their system, and found out that the accuracy plateaus significantly at 0.5 seconds of training data (5 samples per person), resulting in an average accuracy of 96.4%. They also note the limitations of their approach, namely the persistence of the identification, as impedance shifts over time and the personal change variability might be higher than the between-person variability; furthermore, they mention the ground connection, and the need for sequential usage.
IDENTIFYING A USER HOLDING A REMOTE CONTROL Problem Description and Approach
This feasibility study aims to investigate the degree to which a unique user can be identi-fied, and how many users can be distinguished reliably. The results gained should then inform the development of this technology and be used in later stages of this project, where future work includes the investigation of usability and user experience implications of such an approach for authentication and personalisation, as well as user acceptance and user’s experiences, perceptions and concerns with this novel kind of authentication.
Figure 1 – remote control with Arduino sensors (right) and
Arduino breadboard (left)
To investigate how to identify a user holding a remote control, the following methodological approach was applied: (a) identification of sensors: a set of sensors measuring movement (3-axis, 6-axis, 9-axis), galvanic skin response, temperature and humidity was identified; (b) limitation on sensors: only sensors that met the industrial standard for mass production (availability, price) were kept for consideration; (c) sensors with broadest forms of data: based on the state of the art, we identified a combination of sensors that would provide a unique combination of features that could result in the ability to identify a set of five users with less than 10 repetitions of a movement at a very low sampling rate (around 10 Hz); (d) conduct of a technological feasibility study: recording of data during typical usage and identification of best fit of user movement and algorithm; and (e) measuring usability, user experience and acceptance of such a concept in a prototypical TV environment.
Feasibility Study
The feasibility study was conducted using a prototypi-cal remote control in conjunction with additional Ar-duino sensors. The sensors we used were a 9-axis ori-entation sensor (a BNO055 intelligent 9-axis absolute orientation sensor with a 3-axis gyroscope, 3-axis ac-celerometer, 3-axis magnetometer), as well as a GSR module (Grove GSR sensor) via Arduino. The Arduino sensor data from the 9-axis sensor and the GSR sen-sor were logged on a computer in real time, the sample frequency of these sensors was approximately 10Hz. The Arduino Uno microcontroller board was kept sepa-rated from the remote control and was hidden under a small coffee table during the user study (see Figure 1).
The sensors were connected to the microcontroller board using 1.5 metre cables. The 9-axis sensor was attached to the top of the remote control with insulating tape to ensure that it will only move when the remote moves with the user’s hand, and the GSR module was connected to thin copper strips at the sides of the remote control.
The user interface used in the experiment is called line UI and offers standard IPTV func-tionalities, including TV channels, video on demand, an electronic program guide, and voice commands.
Procedure and methodological approach
The study took place in spring 2017 with eleven participants (5 males and 6 females), aged from 23 to 49 years (mean 34 years, SD = 9.31 years) in our usability lab in Neu-markt, Austria. The usability lab is designed to resemble a living room environment, and the user interface that is controlled was running on a Full HD TV in front of the user who was seated comfortably on a couch. Observation was conducted using network cameras on the ceiling of the room, supported by portable cameras on a tripod. The experimenter and one assistant guided the participants through the study and also took notes of task details, answers and comments. Additionally, the sensor data was logged for each single task and repetition to allow subsequent analysis of the feasibility and recognition accuracy of the identification process.
User recognition component Gesture recognition component
Potential user (+ confidence level) Sensors record
Pick up gesture confidence level
Low confidence
Figure 2 – architecture and outputs of the user recognition
component
The procedure was as follows: (a) pre-interview (user’s pre-experience and acquaintance with biometric data input, including perceived benefits and disadvantages); (b) conducting a series of three simple IPTV command and control tasks (finding a channel in the channel list, navigating to several VOD movies, finding weather information for a certain city); (c) questionnaires on usability (standard usability scale SUS by Brooke (11)) and user experience (AttrakDiff from Hassenzahl (12)); (d) multiple repetitions of simple tasks that help evaluate the feasibility of quick identification: picking up and putting down the remote with either hand, passing the remote from one hand to the other, and getting the remote handed over. Each of the repetition tasks included eight repetitions with each hand of the user. All sensor data was logged. The start and end of each repetition for each hand were also marked in the logs to allow a more detailed analysis after the study. The IPTV com-mand and control tasks that were carried out prior to the repetitive tasks were later used to evaluate the feasibility of identifying users during runtime in a post-study analysis.
Subsequently, a Final interview (e), investigated user’s preferences of such identification compared to traditional methods like the usage of a PIN code. Additionally, participants were asked for their ideas how this technology could enhance TV usage or even create new ways of using the TV. Finally, users were asked for their impression of the system regarding privacy concerns in terms of data collection, accuracy, unauthorized usage of personal information, and whether they perceive it as more or less protected by this tech-nology compared to traditional authentication modalities like PIN and password.
RESULTS
Analysis: Gesture Recognition and Framing
We used the pickup records to train a gesture recogni-tion component, in order to determine the best record-ing duration. For that we used the TANAGRA toolkit from Rakotomalala (13), a data mining software that is able to classify and cluster data and that can handle unlabelled data. Recognition was reliable enough (100% recall rate with a false positive rate of 1%) with records of a length of 2 seconds (approximately 20 samples) and an overlap of 50% - meaning that every record overlaps 50% with the previous one, and 50% with the next one.
Machine Learning
In order to recognize the user, we used the machine learning suite Weka of Frank et al (14). The data from
the repetition task was filtered down to the pick-up gesture, where we had eight records for every hand (left and right) for each of the eleven users, resulting in 176 records in total. The average duration of a pickup gesture record was 2.028 seconds, with a standard de-viation of 0.489 seconds. Classification algorithms were scored using the cross-validation method with eight folds (due to the eight repetitions we had).
In this process, scoring was carried out using the full dataset as well as using different subsets of the user data, with data from all users as well as data from a reduced number of users.
Results User Recognition from Sensors
The classifiers retained are the following: the first ones are simple Bayesian networks, with nodes based on Bayes’ rule as described by Pearl (15). Then we used random forests from Breiman (16), which are a combination of simple decision trees refined individually during their training phase. Finally we used random subspaces - Ho (17) - based on trees and forests built on randomly selected subsets of the data.
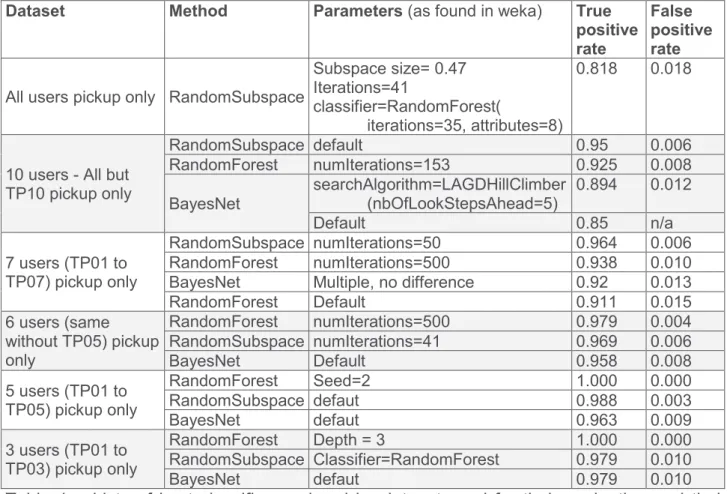
Table 1 – Lists of best classifiers ordered by dataset used for their evaluation and their true positive (TP) rate. Only classifiers and parameters with a TP rate > 80% are shown. The parameters indicated can be set in the Weka GUI. TP# = Test Participant number #
Using the data from the repetitive pickup tasks, a random subspace achieved a true posi-tive (TP) rate of 81.8% for the full set of eleven participants using an eight folds cross-validation method. In the same conditions, Bayesian networks classification algorithms were able to recognize the user with a TP rate of 77.3%. Using only a subset of ten users, having removed one specific user that was frequently recognized as another one, accura-cy went up to 95% at most with a random subspace and 89.4% with a Bayesian network (default parameters).
Dataset Method Parameters (as found in weka) True positive rate
False positive rate All users pickup only RandomSubspace
Subspace size= 0.47 Iterations=41
classifier=RandomForest(
iterations=35, attributes=8)
0.818 0.018
10 users - All but TP10 pickup only RandomSubspace default 0.95 0.006 RandomForest numIterations=153 0.925 0.008 BayesNet searchAlgorithm=LAGDHillClimber (nbOfLookStepsAhead=5) 0.894 0.012 Default 0.85 n/a 7 users (TP01 to TP07) pickup only RandomSubspace numIterations=50 0.964 0.006 RandomForest numIterations=500 0.938 0.010
BayesNet Multiple, no difference 0.92 0.013
RandomForest Default 0.911 0.015 6 users (same without TP05) pickup only RandomForest numIterations=500 0.979 0.004 RandomSubspace numIterations=41 0.969 0.006 BayesNet Default 0.958 0.008 5 users (TP01 to TP05) pickup only RandomForest Seed=2 1.000 0.000 RandomSubspace defaut 0.988 0.003 BayesNet defaut 0.963 0.009 3 users (TP01 to TP03) pickup only RandomForest Depth = 3 1.000 0.000 RandomSubspace Classifier=RandomForest 0.979 0.010 BayesNet defaut 0.979 0.010
Figure 3 – User test with assistant logging tasks
(right) and participant performing a task (centre)
As expected, accuracy decreases with an increase in number of different users, as pickup-gesture characteristics of certain users were not different enough. This indicates that a higher sampling rate than 10Hz can be beneficial to avoid similar profiles and that a higher sampling rate will lead also to a better recognition rate.
Some classifiers performed better than others given the number of users; the highest true positive rate was achieved with a random subspace with all eleven users (highest rate: 81.8%, parameters: subspace size of 0.47; 41 iterations; with a random forest as classifier) and seven users (highest rate: 96.4%; with 50 iterations). Random forests alone gave bet-ter results with six and fewer users, with a true positive (TP) rate ranging from 97.9% to 100% as the number of users goes down. A 100% true positive rate was achieved with five or fewer users. To achieve these scores, the random forest parameters were fine-tuned using a high number of iterations (500) for six users down to the default parameter value (100) for three.
We subsequently also compared the model that we developed from the repetitive pickup task (Task 4) from ten users with eight repetitions per hand as training data to real-usage pickup gestures from tasks 1, 2 and 3 (searching a channel, finding a VOD movie, check-ing weather information). Here, accuracy dropped to 40% (uscheck-ing a random forest), which leads to the conclusion that records gained from a realistic usage might differ from a model trained with repeated pickup gestures; this also unveiled the differences between the real usage by the user when doing everyday command and control tasks, compared with the more artificial training session. This illustrates the need to refine the user’s characteristics after the training phase by registering the previously recorded data every time the user logs in formally into the system. Nevertheless, satisfying accuracy was achieved again in smaller sets of users, reaching 93% TP rate with five users (random forest, with default parameters), and 100% with three users (random subspace, default parameters).
Results Usability, User Experience & qualitative Insights
In terms of usability, the interaction with the line user inter-face for the three command and control tasks in the televi-sion environment was assigned excellent usability by the eleven participants, with a mean rating of 93.4 on the standardized usability scale ranging from 0 – 100 (where a value higher than 68 indicates good usability and a value higher than 80 indicates excellent usability).
The system also received a very good user experience rating by the eleven participants, with above-average rings for hedonic quality, pragmatic quality as well as at-tractiveness metrics (PQ mean = 2.01, SD = 0.54; HQI mean = 1.55, SD = 0.61; HQS mean = 1.62, SD = 0.59; ATT mean = 2.06, SD = 0.67; HQ mean 1.58, SD = 0.57 – all scales ranging from -3 to +3).
Qualitative insights:
The preferred way of logging into an account for the test participants are: password (n=5), pattern (3), PIN (2), Fingerprint (2), and Two-factor-authentication (password + token) (1).
Six of the eleven persons had, in the past, used biometric information for login (voice 1 person, fingerprint 5 persons), four of them use these daily (fingerprint) and two do not use them on a regular basis.
Participants prefer the user authentication via sensor to using a traditional PIN (mean 7.45, SD 1.51 on a scale from 0 – “would absolutely prefer traditional like PIN” to 10 – “would absolutely prefer biometrics and sensors”). Ten of the eleven participants did not have pri-vacy concerns when using the system, only one had concerns that data should only be saved locally and not be “in the cloud”. Participants did not have concerns that their movement and GSR data would be collected and used without their consent.
DISCUSSION AND GUIDELINES
Based on the feasibility study, the combination of 9-axis sensor data and GSR is a rea-sonable good measure when up to five members of a household have to be identified. Fine-tuning the hyper-parameters of the classifiers allowed higher recognition rates for re-duced user sets. Naturally, excluding users with similar movement and GSR data en-hanced the overall recognition rate. This illustrates the need for higher sampling frequency and better sensors (e.g. SFCS (8) or multiple localised GSR sensors (9)). As a guideline for user identification, we recommend the combination of the 9-axis sensor and a high sampling rate like 100Hz with a second modality (e.g. GSR or SFCS).
In terms of learning algorithms for data representing repetitions (like pick-up) and limited time (up to 2.5 seconds), the best results were achieved with random forests, random sub-spaces and Bayesian networks. Given that the methods applied in this study were limited, we are extending our effort to investigate artificial neural networks with back-propagation and several hidden layers as well as time-coded artificial neural networks, as these have been shown to be very stable to slight changes over time (e.g. children's hands are grow-ing and tremor changes over longer time-frames).
Currently the recognition is limited to one single kind of gesture, pickup, with a specific starting point: remote control lying face up on the table. We plan to extend the recognition to all pickup gestures by applying the findings of Lu et al (18) that will support different start and ending positions for gestures. For that, they applied a projection method based on an estimation of gravity to make the data insensitive to the orientation of the object. In addition to that, extending gesture coverage will require more data gathering sessions to be conducted.
Given the high ratings in terms of usability and user experience using a modern user inter-face with a high-end remote control design, the following studies have to confirm these ratings in controlled studies using simple PIN entry for identification in order to allow com-parison with the sensor-based identification approach.
The next step in the development of such a system is the ability of the biometrical identifi-cation to (continuously) register the data on the remote control. Furthermore, a set of tasks is needed that the user must perform in order to gain some initial data for training the algo-rithm. Our current efforts are going in the direction of 'gamifying' the installation and set-up tasks as well as some routine tasks to gather the necessary amount of data.
REFERENCES
1. Bernhaupt, R., Wilfinger, D., & Mirlacher, T. (2010). Personalizing the TV Experience: Vocomedia – A Case Study from Interactive TV. In C. Mourlas, & P. Germanakos (Eds.), Mass Customization for Personalized Communication Environments: Integrating Human Factors (pp. 149-160). IGI Global, Hershey, PA: Information Science Refer-ence. pp. 149
2. Wilfinger, D., Pirker, M., Bernhaupt, R., and Tscheligi, M. 2009. Evaluating and investi-gating an iTV interaction concept in the field. In Proceedings of the Seventh European Conference on European interactive Television Conference (Leuven, Belgium, June 03 - 05, 2009). EuroITV '09. ACM, New York, NY, pp. 175-178.
3. Zewail, R., Elsafi, A., Saeb, M., and Hamdy, N. 2004. Soft and hard biometrics fusion for improved identity verification. The 2004 47th Midwest Symposium on Circuits and Systems MWSCAS '04. vol.1. pp. I-225-8
4. He, Z., Jin, L., Zhen, L., and Huang, J. 2008. Gesture recognition based on 3D accel-erometer for cell phones interaction, APCCAS 2008 - 2008 IEEE Asia Pacific Confer-ence on Circuits and Systems, pp. 217-220
5. Terada, T., Watanabe, R., and Tsukamoto, M. 2013. A User Recognition Method Using Accelerometer for Electric Appliances. 16th International Conference on Network-Based Information Systems. pp. 350-355.
6. Wolf, K., and Willaredt, J. 2015. PickRing: seamless interaction through pick-up detec-tion. In Proceedings of the 6th Augmented Human International Conference (AH '15). ACM, New York, NY, USA, pp. 13-20.
7. Weiss, G. M., & Lockhart, J. W. 2011. Identifying user traits by mining smart phone ac-celerometer data. In Proceedings of the Fifth International Workshop on Knowledge Discovery from Sensor Data. pp. 61-69.
8. Sato, M., Poupyrev, I., and Harrison, C. 2012. Touché: enhancing touch interaction on humans, screens, liquids, and everyday objects. In Proceedings of the SIGCHI Confer-ence on Human Factors in Computing Systems (CHI '12). ACM, New York, NY, USA, pp. 483-492.
9. Sato, M., Puri, R.S., Olwal, A., Chandra, D., Poupyrev, I., and Raskar, R. 2015. Zensei: Augmenting Objects with Effortless User Recognition Capabilities through Bioimped-ance Sensing. In Adjunct Proceedings of the 28th Annual ACM Symposium on User In-terface Software & Technology (UIST '15 Adjunct). ACM, New York, NY, USA, pp. 41-42.
10. Harrison, C., Sato, M., and Poupyrev, I. 2012. Capacitive fingerprinting: exploring user differentiation by sensing electrical properties of the human body. In Proceedings of the 25th annual ACM symposium on User interface software and technology (UIST '12). ACM, New York, NY, USA, pp. 537-544.
11. Brooke, J. (1996). SUS-A quick and dirty usability scale. Usability evaluation in indus-try, 189(194), pp. 4-7.
12. Hassenzahl, M., Burmester, M., & Koller, F. (2003). AttrakDiff: A questionnaire to measure perceived hedonic and pragmatic quality. In Mensch & Computer. pp. 187-196.
13. Rakotomalala, R. 2005. TANAGRA : un logiciel gratuit pour l'enseignement et la re-cherche". In Actes de EGC'2005, RNTI-E-3, vol. 2, pp. 697-702.
14. Frank, E., Hall, M. A. and Witten I. H., 2016. The WEKA Workbench. Online Appendix for "Data Mining: Practical Machine Learning Tools and Techniques", Morgan
Kauf-mann, Fourth Edition, 2016. Last visited May 2017 online at
http://www.cs.waikato.ac.nz/ml/weka/Witten_et_al_2016_appendix.pdf
15. Pearl, J. 1985. Bayesian Networks : a Model of Self-Activated Memory for Evidential Reasoning. In Proceedings of the 7th Conference of the Cognitive Science Society, 329-334
16. Breiman, L. 2001. Random Forests. Machine Learning. 45(1) pp. 5-32.
17. Ho, T.K. 1998. The Random Subspace Method for Constructing Decision Forests. IEEE Transactions on Pattern Analysis and Machine Intelligence. 20(8). pp. 832-844. 18. Lu, H., Huang, J., Saha, T., and Nachman, L. 2014. Unobtrusive gait verification for
mobile phones. In Proceedings of the 2014 ACM International Symposium on Weara-ble Computers (ISWC '14). ACM, New York, NY, USA, pp. 91-98.