Publisher’s version / Version de l'éditeur:
Journal of the Acoustical Society of America, 80, 1, pp. 206-211, 1986-07
READ THESE TERMS AND CONDITIONS CAREFULLY BEFORE USING THIS WEBSITE. https://nrc-publications.canada.ca/eng/copyright
Vous avez des questions? Nous pouvons vous aider. Pour communiquer directement avec un auteur, consultez la première page de la revue dans laquelle son article a été publié afin de trouver ses coordonnées. Si vous n’arrivez pas à les repérer, communiquez avec nous à [email protected].
Questions? Contact the NRC Publications Archive team at
[email protected]. If you wish to email the authors directly, please see the first page of the publication for their contact information.
NRC Publications Archive
Archives des publications du CNRC
This publication could be one of several versions: author’s original, accepted manuscript or the publisher’s version. / La version de cette publication peut être l’une des suivantes : la version prépublication de l’auteur, la version acceptée du manuscrit ou la version de l’éditeur.
Access and use of this website and the material on it are subject to the Terms and Conditions set forth at
Absorption corrections for transmission loss measurements
Warnock, A. C. C.; Halliwell, R. E.
https://publications-cnrc.canada.ca/fra/droits
L’accès à ce site Web et l’utilisation de son contenu sont assujettis aux conditions présentées dans le site LISEZ CES CONDITIONS ATTENTIVEMENT AVANT D’UTILISER CE SITE WEB.
NRC Publications Record / Notice d'Archives des publications de CNRC:
https://nrc-publications.canada.ca/eng/view/object/?id=ae4fa3de-23d3-4021-bf77-ddbcafd71d3b https://publications-cnrc.canada.ca/fra/voir/objet/?id=ae4fa3de-23d3-4021-bf77-ddbcafd71d3bSer
TH1 I
N21d
National Research
Conseil national
no* 1396
Council Canada
de recherches Canada
e . 2
1
BLDG
Institute for
lnstitut de
Research in
recherche en
Construction
construction
Absorption Corrections for
Transmission Loss Measurements
by A.C.C. Warnock and R.E. Halliwell
A N A L Y Z E D
Reprinted from
Journal of the Acoustical Society of America
Vol. 80, No. 1, July 1986
p. 206
-
21 1
(IRC Paper No. 1396)
Price $2.00
NRCC 26201
8 N R C-
CISTIBCDG.
RES.
L I B R A R Y
86.
[ i s - - ?
BIBLIOTHLQUE
Roch.
8btim.
CNRC-
-ST- -
R ~ S U M ~
Des mesures de l a p e r t e de t r a n s m i s s i o n du s o n o n t k t 6 e f f e c t u 6 e s au moyen de neuf m6thodes pour 6 v a l u e r les e f f e t s de l ' a b s o r p t i o n dans une p i s c e . Un k c h a n t i l l o n de m f a 6 t 6 p l a c e dans c i n q p o s i t i o n s d i f f 6 r e n t e s dans l ' o u v e r t u r e e n t r e deux p i s c e s d ' u n l a b o r a t o i r e d ' a c o u s t i q u e . Q u a t r e n i v e a u x d ' a b s o r p t i o n o n t 6 t 6 u t i l i s 6 s . La d t h o d e c l a s s i q u e de d g c r o i s s a n c e s ' e s t r6v616e e f f i c a c e dans t o u s l e s c a s a i n s i qu'une d t h o d e c o n s i s t a n t 2 u t i l i s e r une s o u r c e s o n o r e de p u i s s a n c e connue pour d 6 t e r m i n e r l ' a b s o r p t i o n . Une mkthode f a i s a n t a p p e l au niveau de p r e s s i o n a c o u s t i q u e 2 p r o x i m i t 6 d e l a s o u r c e e t 5 l a moyenne de l a p i b c e (m6thode p r o c h e / b l o i g n & ) n e s'est p a s rgv616e a u s s i e f f i c a c e .
- - - -
msorpcrun currecwons rur tran~mrsslvr~
luss
111easur~lll~11
A. C. C. Warnock and R. E. Halliwell
National Research Council of Canada, Division of Building Research, Ottawa, Canada KIA OR6
e
fi
in i abr me usi WO 6 April 1' Its of sou985; accepted for publication 1 1 March 1986)
nd transmission loss made using nine different methods
:cts of room absorption are reported. A single wall specimen was used in five different positions the opening of a laboratory sound transmission loss test suite. Four different levels of room sorption were used. The conventional decay method is shown to work well in all cases, as does a :thod using a sound source with a known power to estimate the room absorption. A method ng a soun .e level near the source and the room average, the near-far method, did not ~ r k as we1 LCS numbers: 43.55.DtY 43.55.Rg INTRODUCTION eq' SO1 thc lea dec re(
,.-
all( Ta to1 der it of trans ,n,":A,,,The measuremer ,mission losses for a partition in a building1 can be bvualucx~d in two parts: measurement
the noise reduction and a correction for absorption in the :eiving room. The first of these quantities can be measured a straightforward manner with a sound level meter or the uivalent. The preferred method of obtaining the room ab- rption correction is to measure the decay rate of sound in : receiving room,' but in the past this has presented prob- ns in buildings where sound fields are far from diffuse and cay rates can be very rapid. Decay measurements usually pire equipment that is not easy to use in field situations d that in some cases may not even be adequate for the job. pe recorders have been used to carry data back to labora- ies where more powerful instruments can measure rapid --says, or the tape can be replayed at slower speedy3 but this is rather inconvenient. Two steady-state measurement meth- ods have been developed in an attempt to simplify the mea- surement of the room absorption correction: the reference sound source method1 and the near-far m e t h ~ d . ~ From a practical point of view these methods offer considerable ad- vantages because the same instruments used to measure noise reduction can be used to measure the room absorption correction. This paper compares measurements of the room absorption done with variants of each of the methods men- tioned above, and examines the differences among them. Al- though instrumentation that will easily measure rapid de- cays in the field is now available, it is still of considerable interest to look carefully at the different methods of measur- ing the room absorption correction as some of these methods are still permitted in acoustical standards and not everyone has the latest instrumentation.
I. ROOM DESCRIPTION
The description of the rooms used, the measurement equipment, and the partition under test were reported in a previous paper.5 Briefly, a 2.44 X 3.05-m hardboard parti- tion was moved to five different positions in the opening between two reverberation rooms, one a large room with a volume of 250 m3 and the other a small room with a volume of 65 m3. The transmission loss for the panel was measured using different techniques for four different absorptive con-
to estima
.. - te the . .
ditions, AO-A3, in the 65-m3 room. The A0 condition corre- sponded to the room in its normal condition, i.e., reverbera- tion times around 2 s, while the other three conditions had gradually increasing amounts of absorption added until the reverberation times were about 0.2 s. Some representative times were given in Ref. 5. The combination of five wall positions and four absorption conditions provided a total of 20 room configurations in which the different methods of determining the absorption correction could be tested. One of the main purposes of this study was to investigate how well these different methods of measuring room correction would work in fairly small, highly absorptive rooms, typical of those in furnished buildings. Therefore the measurements described in the following were all made using the 65-m3 room as the receiving room for the transmission loss mea- surement. The changes in wall position did not seriously al- ter the receiving room shape but, as will be seen, even these changes were enough to show that some of the methods are not adequate.
,
II.BACKGROUNDTOMEASUREMENTPROCEDURES
In current ~tandards',~ the transmission loss (TL) of a partition is given by the expression
TL = L,
-
L,+
10 log(Sp ) - 10 log A ,,
- (1)where L, =mean sound-pressure level in source room, L, =mean sound-pressure level in receiving room, S, = area of partition under test, and A , = total absorption in receiving room.
In our previous papefl we suggested that Eq. ( 1 ) is in- complete and should be written as
(2) where
V = volume of receiving room,
b = energy decay rate in receiving room,
A , = 4b V/C, ( 3
W, = 10 log( 1
+
S,A /8V),
( 4 ) S, = surface area of receiving room,R = wavelength of sound, c = speed of sound.
Measurement of sound transmission loss using conven- tional techniques comprises what is essentially a measure of the sound power being radiated from the partition under test, and the added term, W,, is the Waterhouse correction, which is required to account for the buildup in sound energy close to the walls of the room and is specified in ANSI S 1.3 1 .6 As in the previous work,5 the A, term is expanded to
make it clear that the important parameter is the rate of energy dissipation in the receiving room, b. If the sound field in the receiving room is diffuse, then according to simple diffuse field theory the decay rate is related to the total ab- sorption in the room by Eq. (3 )
.
When the receiving room is very absorptive and the sound field in it is definitely not diffuse, it is not likely that Eq. (3) is still valid but it does not matter if b is measured directly. One of the main purposes of this study was to investigate this statement and to see how well Eq. (2) accounts for changes in room energy decay rate. Both ASTM E90 and E336 limit the amount of sound-ab- sorbing material that can be in the rooms during a sound transmission loss measurement. The data to be presented here suggest that these restrictions are not necessary al- though they may be preferable in laboratory situations. A. Decay rate measurementsASTM E90 requires that the room correction be deter- mined by measuring the decay rate in the room. As detailed in the previous paper,5 this was done using a computer-based system and doing a least mean squares fit to the first 25 dB of ensemble-averaged decays. Using the earliest possible part of the decay meant that any problems with decay curvature were minimized. Transmission through the wall from the large room, which becomes visible during the later part of the decays, was not significant.
B. Reference power source measurements
Given a source of known sound power level L,, the mean sound-pressure level in a room L , can be related to the room absorption using the relationships given in ANSI S 1.3 1 which can be manipulated to give
10 log A, = L, - L, - W,.
+
6.2.
( 5 The number 6.2 is treated, for convenience, as a constant in the expressions that follow, but it actually depends on atmo- spheric pressure and air temperature. However, both of these quantities were measured during the experiments and corrections were made in accordance with the equations in ANSI S1.3 Equation ( 5 ) omits the nearfield contribu- tions of the source because users of the standard are required to make measurements far enough away from the source that such contributions are negligible.The reference power method of determining the room absorption described in ASTM E336 does not include a Wa- terhouse correction and only states that
10 log A, = L, - L,
+
6.2. ( 6 ) If this expression is substituted in Eq. ( 1 ) then the transmis- sion loss is given byT L = L , - L ,
+
1010g(S,) - (L, -L, + 6 . 2 ) . (7)Substitution of Eq. (5) in Eq. (2) gives ine same result. Th although there is apparently an error in Eq. (6), the exprc sion used in E336, there is a compensating error in Eq. ( I The two W terms are cancelled and the final values for trat.,- mission loss should be correct even though the Waterhouse correction is omitted twice.
Two different calibrated power sources were used: an ILG reference sound source, which is a centrifugal fan, and a Tracoustics model NS- 100 sound source. This latter source is a loudspeaker with associated circuitry designed to meel the requirements of ASTM E597.' It is not sold as a refer- ence sound source but it was included in these investigations to get some idea of the magnitude of the errors that might arise from the use of such a source, even though it is calibrat- ed in a laboratory.
Each of the sources was used in two different configura- tions in the corner of the room adjacent to the partition un- der test, and in three positions beside the partition under test. These source configurations are illustrated in Fig. 1. When three source positions were used the room corrections for each position were added together to give a mean correction for this configuration. Thus four reference power measure- ments of the room absorption were available for each room condition. To calibrate the sources, the sound power of each was measured in accordance with ANSI
S
1.3 1 for configura- tions equivalent to the measurement conditions but with the sources on the other side of the partition in the 250-m3 rever- beration room (Fig. 1 ).C. Near-far method
This method follows a technique for measuring room corrections described in the AMA-1-11 method? which is used to measure the sound transmission between two rooms having a common ceiling and plenum. The near-far method has been suggested for use in other standards and is presently allowed in ASTM E597 which measures noise reductian between rooms using A-weighted sound pressure levels. In the AMA-1-11 near-far method, the sound-pressure level is measured at a reference point close to the source and com- pared to the mean sound level in the room. The procedure is calibrated by making the same room fairly reverberant and measuring decay rates as well as the near-far level differ- ence. The absorption correction is then given by
10 log (A, = 10 log (A,
+
(D, - D,,
( 8 ) where A, = absorption in the receiving room in the test con- dition, A, = absorption in the calibration condition,D, - .n,al-far differ^^,, 111 ~dst condition, and D, = near- far difference in calibration condition.
For general use as a means of estimating the room ab- sorption correction in different rooms, Eq. (8) is not quite correct, again because the Waterhouse effect was not consid- ered. The near-far method assumes that a measurement of the nearfield level L, can be made close enough to the source that the reverberant field is negligible and
where Q = directivity of the source and R = distance of near point from the source. The method then assumes that a far- field measurement Lf can be made in the room such that
which is simply Eq. (5) rearranged with Lf replacing L,
.
The difference L, - Lf is given byIf one assumes that the Q of the source is not significantly affected by the different room conditions, then the first two terms on the right-hand side of this equation are constants and one can write
D, - 10 log A, - W, = D, - 10 log A, - W,
,
( 12) where the subscript c refers to the calibration condition. From this it is easily seen that Eq. ( 8 ) should have been written asWhen this is substituted in Eq. (2) one gets
- ( D , -D,) - IOlogA, - W , . (14)
There were thus nine methods used to determine the sound transmission loss for each wall position and for each absorption condition in the room. These are identified ac- cording to the method used to determine the room correc- tion as follows:
0: The decay method,
1: ILG reference s o u r c m n e position 2: ILG reference source-three positions, 3: Tracoustics reference s o u r c m n e position, 4: Tracoustics reference source-three positions, 5: Near-far method-ILG, one position, 6: Near-far method-ILG, three positions,
7: Near-far method-Tracoustics, one position,
8: Near-far method-Tracoustics, three positions. In all methods the noise reduction was measured in the usual way as the difference between mean room sound-pressure levels. The data sets obtained using method 0 in absorption condition A0 are used in the following as reference condi- tions with which all comparisons are made.
Ill. DISCUSSION OF RESULTS A. Decay rate results-method 0
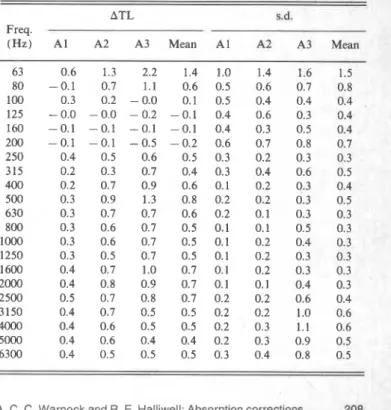
Table I shows ATL, the average differences between the transmission losses measured in the A0 room condition and those measured in the A l , A2, and A3 conditions using the decay rate method. Each entry in the table represents the mean of the differences measured for the five wall positions. This table shows that the decay rate method is only slightly affected by the presence of fairly large amounts of sound absorbing material in the receiving room. The ATL values and the standard deviations in the table are both quite small. One can conclude therefore that measurements of trans- mission loss using method 0 in fairly absorptive receiving rooms in field situations should work just as well as they did Thus if the near-far technique were used to measure the
room absorption, and no account of the Waterhouse correc- tion were taken in the measurement, the transmission loss would be in error by the Waterhouse correction for the cali- bration room.
The two sources and source configurations use'd for the near-far measurements were the same as those used for the reference sound source method. This again gave four slightly different near-far measurements for comparison. The near microphone for the ILG source was equipped with a wind- screen and was placed on the extension of the axis of rotation of the fan so that the microphone was 50 mm from the fan. The near microphone position for the Tracoustics source was directly in front of the speaker cabinet at a distance of 300 mm, the distance normally used in E597 testing with this particular source.
To calibrate the sources for the near-far measurement, they were placed in a reverberant 120-m3 room. It might have been preferable to have calibrated the sources in the 250-m3 room because the W, term would have been smaller, but at the time it was thought more appropriate to calibrate them in a room that was about the same size as normal rooms in buildings. In any case, the difference between the W, cor- rections for the 250-m3 and 120-m3 rooms are rather small.
TABLE I. Mean difference ATL between transmission loss values for dif- ferent room absorption conditions. Standard deviation (s.d.) is about the mean. Reference is A0 TL value.
ATL sad.
Freq.
(Hz) A1 A2 A3 Mean A1 A2 A3 Mean
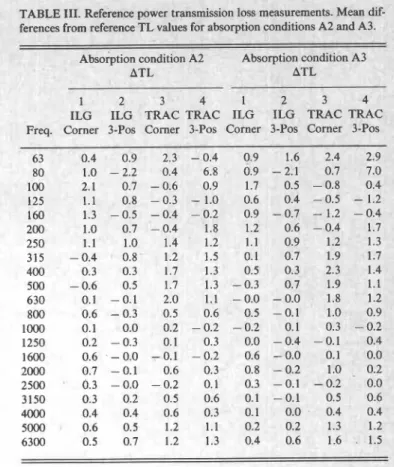
,*n- ? ~ A B L O 111. Keterence power rransmission loss rneasureme~~is. ~ v l e a r l
n reference TL values fi ~n condition
dif- I ~ G L G . ~ 1ball 1alav ~ L U U L L U U ~ that the restrictioil~ 111 LUG 3
dardsIs2 on the amount of sound absc ble in the receiving room are unnece:
or absorptic IS A2 and A xbing ma ssarily str ~t&ial all( ingen t. ~ b s o k t i o n condition P ATL bsorption u A T
B. Reference sound source results--methods 1-4
2 ILG '
" -
.1 2 3 4 1 3 4
Table I1 and I11 give the ATL values for methods 1 4 ,G ILG TRAC TRAC ILG rRAC TR,
where the reference sound sources were used to get the room
-
Frea. Corner 3-POS Corner 3-Pos Corner 3-ros Corner 3-Pcorrections. The mean and the standard deviation are calcu- lated from the five sets of differences from the five wall posi- tions. Examination of these tables shows that using room corrections obtained from the ILG source in the corner con- sistently produces transmission loss values in the four or five low-frequency bands around 160 Hz that are about 1.5 dB too low with respect to the decay rate TL values. Table IV, which gives the mean ATL for all absorptive conditions, sup- ports this conclusion.
Method 2, with the ILG source in three positions against the partition under test, seems to be slightly better than method 1 and the transmission loss values at low fre- quencies are not noticeably reduced with respect to the refer- ence conditions except at 80 Hz where the measurements may not be valid.
In contrast, the data obtained from method 3 with the Tracoustics loudspeaker source in the corner are not notice- ably different from those obtained from method 4 where it is placed against the partition under test. One obvious differ- ence between these two sources is size. The Tracoustics source is several times larger than the ILG source and does not fit into the corner of the room so well. On the other hand, this source was more sensitive to the addition of sound ab- sorbing material in the receiving room, and lower transmis-
sion loss values resulted from its use in room conditions P
A2, and A3. The data for this source exhibited more va ance than those for the ILG.
The Tracoustics source is not sold as a reference sou--' source so it is perhaps not surprising that it did not functi too well in these experiments. It would have been convt
~ 1 ,
ri-
TABLE 11. Reference power transmission loss measurements. Methods 1 4
ATL, mean differences from reference TL values for absorption conditions AO-A 1.
TABLE IV. Reference power transmission loss measurements. Mean dif- ferences from reference TL values for mean of absorption conditions AO,
A l , A2, and A3. Standard deviation (s.d.) is about the mean.
Absorption condition A0 Absorption condition A1
ATL ATL
1 2 , 3 4 1 2 3 4
ILG ILG TRAC TRAC ILG ILG TRAC TRAC Freq. Comer 3-Pos Comer 3-Pos Corner 3-Pos Corner 3-Pos
ATL s.d.
1 2 3 4 1 2 3 4
ILG ILG TRAC TRAC ILG ILG TRAC TRAC Freq. Comer 3-Pos Corner 3-Pos Comer 3-Pos Corner 3-Pos
ient, however, 11 such a stmple source had worked well
:nough for field sound transmission loss measurements.
Table .he near-f
.+-c..,.
...
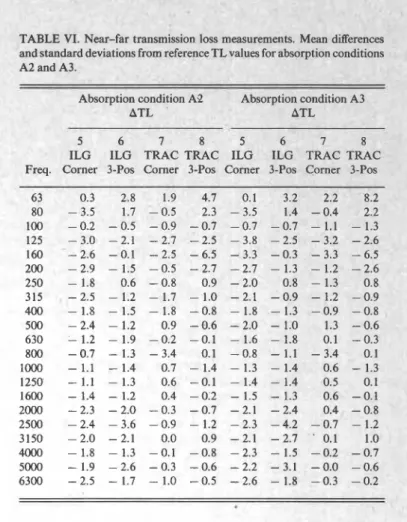
1s V and VI give the ATL values for methods 5-8,
t ar techniques. Again each table contains the mean
01 I I V G wall positions for a single room absorption condition.
The means for all absorption conditions and wall positions are given in Table VII.
Examination of these tables shows that for the ILG ,ource in the corner position there is a systematic ATL of lbout - 2 dB, that is, the measured transmission losses us- ng this method to obtain the room correction would be lbout 2 dB higher than those from the reference decay rate nethod. The three-position arrangement also shows this sys- ematic difference.
Methods 7 and 8, using the Tracoustics source in the lear-far configurations, give much more erratic results than he other meth~ds. No clear trends are visible and the vari- mce for this source tends to be larger than that for the ILG source.
Neither the ILG nor the Tracoustic represents a true point source, and thus there could be some question as to the validity of the near measurement. However, this method is allowed in ASTM E597 and will probably be used by acous- ticians in the field; for this reason it was included in the
tudy.
V. DISCUSSION OF RESULTS
Part of the reason for doing this work was to investigate he variance introduced into the standard methods of mea- TABLE V. Near-far transmission loss measurements. Mean differences and standard deviations from reference TL values for absorption condition A0 and Al.
Absorption condition A0 Absorption condition A1
ATL ATL
5 6 7 8 5 6 7 8
ILG ILG TRAC TRAC ILG ILG TRAC TRAC Freq. Corner 34'0s Corner 3-Pos Corner 3-Pos Comer 3-Pos
om referenc e TL values for absorpti
TABLE VI. Near-far transmission loss measurements, Mean dlfferenu,
and standard deviations fr IS
A2 and A3.
-
Absorption C ~ I I U I L I U I ~ fir A ~ S U I ~ L I U I I ~ ~ ~ ~ d i t i o n A3 ATL ATL - 5 6 7 8 5 6 I 8ILG ILG TRAC TRAC ILG ILG TRAC TRAC Freq. Corner 3-Pos Corner 34'0s Comer 3-Pos Comer 3-Pos
suring transmission loss in field situations by allowing the use of two different methods of correcting for the room ab- sorption. The results show that the near-far techniques used are not good enough to be permitted in standard measure- TABLE VII. Near-far transmission loss measurements. Mean differences and standard deviations from reference TL values for mean of all absorption conditions AO, Al, A2, and A3. Standard deviation (s.d.) is about the mean.
ATL s.d.
5 6 7 8 5 6 7 8
ILG ILG TRAC TRAC ILG ILG TRAC TRAC Freq. Corner 3-Pos Comer 3-Pos Corner 34'0s Corner 3-Pos
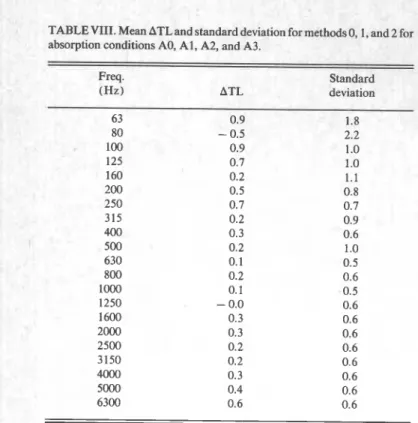
TABLE VIII. Mean ATL and standard deviation for methods O,1, and 2 for absorption conditions AO, Al, A2, and A3.
Freq. (Hz)
Standard
ATL deviation
ments. All of the measurements made using methods 0-2 are, however, valid according to present field standards. Thus to investigate the variance introduced by these two methods, Table VIII shows the standard deviation of the transmission losses about the A0 decay rate measurements. Each wall position provides four absorption conditions for methods 0, 1, and 2. With the method 0-room A0 condition as the reference in each case, one has 1 1 sets of differences for each wall position. Thus 55 sets of differences were used to calculate the standard deviation for each frequency band.
This uncertainty contributed to the transmission loss measurement by the use of the decay rate method is negligi- ble. The spatial variance of the energy decay rate may be quite large on a percentage basis but when the 10 log A , term is calculated, the uncertainty is insignificant relative to the spatial variance of the measured sound pressure levels. When a reference sound source is used to estimate the room absorption correction, two sets of sound-pressure levels are measured in the receiving room and the variance of the levels in each case must be combined with an unavoidable increase in the uncertainty. If the spatial variance of the sound-pres- sure level is approximately the same in both the source and receiving rooms, then the uncertainty in method 1 will be 1.2 times that for method 0. The uncertainty in method 2, where three ILG positions were used, is somewhat less than that for method 1. The exact amount will in general depend on the number of source positions and microphones used.
V. CONCLUSIONS
The data obtained verify that the use of the sound decay rate as a means of removing the effects of room absorption from a measurement of transmission loss is a reliable tech-
nique. This is already the required method in ASTM E90 b-.. is only one of two permissible methods in methods E336 and E1007.' The restrictions on the permitted room absorption in the field measurement standards could be relaxed signifi- cantly at least for the receiving room.
The reference sound source method, the other permissi- ble method in E336 and E1007, shows only small, apparent- ly random differences from the decay rate method with the exception of the low-frequency region discussed above. This is only true for the ILG source. The only suggestion that could be made to improve the field measurement standards would be to require that reference power sources be placed in front of the partition being measured rather than in a corner. The data presented do not support the use of ordinary loudspeakers as reference sources even when they are cali- brated in a reverberation room. It would have been interest- ing to have included a reference sound source made from a loudspeaker as part of this study but one was not available. The systematic differences and the larger scatter in the data for the near-far measurements indicate that this tech- nique should not be introduced as a permissible technique in field measurement standards. The method is currently per- mitted in ASTM E597 but in that case A-weighted sound level measurements are made. The method may work in that case.
ACKNOWLEDGMENT
This paper is a contribution from the Division of Build- ing Research, National Research Council of Canada.
'ASTM E-336-84, "Standard Test Method for Measurement of Airborne Sound Insulation in Buildings" (American Society for Testing and Materi- als, Philadelphia, PA, 1984).
'ASTM E90-83, "Standard Method for Laboratory Measurement of Air- borne Sound Transmission Loss of Building Partitions" (American So- ciety for Testing and Materials, Philadelphia, PA, 1983).
3T. W. Bartel and S. L. Yaniv. "Curvature of Sound Decays in Partially Reverberant Rooms," J. Acoust. Soc. Am. 72, 1838-1 844 ( 1982). 4AMA 1-11-1967, "Method of Test, Standard Specification for Ceiling
Sound Transmission Test by Two Room Method" (Acoustical Board Products Assoc., Park Ridge, IL, 1967).
5R. E. Halliwell and A. C. C. Warnock, "Sound Transmission Loss: Com- parison of Conventional Techniques With Sound Intensity Techniques," J. Acoust. Soc. Am. 77,2094-2103 (1985).
6ANSI S1.3 1-1980, "American National Standard, Precision Methods for the Determination of Sound Levels of Broad-Band Noise Sources in Rever- beration Rooms" (Acoustical Society of America, New York, 1980). 'ASTM E597-81, "Standard Practice for Determining a Single-Number
Rating of Airborne Sound Isolation for Use in Multiunit Building Specifi- cations" (American Society for Testing and Materials, Philadelphia, PA, 1981).
'ASTM E1007-84, "Standard Test Method for Field Measurement of Tap- ing Machine Impact Sound Transmission Through Floor-Ceiling As- semblies and Associated Support Structures" (American Society for Test- ing and Materials, Philadelphia, PA, 1984).
T h i s paper i s being d i s t r i b u t e d i n r e p r i n t form by t h e I n s t i t u t e f o r R e s e a r c h i n C o n s t r u c t i o n . A l i s t of b u i l d i n g p r a c t i c e and r e s e a r c h p u b l i c a t i o n s a v a i l a b l e from t h e I n s t i t u t e may be o b t a i n e d by w r i t i n g t o t h e P u b l i c a t i o n s S e c t i o n , I n s t i t u t e f o r R e s e a r c h i n C o n s t r u c t i o n , N a t i o n a l Research C o u n c i l of C a n a d a , O t t a w a , O n t a r i o ,