Publisher’s version / Version de l'éditeur:
Vous avez des questions? Nous pouvons vous aider. Pour communiquer directement avec un auteur, consultez la première page de la revue dans laquelle son article a été publié afin de trouver ses coordonnées. Si vous n’arrivez pas à les repérer, communiquez avec nous à [email protected].
Questions? Contact the NRC Publications Archive team at
[email protected]. If you wish to email the authors directly, please see the first page of the publication for their contact information.
https://publications-cnrc.canada.ca/fra/droits
L’accès à ce site Web et l’utilisation de son contenu sont assujettis aux conditions présentées dans le site LISEZ CES CONDITIONS ATTENTIVEMENT AVANT D’UTILISER CE SITE WEB.
Internal Report (National Research Council of Canada. Division of Building
Research), 1983-09-01
READ THESE TERMS AND CONDITIONS CAREFULLY BEFORE USING THIS WEBSITE. https://nrc-publications.canada.ca/eng/copyright
NRC Publications Archive Record / Notice des Archives des publications du CNRC :
https://nrc-publications.canada.ca/eng/view/object/?id=b07a4d75-a780-4b08-a860-bf243a9ed549 https://publications-cnrc.canada.ca/fra/voir/objet/?id=b07a4d75-a780-4b08-a860-bf243a9ed549
NRC Publications Archive
Archives des publications du CNRC
For the publisher’s version, please access the DOI link below./ Pour consulter la version de l’éditeur, utilisez le lien DOI ci-dessous.
https://doi.org/10.4224/20386558
Access and use of this website and the material on it are subject to the Terms and Conditions set forth at
Final report on results from test blasts of June 1982 at Daniel Johnson
Dam
NATIONAL RESEARCH COUNCIL OF CANADA DIVISION OF BUILDING RESEARCH
OOR INTERNAL REPORT NO. 477
Final Report on Results from Test Blasts of June 1982 at Daniel Johnson Darn
by J.H. Rainer
ANALYZED
Checked by: Approved by: L. W. Gold olte: September 1983
Prepared for: Administrateur d' Lngen Ler Le , Manic 5 - Puissance
additionnelle, Hydro-Quebec, 855 est, rue Ste-Catherine, Montreal, Quebec H2L 4P5
ABSTRACT
This report deals with the presentation of data and
interpretation of results of a series of test blasts carried out at Manicouagan 5, Quebec in June 1982. This constitutes part of an
investigation into the effects of future excavation blasts at the water intake canal for the Additional Power project. Major topics in the report concern water blast phenomena, response of the dam to water and rock blasts, comparisons between predicted and measured ground motions, and an outline of an approach towards obtaining a blasting criterion that would ensure satisfactory behaviour of the Daniel Johnson Dam.
Table of Contents
Introduction
A. Underwater Pressures from June 1982 Blasts B. Vibration Monitoring in Centre Arch
C. Mode Shapes from Blasting Records D. Strong-Motion Seismograph Records
E. Amplification of Motions Over Height of Dam
F. Scaling of Charges and Prediction of Ground Motions G. An Approach to the Establishment of a Blasting Criterion
for Daniel Johnson Dam
Appendix D1: Strong-Motion Seismograph Results, Blast 20 Appendix D2: Strong-Motion Seismograph Results, Blast 19
Page 3 6 8 9 11 13 19 Dl-l D2-1
INTRODUCTION
The measurements described herein were performed in June and October 1982 as part of an investigation into the effects of future blasting work at the Daniel Johnson Dam on the Manicouagan River, Quebec in connection with the Additional Power project ("Puissance
additionnelle") at Manicouagan 5.
The work described was planned by the staff of Hydro-Quebec under the direction of Mr. Orn 1m, Eng., Mr. S. Valent, Eng. , of
BBL-Valent Inc., and the writer, and in consultation with the Board of Consultants for the Additional Power project.
The purpose of the tests was:
- to measure the blast waves arriving at the dam from explosion sources in and on the shore of the reservoir; to measure the response of the dam to various water blasts and ground transmitted blast waves;
- to verify existing scaling laws for blasting and determine how these might be applied to predict the response of the dam;
- to provide the basis for choosing an acceptable charge weight for the final blast of the channel plug.
Portions of this final report were presented to Hydro-Quebec in October 1982 in the form of a preliminary report. This final report contains the following major changes or additions:
- addition of Fourier spectra for measured water pressures on dam;
- correction of plot of Blast 12 on Fig. A23; - interpretation of time records for water blasts; - addition of vibration results from 900' level to
Section B, including additional time records, spectra, and Table B2;
- elimination of the "tentative mode shapes" from Section C;
- additional interpretation of scaling relationships and delay times for Blasts 18, 19 and 20;
- additional results of modal vibration amplitudes; the results of the modal vibration survey of October 1982 were incorporated into Section G;
2
- editorial changes to improve clarity and correction of some typographical errors.
The chapter headings and labelling were retained essentially unchanged from the Preliminary Report in order to facilitate
comparisons. As will be apparent to the reader throughout the text, this is not a complete study of the various phases of the investigation. This report represents the status of the investigation achievable in the time allotted and with available staff and facilities. Further
investigations into some topics may be carried out later as the specific need arises or for scientific purposes.
The results presented here should also be considered in
conjunction with other parts of the June 1982 tests, namely, the strain measurements in the concrete of the dam and vibration levels from blast monitors stationed throughout the dam, in order to arrive at a more complete picture of dam response. This is outside the scope of the present report.
The units of measurement employed in this report are a mixture of SI and Imperial. This was deemed appropriate since:
- the dam is laid out in Imperial units and galleries are identified by elevation in feet; water depths relative to gallery locations are therefore more meaningful in feet; - some of the blasting relationships employed are available
only in Imperial units; although they could be converted, assessment of parametric effects needs to be carried out in the original version;
- certain distances were laid out in Imperial units, especially the hydrophone spacings.
Conversions are provided whenever it seemed reasonable, with the primary measured quantity given first and the conversion in parentheses. For extensive tables or diagrams, the conversion factors are provided only as notes.
Finally, the writer wishes to express his appreciation to all participants of the investigation for their cooperation and assistance: the staff of Hydro-Quebec, including those from the Montreal office, the field personnel, and IREQ; S. Valent of BBL-Va1ent; L.C. Lang of
L.C. Lang and Assoc. Inc.; the board of consultants,
Messrs. W.L. Chadwick, R.W. Clough, A.J. Hendron, Jr., B. Khi1strOm; Mr. G. Rundquist of Nitro Consult AB, Stockholm; members of the staff of the Noise and Vibration Section who participated in the tests, and
3
A. UNDERWATER PRESSURES FROM JUNE 1982 BLAsTS EXPERIMENTAL PROCEDURE
Four hydrophones manufactured by Kistler Instrument
Corporation of Amherst, NY (model #202A5/623M123), with a maximum range of 400 psi (2756 kPa), were employed. In the spring of 1982, the
instruments were re-calibrated by the manufacturer and were found to have a sensitivity of 53.3 mY/psi (368 kPa).
At the reservoir side of the dam, each hydrophone was mounted on a steel H-section with the sensitive element 2.5 cm (1.0 in.) from the face of the dam. The H-section was lowered into the water by means of two ropes forming a "V" and guided along the sloping face of the arch to the appropriate water depth. The signal cable from each hydrophone was brought to a mobile laboratory parked at the top of the dam and passed through the power supply to a seven-channel "Racal" FM tape recorder. In addition to the four hydrophones, a 100 ms timing pulse generated by magnetic induction from the blasting signal at the end of the blast countdown was recorded; one channel was left empty for noise reduction on playback. Recording speed of 30 in./s provided a frequency cutoff of 10 000 Hz.
For some recordings, (Blasts 4 to 11) a 60 in./s speed was used, but this was abandoned because of excessive tape recorder noise. Playback for the time records occurred at 1/8 the recording speed. With a galvanometer response of 1000 Hz, an effective frequency content of 8000 Hz was thus obtained.
The layout of hydrophones for the various blasts is shown in Figs. Al and A2. Difficulties encountered as the tests progressed
caused the loss of one or two of the channels and required a
redeployment of instruments. Hence, not all positions could be occupied for all tests.
RESULTS
Peak Pressures
The pressure versus time traces are presented in Figs. A3 through A22, and a summary of peak pressure at the wave front is given in Table AI.
The agreement between measured and predicted results is presented in Table A2. Cole (1948) states that:
1/31.13
p(psi) = 21600 (W(lb)
J
R(ft)The comparison between the prediction and the measured peaks is plotted in Fig. A23 as pressure versus reduced distance. All of the pressure variations for any blast lie below the theoretically predicted curve, with slight variations in slope. Since the pressure variation in the
4
shock front is extremely sharp, the fact that the measured peaks are lower than the theoretical prediction could be caused by inadequate frequency response of the recording and analysis equipment.
The reflection coefficient of the pressure pulse at the water/ dam interface can be calculated by dividing the measured pressure by the free-field pressure extrapolated to the location of the dam face on Fig. Al. The results are shown in the last column of Table A2. The reflection coefficients vary between 1.30 and 1.73; for a perfect reflector, this would be 2.0. The calculated reflection coefficient using assumed properties for concrete and water was 1.67 (Rainer, 1982, DBR Internal Report). More refined analysis and different material properties might yield slightly different answers, however.
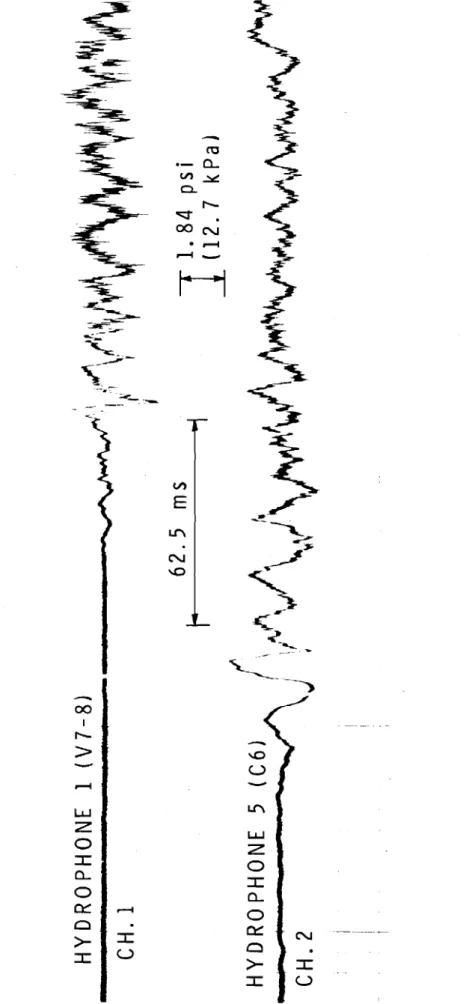
General Properties ·of Time Records
The time records for the suspended charges demonstrate the typical short positive and negative pulses that arise from direct
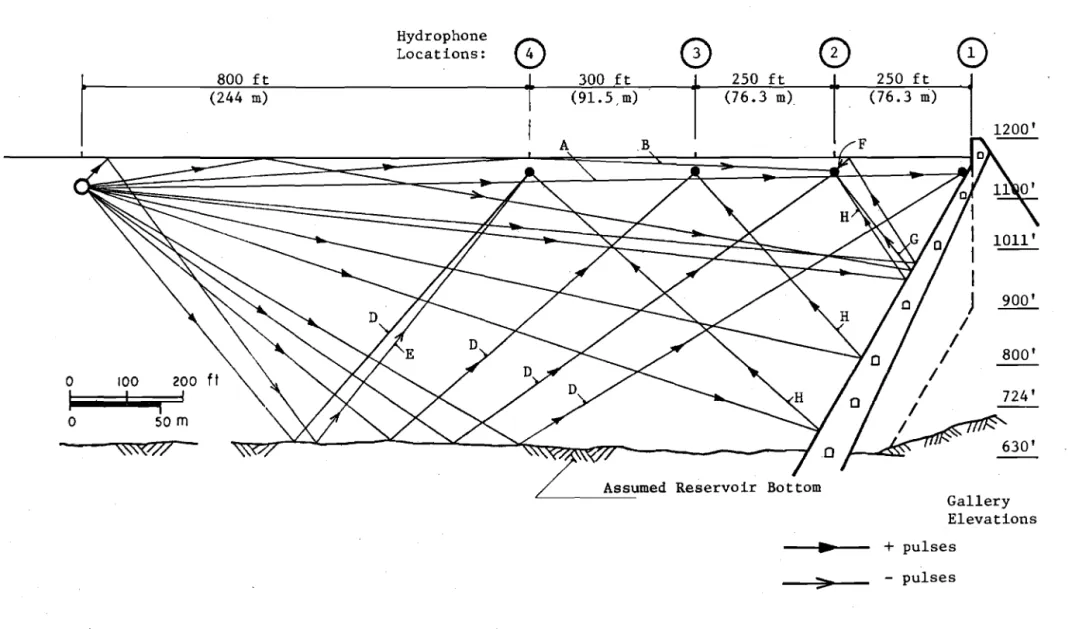
transmission and the reflection off the free water surface. Subsequent pressure variations are due to reflections off the reservoir bottom, the dam surface and the dam interior, and the free water surface. A few of these features have been identified in Fig. A24 for Blast 1, with some selected travel paths shown in Fig. A2S. At least one pulse, identified by "K", is not due to reflections, but rather is source-related since it occurs at a constant time delay from the direct pulse on three
hydrophones, numbers 2, 3 and 4. This secondary pulse could not be identified on the trace of hydrophone 1.
The reflections off the reservoir bottom are of course quite irregular since the topography is rough in detail and far from plain in general. This would explain the somewhat irregular sequence of jagged pulses observed in Fig. A24. The initial arrival of the reflected pulse from the reservoir bottom, identified by "COO, is in surprisingly good agreement with the calculated one based on the simplified assumed topography. The identification of the pulse trains on the trace of hydrophone 1 as coming from refractions of the concrete in arch V6-7 and reflections off the neighbouring arches is somewhat speculative and requires further investigation. Initial indications, however, point to these as plausible explanations.
The pressure variations from the blasts that used an air
curtain show a reduction of the wave front compared to the similar sized blast without the air curtain. The reductions are not always consistent and this could be traced in part to problems with the air delivery to the perforated pipe. As use of the air curtain is not contemplated for the water intake channel blasts, its detailed evaluation will be left for later.
The confined blasts (numbers 18, 19 and 20 on Figs. A20, A2l and A22, respectively) show a marked change in pressure/time variation from the suspended water blasts (numbers 1 through 17). The peak pressure is substantially reduced compared to what a water blast would have produced, and the frequency content is substantially lower. The
5
arrival of the pressure pulse on arch V6-7 is also preceded by pressure ' variations that result from the propagation speed through the ground and the dam being greater than through the water. Behind the main pulse, pressure variations having a wide frequency range are evident.
Fourier Spectra
Fourier spectra were computed for the signals from the
hydrophones that were located against the dam surface for Blasts 1, 12, 18, 19, and 20; these are presented in Figs. A26 to A28.
For the suspended charges (Blasts 1 and 12 in Figs. A26 and A27, respectively) the Fourier peaks are fairly evenly distributed up to the maximum computed 400 Hz, with a slight relative plateau in the
SO - 100 Hz range for Blast 1, and SO - 70 Hz range for Blast 12. The Fourier amplitude for Blast 12 is larger than for Blast 1, as would be expected, since the former was detonated closer to the dam. The SO ft.
(15.3 m) depth in Blast 12 does not result in any recognizable systematic change in the Fourier spectrum as compared to the 30 ft. (9.15 m) depth in Blast 1.
For the rock blasts (numbers 18, 19 and 20, whose spectra of pressure variations are shown in Figs. A28, A2 9 and A30, respectively) a greater proportion of the energy is present in the 10 - SO Hz range. For the hydrophone at C6, 300 ft. (91.5 m) depth, this shift in energy is more pronounced than at V6-7, 70 ft. (21.3 m) depth. Comparison between the single-delay Blast 19 and Blast 20, having 6 charges with 25 ms delays, shows similar peak spectral amplitudes both for V6-7 and C6, but Blast 20 exhibits higher peaks in the 40 - 80 Hz range. This can perhaps be attributed to the multiple delays in Blast 20. However, for Blast 20 a well-defined spectrum peak that might be expected at 40 Hz, corresponding to a delay time of 25 ms, is not present. Concluding Remarks
The interpretation of these results and subsequent application to the probable effects of water pressures on the dam is complicated by the fact that the measured results constitute not only the applied pressures from the blast and resulting reflections, but also pressures induced in the water by the motion of the dam. What proportion is attributable to each is not yet clear, but the assumption that all the measured pressures are applied by the blast should produce a
conservative loading on the dam. REFERENCE
Cole, R.H., Underwater Explosions, Princeton University Press, Princeton, N.J., 1948.
Table A1
Summary of Peak Water Pressures Measured at Wave Front June 1982 Tests
Peak Pressure (psi)
Hydrophone Position (distance from dam)
Blast Brief Description
No. of B1ast* 111 (V6-7)
#2
(250 f t ) #3 (500 f t) 114 (800 f t ) 1 1 lb. at 1600セ , 5.24 4.78 5.70 7.91 H= 30' -3.68 -3.36 -4.05 -6.71 2 1 lb. at 1600' , 5.52 5.04 6.07 8.46 H::I 30' -4.24 -4.42 -5.15 -7.54 3 4 lb. at 1600' , 9.75 8.28 9.94 14.0 H= 30l -7.73 -7.54 -8.72 -12.70 4 4 lb. at 1600' , 11.8 9.20 11.0 15.8 H .. 30' ...7.73 -5.89 -8.83 -13.6 5 4 lb. at 1600' , H=
30', 9.2 11.8 16.2 air curtain at 1577' -6.6 -9.2 -12.5 6 4 lb. at 1600' , 11.4 15.8 H::I 120' -8.1 -11.4 7 4 lb. at 1600' 11.4 15.8 H=
120' -9.6 -12.9 8 1 lb. against rock at location of Sept. 1979 5.89 2.2 test, H=
50' -6.62 -3.1 9 1 lb. against rock at location of Sept. 1979 test, H ::I 50' 5.52 2.58 10 4 lb. at 1600', 13.2 11.8 15.5 H ::I 50' -8.83 -8.65 -12.5 11 as Blast 10, 7.72 5.52 5.2 air curtain at 860' -4.05 -2.58 -3.7 12 1 lb. at 885' , 10.9 16.6 49.8 H=
50' -8.46 -15.6 -30.3 13 1 lb. at 885' , H ::I 50', 2.6 3.5 9.94 air curtain at 860 ft -2.0 -3.7 -1.1 14 4 1b at 1600', H=
50', 6.26 5.15 4.78 air curtain at 860 ft -2.94 -3.31 2.58TABLE Al (cont'd)
Peak Pressure (psi)
Hydrophone Position (water depth) Blast No. 15 16 17 18 19 20 Brief Description C6 V7-8 of Blast* (300 f t , ) (70 ft , ) 3 times 4 lb. at 1600' 7.73 9.20 30 ms delay, -7.91 -3.68 as Blast 15 7.73 9.20 -7.36 -2.76 1 lb. against rock at location of Sept. 1979 1.47 14.7 test -1.47 -2.94 75 lb. in TFI 2.02 2.02 1.29 -4.04 300 lb. in TFI 2.02 1.66 -1.29 -2.02 300 lb. in TF 2,3,4, 5, 2.3 1.66 6, 7 with 25 ms delay -1.66 -2.3 In Reservoir (50 f t , ) 21.0 (?) -10.3 (?)
*
"H" refers to hydrophones at depth below water surface. Weights in lb. are charge weights of TNT.Distances given are from reservoir face of dam at water surface.
(?) somewhat uncertain because of intermittent malfunction of hydrophone 1 psi
=
6.9 kPaTable A2
Calculated and Measured Peak Pressures and Derived Reflection Coefficients for Underwater Blasts
June 1982 Tests, Manic 5
Extrapolated
Peak Pressure Measured
Free Field Derived
Hydro Free-Field Pressure Reflection
Blast W -phone R Calculated Measured R at Dam Coefficient
No. (lb. ) No. (ft. ) (psi) (psi) W1l 3 (psi) at Dam Face
1 1 1 1600 5.17 5.24 1600 4.05 1.30 2 1350 6.25 4.78 1350 3 1100 7.90 5.70 1100 4 800 11.32 7.91 800 2 1 1 1600 5.17 5.52 1600 4.15 1.33 2 1350 6.25 5.04 1350 3 1100 7.90 6.07 1100 4 800 11.30 8.46 800 3 4 1 1600 8.72 9.75 1008 6.5 1.50 2 1350 10.57 8.28 850 3 1100 13.32 9.94 693 4 800 19.08 14.0 504 12 1 1 885 10.10 10.9 885 7.6 1.43 2 585 16.13 585 3 335" 30.28 16.6 335 4 85 142.63 49.8 85 4 4 1 1600 8.72 11.8 1008 6.8 1.73 2 1350 10.57 9.2 850 3 1100 13.32 11.0 693 4 800 19.08 15.8 504 1 1b weight
=
0.453 kg mass 1 ft=
0.305 m 1 psi=
6.9 kPaadditional information, see Fig. A2.
I
I I i I I "o
50 100 150 200 m 600 ft 400\
セ
セ
⦅セG|
200o
Legend:<J()Hydrophone location numbers • Hydrophone locations セセ Suspended charges - Air curtain Future Intake Channel Blast Holes TFl to TF6
,
• Hydrophones, bQセウエウ 1-5, H=30' (9.15 m)
j Hydrophones, Blasts 6,7, H=120' (36.6 m)
, Hydrophones, Blasts 15-20, H=70', 300' (21.3 m, 91.5 m)
• Hydrophones, Blasts 8-14, H=50' (15.3 m)
*Exp1osion for Blasts 1-7, 10, 14-16, H=50' (15.3 m)
セeクーQッウゥッョ for Blasts 12, 13, H=50' (15.3 fu)
I
Air Curtain for Blasts 11, 11, 14*
Hydrophone 1 on face of arch V6-7**
Hydrophone 5 at C6, H=300' (91.5 m)r
800 ft(244 m) セ E1ev. 1156' (352.6 m) 800' 900' 630'0**
0*
Gallery Elevations 250 ft (76.3 m)•
CD
(76.3 m)•
•
CD
(91. 5 m) I 250 fto
A'11 •
-0
... I ' • Hydrophone Locations: H O. 100 200 ffI
!
i Io
50 m Legend:,I"
i !; ::I: ,U·
wi
z
o
::I:a..
o
0::: Q >-::I: ,I
o I I i I·セ
I..
I;
-
セ 0 - a.. v).,::.:: 0. r-..;::t. CON • ....-I . . . . 1 -セw
Z 0 ::I:a..
0 0::: ....-I Q •>-
::I: ::I: U_..--r- --セ ...セ V) E セ
IJ
J..
セ-
l"tJ セ .- a.. セ vIセ c.. oo::;r ex>.
'-OLI'\-...
('t'\ _• N N ('t'\ oo::;r LLJH
w
UJ Z Z Z UJ 0 0 0 Z :J: :J: :J: 0 c, c, c, :J: 0 0 0 c,e::::
...
e::::
Ne::::
0c
c
('t'\e::::
oo::;r Q ,>-
:J:>-
:J:>-
:J: Q :J: U :J: U>-
:J: :J: U :J: U IFig. A4: Pressure-Time Records for Blast 2, 1 lb. (0.454 kg) Charge at 1600 ft. (487.7 m) From Crest of Dam.
I
MM⦅N⦅セ : 0::I:
,
; a..
---1----L _---L . • 1 0 ...-4$t--+
---!-- 0::: . ' Qセ
..•...
セ
t r I . -I I - - -MセMMMMMェ-j
I -_ .._ - - -...,...-6--'. i I rca..
vGIセ 0.. q-00 - - - . - - - . . . . _ _ - - -.0• C'JU"\ MMエCMエM]]]セ]i[[[[セセヲヲゥ]エZャ]ュZエイエエ-
ro . - 0... V').,:w::: c..L
00 \0 . , ('t'\ 0 • I.t\ o::::t I .--4 N...
-
('t'\1----1
LLJ LLJ LLJ W Z Z Z Z 0 0 0 0 ::I:::I: ::I: ::I: - 0...
0... 0... 0...
0
0 0 0
e::::
o::::t
e::::
.--4e::::
Ne::::
('t'\c
C C
C
>->-
::I:>-
::I:>-
::I: ::I:::I: U ::I: U ::I: U
V')
E
I . ,
---.
Fig. A6: Pressure-Time Records for Blast 4, 4 Ibs. (1.82 kg) Charge at 1600 ft (487.7 m) From Crest of Dam.
Mセ ·i.LU ..⦅セNNLz ' 0
:c
c, , 0e::::
!O:c
-+---+- >-U+:c
toa..
v).::.:. c.. q-0 q-0 . 'OLl'\ • N C'f' _ V)E
.----MMMN⦅MセMMiMKM . .エMMGMMエMMMMKセMMKMGr
.. r.. t-
I )-t
t--_·t
·1
-t---I i...
C'f' LU 1.LJ Z Z 0 0:c
:c
c,a..
0 0a::::
Ne::::
0 Q N⦅MセMNNNNNMM⦅N>-
:c
>-:c
u
:c
--_._-.,---....,
Fig. A7: Pressure-Time Records for Blast 5, 4 1bs. (1.82 kg) Charge at 1600 ft (487.7 m) From Crest of Dam,
rr
IJ
itセ
セG
.,-'
I '..
I , Ii +--1-1 , 1 -_.---. ---.,.... l-T-+-V)E
--ii
i - ---+---, -_._+--- -[-I, I - 1 -IIi
:! i ra.- a..
vIセ c. 00...
('t'\O • Lt"\...
-, I : I , , I +, I I
セ
I j -" NセM iIl
LJ.J Zo
セ o,o
e::::
--- 0 >-セ N l.LJ Zo
セ o,o
e::::
+----0 i >-セ I-r--
H
; IFig. A8: Pressure-Time Records for Blast 6, 4 lbs. (1.82 kg)
I,/) E ra .- a.. 1,/).:-:: c-oo \0 • ("1'\0 • Lt"\ r- _
r
I f""'"I LI.J Z 0::::c
a.. 0 0::: Na
>-
::::c
::::c
u
q-LI.J ("1'\ Z ! 0 W::::c
z
a.. 0 0::::c
e::::
q-a..a
::::c
0>-
u
e::::
("1'\::::c
I Q I I>-
::::c
-t1
::::c
u
: IFig. A9: Pressure-Time Records for Blast 7, 4 1bs. (1.82 kg) Charge at 1600 ft (487.7 m) From Crest of Dam.
- -
t---I
I セMMM --1---II
I
-- - -+- - ---IIr---t V) E ...-4 rt"\ W UJ Z Z 0 0 セ セ Q.. Q.. 0 0e::::
"""
e::::
\0 0 C>-
セ>-
セ セ セ U ::I: U U-
to Q.. V) セ C."""
00.
\01./'\ • N rt"\ _H
________--.I..-
セM....
---+---+--:-:
Fig. AlO: Pressure-Time Records for Blast 8, 1 lb. (0.454 kg) Against Rock at Location of September 1979 Test.
: !!
i=f
セセ
セ I セ-I 4
-+
...
..
セ : . , j i セ ,! ,! I Iセ
i I i , I 'J
I!I I fl , I,I
il , I ! ti
Ii I, , 1 ! , II
I , " , I : I I I I i I 1 I I i I , i " I i I I ii : I I, i I ,: i, , il l
, I, , : iIi
iii , i I , i! I:
1r
!II
I I , I , , iIi!
! , :: !'!
I I ,I
I i :..
I I I II Ii i iii,
I III
i i ! :i i , I '-C I.
i::Cセ
U , I I iI I I:iI!
iI
, I , I : I-
! i t'1J !i-
.-
a..
en I I I セ ! 0- , ,i
co
q-.
, !I,!
'-C.
Ll"\ !I I I, N (ot'\-
I , +-I1--1
I 1 I I I I I I11
I;
II i i i I II I I I..
_-
....
_-i
I ! I I _ ... -j----r-I
1-iセ
! I I V)E
ro.- a..
V).::t/!.ッNセh
0 0 .-.oU"\
N I ('t'\ -I...
セt"
('t'\ UJ \.LI Z UJ 0 Zz
.-4---0 0..._+--- --
. I I c, I I '-l-0a..
c, 0 0 Ie::::
Ne::::
e:::: .
セ C ('t'\>-
I C C I U>-
I>-
I I I U I ' UFig. A12: Pressure-Time Records for Blast 10, 4 Ibs. (1.82 kg) Charge at 1600 ft (487.7 m) From Crest of Dam.
- - - ---+---j;::;;;;;;;;;;j en
E
-...
l.LJ Z 0::::c
a -0a:::
C'J 0>-
::r:
::::c
u
:I: U --- - ---r---IFig. A13: Pressure-Time Records for Blast 11, 4 1bs. (1.82 kg) Charge at 1600 ft (487.7 m) From Crest of Dam,
Z
t-i---t- --
I
セ ... __ .+-- . - --.-
r- _. GMGMMセMBBB 1 ___ ..--.-... -I -- -- -- セ - - - -MMMMMMKMMMMMMMセ M セ N ⦅ M ...- N⦅N⦅セ . --i ! - - .- _ . - --, I'- - --- ----+._-
セMN⦅MMMMM ...---
-- -- --t
.
1
.J. , ---
-- .._.__..1
-r -_._- -+
GMGMセM --e--t
.. MMMセ⦅N⦅MMMセQ
-
セ '::!! - - - --t-
- - .. -- r - - セGMMMGB--.
...セ
...
I - セM ---+-- _. _. --: -.
-'--- --- セセ -,=-- I セ I I -セャ
- セ.---t-
MセMMKMMN " -.--. -j---t セ....
I セM . - --.4 .- - -_. .- I-iMエMセ ._,
..
I .-.. - - - - --_.. ---,---+ JMセ
I ! ! I . -- - - --- - ' - I I ! - - --'---::;;;;;0 ..Mセ - ' - " ' - - - 1-. i ' I - - -- I -, j , j - - -- ' - ' - - - ' , i - - ---- - ----'--+-j -_.-- --- r--- - - -- ---_.. ._-I .セ
P-VI E.-J
1.1'\ ----t4
r--- -- ...- ... ,. ....
- t---
; - - - - .-'. N ! '00 - -_.- -- - -- - - --- r---- .-j I I - _.-._- r-- - -1-_
..
- _._.-.- - MMMセ -_.- .--- -- .... セ "I::::t- -
r
--セMセKセ
f----
イセ -- -- -- - r-- - ro - i.-
0.. ro".-
0.. 0MGャBセ
-" VI セ VI セ - - - ----
-....-. 0.. LJ.J 0..1.1'\- - - -セ
LJ.J ..セ ...--.- --, Z 00 "I::::t.
Z 0 .--- - 01----
r---0 '00 LI"\ 0 N ro" j
e::::
-"I::::t - - - - + - - - + - --.---+--j. t-+'
:r:
.
N:r:
.
'00a
0.. - - ro"-
c, 0- セ - --- e-.
-- --_
...:..M-H
H
>-
:r:
0 0:r:
u
e::::
NJ
e::::
ro" ! !セ
, Q.
Q.
セ>-
:r:
i I->-
:r:
i -+-h+ -- ;t
--- :r:
u
--::c:
u
, I _. - - -- --.---_. I I I I --' - --- - _ . _ - - - . --[ I , ! I: , ,Fig. A14: Pressure-Time Records for Blast 12, 1 lb. (0.454 kg) Charge at 885 ft (269.7 m) From Crest of Dam.
-._... -- MMMiMMMMセMMK ________ ._1. - - - 1 1 > - - - -MMMMセセMMMMMMKMMMK⦅⦅セ . . _ + _
--#--_.-.--_.- --
MMMMT]セMMMMMMMMMiM⦅⦅⦅エ⦅
_ +---
- - _.. II
. t V) E---_
..-_
.._._.MMセ -jI..
--to .-.-
-1-1 .. -..-r - . . .. . + I H-セM]エ
___
I N:r:
u
:r:
u
q-
:r:-
u---1·..
·--:1- ••
セ
Fig. A15: Pressure-Time Records for Blast 13t 1 lb. (0.454 kg)
.j
イMMKセMMK
--
MMセMセM----i--
-I---MKセ
I ----t-4/---+--I NMMMMNMMMMZセMMMMMGMMMMMャM __:!_-+_ VI E-
ro c, VI セ Cl. "3" 00.
... セ ("t'\ ;-- . Lf\.
N j l-LJ ("t'\-
u.J l-LJ Zセ
Zz
'-4
0 0 0::c
::c
::c
c, c, c, 0 0 0a:::
Na:::
("t'\a:::
"3"0 0 -- 0
>-
::c
>-
::c
>-::c
u
::c
u
::c
--l
Fig. A16: Pressure-Time Records for Blast 14, 4 1bs. (1.82 kg)
Charge at 1600 ft (487.7 m) From Crest of Dam, Air Curtain at 860 ft (262.1 m)
f
-V)E
H
セ .- a.. V)...::.I:: c. セ 00 • ...oLr\ • N ('t'\ _ 1""""1 L.l.J Z-
00 0 I:c
...
n,>
0-e::::
1""""1 Q>-
:c
:c
u
⦅N⦅MセMMMMMFig. A17: Pressure-Time Records for Blast 15, 3 Times 4 Ibs. (1.82 kg) Charge at 1600 ft (487.7 m) From Crest of Dam, 30 ms Delay.
LJ.J Z
o
:::I:--- :::I:--- :::I:--- :::I:--- :::I:--- :::I:--- :::I:---...
セ]]⦅MMMMMMa..
_"""I([= _-o
c:::
o
.
^Mセᆳ :::I: ..セ LJ.J Zo
:::I: Mセセ- - - - a..
MMM]]セ...
ッセ⦅セc:::
o
>-
セセ⦅NM -- - - :::I: ..::;;;;;jR_--- - - ----..---
セ c, vIセ c. "I:::t 00 • '-"Ll'\ . N("1"\-H
= : :-Fig. A18: Pressure-Time Records for Blast 16, 3 Times 4 1bs. (1.82 kg) Charge at 1600 ft (487.7 m) From Crest of Dam, 30 ms Delay.
セ a セ
l
Nセ1
_....
セ J.
L
-- .-
V)--
..,
_. - ..- セ .. 10... E Lt'\.
N \0-
セ.-
0... vIセ-<
c-ool
\0 ('t"\o セ • Lt'\...
-H
Lt'\j
..
....-Ir
セ LL.J Z Z -0 00I 0 -I \0 I...
a..u
a..>
0 -0-e::::
-
e::::
N 0 --- 0.
.
>-
I>-
I I _ t.> I UC'C
.-
a...
vGャセ 0-I"'-...
-er OON LLI...
LLI Z-
...
-
Z 0 00If--l
0 -I l"'- I \Q o,>
c,u
0-
0 0:::...
0::: N 0 0>-
I>-
I I U:c
Ui
;-セ
セ
セ
V'lセ
I.l'\E N;E.
-.0 セ<;
-y
Fig. A20: Pressure-Time Records for Blast 18. 75 Ibs. (34 kg) in Hole TFl.
---- t
II·
-_f--r··_
セ
- I , -. - --..--- -±---._..
セiM-'
セ
{
セ
セセ
.? Vlセ
セイ
E セセ If\ I NI
i -.0•
roセU
. - CL vャセ 0.. r-セe::::
OON-.
セ セM -00 I r--.0>
U...
If\ l.J.J lLJ lLJ Z Z Z 0 0 0 I I -.0 I c, c, u CL 0 0o·
e::::
セe::::
Ne::::
00 0
>-
I>-
I>-I U I U I
«
セ NNNL[Zセセセ
セ
セ
-セ
セ
co 0 - Q.. V1..:::£{
セ
0..r--er
ooN • ...t ...t_}
H
セ
=--==-セZZZNMM
セ
セMM
セM
MMNセMセ
MMセMNセM V')$
E Lt'\ Mセセ N NNMjセ'"
<.
,-<.
セM
セM
Mセ 00 I -- - --- -r->
...t -W Lt'\ Z L.LJ 0 Z I 0 Q.. I 0 Q..a:::
...t 0 Q a::: M⦅N⦅セMMMセMMMMM>-
I N Q I U>-
I I UFig. A22: Pressure-Time Records for Blast 20, 300 lbs. (136 kg) in Holes TF2, 3, 4, 5, 6, 7 With 25 ms Delays.
100
R (tr .)
WI/3 (lb.)
'T .
-!
r Il:
NMエセエWNセMN
_セ Ii ·
L,le 1
Jt-rr
1i-
i
! Ii !
J
I MセMMl , , i ャMMセ -.
I -i I i ,I
l
r-'-:- --
J'k
'J
-+-- _____... セ jt . . _ j '.J- ,'-; I I -t "1 . - _4-_ セMMMMセMMM KセMセNM I II i . セG ヲセᄋセ セNエMMNMMMLN⦅NM ..-セt
i 1'"---+--=--=-=:...= ..--
t ZMM]Mセ[MM ---.i.Mセ]MM KMセ]Z .. ----; =='--=t-.=.:
=-=:
-- j N⦅MMMMセ--,
. -_.... ---'=t..
..
I ..;.-=-=-
M]セセNL.
セZ..".:
1 ._- ---t- - - MセNM .,. -Br
lセN
5. 0 ms _セ
. Ik·
· 1
,A l ' I - .- - D E' I.
J • ,セN
l-- ._l-- t l--l--::l--
--::-=-.
·1:'
c
- - _. - - - - y - - - r - - - -• .- - - _ . - , . _ _ _ _ _ _ _ ----J-_ ----J-_セ _ _ ---1-- I ----4--- +---:-_ 42 ms -T - - - ...----M ...----M ...----M ...----M セ ...----M A ,, ---4---i
B-L. " u : c 54 ms 62.5 ms B A Spurious 60 Hz Signal 70 msIi
I
I-I , - MMMセ ....-. ,,I
I i ' I i No. 3 , GLセAI-:.
Hydrophone Locat ion __ , No. ,I (v6-7) j-_N:. ;- ,-. . ,
L··-_.
セ セLNNNNセ
__;",,;,
TセセGiNNNエBGゥiセセエエキセBGセセセセa
ゥエjセj[liGセセiォセゥ[セGヲセセQiBャェ
セzwゥ - . _ - £U2 セNNN セ .__ _ _SEE NEXT PAGE FOR LEGEND
Legend for Figs. A24 and A25
A
Direct transmitted + pulseB
Reflected - pulse off water surfaceC
Approximate calculated arrival of reflections off reservoir bottomD
+ Pulse reflected off reservoir bottomE
Pulse セ・ヲャ・」エ・、 off water セオイヲ。」・ and reservoir bottomF
-
Pulse from reflection of + pulse off dam and water surface G - Pulse from reflection off water surface and damH
+ Pulse from reflection off damI Possible reflected pulses off arches V5-6 and V7-8 and free water surface
J Possible refractions from concrete in arch V6-7
K
Source-related secondary pulse at 111 ms after arrival of pulse Ao
100 200I
! , i o 50 m ||GMMセOOWM 800 ft (244 m) Hydrophone セ Locations:\!:..J
300 ft (91.5, m)CD
250 ft (76.3 m)(0
CD
250 ft (76.3 ni) 1200' 900' 800' 724'/ Assumed Reservoir Bottom
--Gallery Elevations
+
pulses - pulsesA SPEC 1 40 .•000
1
IA. 1 EXPANO BLAST 1 hvdセophNャ!
MAGIi
':
セ
.
I
i
j
•
I' .
セQ
I
セi
I
I,セNセ セ NAセ
•
i
,!
cl
Jl
I
0.0 I 0.0 HZ 400.00Fig. A26: Fourier Amplitude Spectrum of Hydrophone Signal at V6-7, 30 ft. deep, Blast 1. BLAST 12 IA. 1 EXPAND
i .
!I
l!
0.0 A SPEC 1 120.00...,....- _ • I!
1
MAG1
,
セ
I
0.0 HZ " 400.00A SPEC 1 60.000 _
.
.
セセ
1I
BLAST 18I
A) Hydrophone at vVセWL Depth = 70 ft. (21.4m MAGV
n
セ
M
セ
セ
V
セ
IVLセセセ
1
セ
セ
*r
0.0 I 0.0 HZ 400.00 CH.1-30 IPS A SPEC 1 100.00•
""AG 0.0 1 BLAST 18 B) Hydrophone at c6, Oepth = 300 ft. (91. 5 m 0.0 HZ 400.00A SPEC 1 200.00
..
MAG 0.0 1 BLAST 19 A) Hydrophone at V6-7 • Depth=
70 ft. (21.4 m) A SPEC 1 250.00..
MAG 0.0 CH.U30 IPS HZ 400.00 1 BLAST 19 B) Hydrophone at C6.!
Depth=
300 ft. (91. 5 m1I
I
II
l 0.0 0.0 CH.! HZ 400.00- - - . . . " . A SPEC 1 'Ai 1 180.00 1ft BLAST 20 A) Hydrophone at V6-7, Depth
=
70 ft. (21.4 m) MAG 0.0 1,
II
I
Iセw
0.0 HZ 400.00 CH.! 1'A.
A SPEC 1 250...
ot-f"''''r'---...;..---. BLAST 20 B) Hydrophone at C6, Depth = 300 ft. (91.5 m) MAGセ
セ
0.0 0.0 HZ 400.00 CH.2Fig. A30: Fourier Amplitude Spectra of Hydrophone Signals from Blast 20.
6
B. VIBRATION MONITORING IN CENTRE ARCH INSTRUMENTATION AND ANALYSIS PROCEDURE
The layout of the transducers is shown in Fig. Bl. Transducer locations are identified by channel numbers 1 - 6 at Station 2,
1168' level, and similarly at Stations 3 and 4 at the 1011' and 700' levels, respectively. The types of accelerometers used are noted beside the station designation.
The acceleration signals were integrated with an analog integrator having a time constant of 5.0 s. The signals were then filtered at 1 or 2 Hz high-pass, and low-pass filtered varying from 1000Hz to 200 Hz or 20 Hz. The resulting velocity signals are displayed in Figs. B2 to Bl3 (1100' level) and Figs. B32 to B38 (900' level). The respective filter ranges are given on the diagrams. The signals for Blast 19, level 900', are presented as displacements, having integrated the recorded velocity once.
Some of the signals showed overloading at the start of the records. As this would have interfered with the integrator, the signal was played backwards; a large transient resulted at the very start of the vibrations, as shown for Channel 6 of Blast 17 (Fig. B7). After discounting this transient, the remainder provides a useful signal of velocity response.
RESULTS
Elevation 1168'
The responses from the セ。エ・イ Blasts 12, 13 and 17 (Figs. B2, B4 and B6, respectively) show at the onset of the vibrations the presence of high frequencies that are attributed to the arrival of the shock wave in the water. Some high frequency vibrations are also present in Blast 20, Fig. B12, but the response there, and that for Blasts 19 and 18, are dominated by the low frequency response of the dam. A summary of peak velocity amplitudes is presented in Table Bl for the transducers located in the 1168' gallery. For the water Blasts 12, 13 and 17, the 20 Hz filtered signals are substantially smaller at C7 than the unfiltered ones, showing the predominance of the high frequency components. For the unfiltered signal (1000 Hz low-pass) for Blasts 12 and 13, Table Bl compares only the peaks in the first 0.1 s. The effect of the air curtain on the high frequencies in Blast 13 is substantial in the first 0.1 s of the response, but thereafter little difference can be seen; the low frequency response is quite similar for the event without the air curtain.
The Fourier amplitude spectra of the velocity responses at the 1168' level for Blasts 18, 19 and 20 are shown in Figs. B14 to B3l for a frequency range of 1 to 50 Hz. The spectra are presented to the same relative scale so that amplitude ratios can be compared.
7
It may be observed that at elevation 1168' in the centre arch V6-7 there are no significant Fourier components above 25 Hz. This is
confirmed by examining the cross-spectra between the channels, which show a complete absence of cross-spectral amplitudes above 25 Hz. Below 25 Hz, there are a multitude of resonance peaks very closely spaced. Of these, a few modes can be identified positively and are presented in Section G. Because of low recording levels the signals, and
consequently the spectra, contain some noise from the tape recorder and the accelerometers, particularly near the 1 to 2 Hz range.
Elevation 1011 '
The 1011' level provided only a few usable results because moisture adversely affected the performance of the accelerometer power supplies.
Elevation 900'
The time records for Blasts 15, 18, 19, and 20 are presented in Figs. B32 to B38 and spectra for Blasts 18, 19 and 20 in Figs. B39 to B52. Some channels are blanked out because of overloading. The results for Blast 19 (Figs. B43 to B46) are for displacement; i.e., the recorded velocity is integrated once. Peak signal amplitudes are presented in Table B2.
The time signals and Table B2 show that peak velocities are generally larger than at the 1168' level (Table Bl) but are
predominantly higher frequencies. Below 20 Hz, the peak signals are smaller than for the comparable channel location at 1168'.
For the multiple water blasts (numbers ,IS and 16), the vibration amplitudes are dominated by the high frequency components. Fig. B32 shows clearly the arrival of the three pulses from the three charges, separated by the 25 ms delay time.
Table B1
Peak Particle Velocities, Station 2, 1168' Level June 1982 Tests
Peak Velocity (mm/s)
Channel 1 Channel 2 Channel 3 Channel 4 ChannelS Channel 6 Blast Filter No. (Hz) C7 V6-7 C6 V5-6 20 2-200 11 8.5 9.9 5.7 8.5 14 2-20 8.5 5.7 7.8 3.5 6.4 9.9 19 2-200 13 7.1 7.9 4.9 9.9 14 2-20 9.9 6.4 7.1 3.5 7.1 9.9 18 2-200 6.3 2.7 3.5 2.7 4.9 5.7 2-20 3.3 2.0 3.1 1.8 3.3 4.9 17 2-1000 1.3 1.2 1.2 1.3 1.6 4.1 2-20 1.2 0.6 0.5 0.4 0.8
-a.s
16 15 13 2-1000* 2.9 1.3 1.6 1.8 0.8 2.8 2-20 1.6 1.6 2.0 1.6 2.3 1.6 12 2-1000* 3.9 2.8 2.9 3.7 2.1 2.9 2-20 1.3 1.6 1.9 1.6 2.2 1.3Peak values for Blasts 12 and 13 in this frequency range are for first 0.1 s only.
Table B2
Peak Velocities and Displacements, Station 4, 900' Level June 1982 Tests
(Values Obtained from Paper Playback)
Peak Velocity (mm/s, except as noted)
Ch. 1 Ch. 2 Ch. 3 Ch. 4 Ch. 5 Ch. 6
en,
10cu.
12 V5-6 724',C6,N-S 724',C6 C6 V6-7 Blast Filter _ No. (Hz) C7 20 2-200 13.5 2-20 2.5 14.8 3.7 11.1 6.2 17 .8 8.6 5.5 1.8 17 .8 9.8 2.6 19 2-200 2-20 0.4 0.4 0.9 0.9 (1.2) (1.2) 0.38 }X10-2 mm 0.38 Ch , 1-6 2.8 18 2-200 2-20 1.4 16 2-2000 11.0 5.5 4.6 10.1 9.4 14.0 15 2-2000 2-20 0.6 5.2 1.2 1.7 9.3 1.2 0.6 1.7 0.2 Values in parentheses are somewhat uncertain.PLAN
---- DRA INAGE AND
SERVICE GALLERIES
ClI
C2 C3,
C4I
C5I
V4-5 C6I
V6-7 C 7 C 8I
V7-8I
C9I
CIOI
CllI
C12I
t - - - - ---I I L - - - LJ_TRANSDUCER STATIONS &ORIENTATION: • Normal to view of darn
ELEVAT
ION
-
•
®
®
Parallel to view of darn Honeywell 101 FM recorder Racal "Store 7" recorder
.£.t,
7
セ
セBセセGCセセセャェセャエwOyヲ
,
Fig. B2: Velocity Records for Blast 12, Station 2 (1168'), Band-Pass Filtered 2 - 1000 Hz.
セ
'-
...
-
.,....,
» taL-IJI..3
セOウ
セ-1
s
セセセセMMMセBBMLMLLLLMMMNNNNMLNNNMN
...
-IV
6-7)
IMiMMMMMMセ
jrn- .,....
セ.
-_.
,.,---
auセィZNlヲ
セBBG
...--....
オセNLMMMM
....
-lllolo"'--.----...---...- ...- ...
ᄋセNwBBGvBGセMMiGセGGGGGᄋGBGᄋGGᄋセGH
I ' I I . I , , i I II..
0./
sセ
iFig. B4: Velocity Records for Blast 13. Station 2 (1168'). Band-Pass Filtered 2 - 1000 Hz.
i
V\,...
BNNNNセaNNBBBGセ ...--f"'.'...- . . . - - •. _ ... \I
iSᄋアセOウ
. ! .
. jI
tCh./
. . .[Niiイエセェ⦅セG(c
r)
1
I
L^セセNi
r
i
fr
I
!
I '
iI
I I I I . • I : iL[NNBLNLLMLイMイBヲGBセセセ
r I i 'i
I : I I !I
,.._セ⦅jセ セ ! I I I Ii
I
i : ! I:
I
. .
セセセ
[ヲnゥエカGセ
!\.1: I i ' \ I, ! : I 'I j I I I t · , ! I , J i 1 i j,jiZcィセ
J
4
ABセ
\
VY',,,,セj
fIJi'l-
I
' ! I,
I
1 1 I : I ' , ! rL'f). i- 1 1 I I i Ln
1r
セ i . 'i ;
I' \MセゥBセBQセ|ヲャG
, ' I ' iII : '
, I " I'IChl3'l:
;' I
セMMBjセセ
Fig. B6: Velocity Records for Blast 17, Station 2 (1168 '), Band-Pass Filtered 1 - 1000 Hz.
; ,
C/'. "
\ Ith.1.
;
,
., '
GセW」Wェセセ
I " i I . I : "___
MLIBLセゥ
:1
,
',"V"",'--.
LセL
:
I " ' , ' I I I I ' , I ' " i ' ' ' ! I ...
I·'·... •••• J;:C- , ,-....,:., セGNLNN •. ....,|セ s ; GQセ LセNGNG ioVIIIMiIA A:· .'1"1t ','ZGセ NNMNセャZ[[NNNNN NNNQヲLGセセNG セセ .." ._ .セMGN ht' -'. I l' .J .. '., ". " Lゥセ .. ". .'f'.. t .••• "'I " , ' -,..•.
" ,. I .. ;',"1:'.NJ
'·,
" . ,",
-....
_.
I--f--_..-"
...,.
セ エゥMMjセ- - :-1 __
1 - - - ヲMMエMGMMエMMKLNNNMMLセKMMェNM - - . _ - . -MMMエMMMセMエMM - ---Ch5
- - r ' '-'_. - - - - . - . - . - --1--- -. _...l...-_ •. - _.- - - t-r- ._-----
"-
,---- - - - ' - - - ' - - - ' _ . " ...,....
-- --- -, f , - - -- -_. - - ..-- --- ----
. _ . . . - . - ' - - - ' . . . '- --..' _. --- --- ---f
--'.-.
_ _--
....
II!""...
...
セ -, _I ''':-r'' セ"'.,
, •r-''.
, .i:-, J -- .NNLNNMセ -- ..-- MGMBセ - - ---I-- I I +-G
Ai セGM iZ N セ セ セ セ セセ セ ᆬセ セ N セNセセセセ
セ
I"... '., セ ...セ セ-...
-,
Fig. B8: Velocity Records for Blast 18, Station 2 (1168'), Band-Pass Filtered 2 - 200 Hz.
•
I
I . I I -I - t· -1I
I セ...
NNNNNNNNMNセ...--,.,
Ir
_ _セセMKMMMMイャMMイMi ⦅ セ ⦅ jNMZMセN⦅ZNᄋエᄋ[_.:
OJ.
. ICh.1.
(C7)
-.
Ch.2
セi..
,-""Ch.3
(Vt-7)
-Ch.Lf
Ch·S
i.o
s
,... +- 4,..
p -wFig. BlO: Velocity Records for Blast 19, Station 2 (1168 I), Band-Pass Filtered 2 - 200 Hz.
Ch.1
(C7)
-is
Ch.3
(V6-7)
l/¥
mmls
ゥセィNGi
---I I-I
----i- -- ---
---
M]⦅セ]ャセMMMM]セ
セ⦅Mtᄋ
.
t---(V?&)
ZZGィNセ
----.,,.;;;---""'"""'ttI'U
(C6)
I I • I ' , I , , I
Ch.z
...,...., iittidiCh.3
-(vG-iJ
Lo s
a.
tl-re .. .-.---0 ...
」OGNセ
...kca(eb)
Fig. B12: Velocity Records for Blast 20, Station 2 (1168 '), Band-Pass Filtered 2 - 200 Hz.
is
{hi'
a,»
⦅セLaHvLMセ
Ch2
I , .,El<PAIiO 1 m 0.0 !'lAG A SPEC 1 200.00 -.- --, 0.0 HZ 50.000
Fig. B14: Fourier Spectrum, Blast 18, Station 2, Channell.
A SPEC 2 1
200.00
m
0.0
0.0 HZ 50.000
EXPAHO 1 0.0 MAG, A SPEC 2 250.00
--r--.---...
HI 0.0 HZ 50.000Fig. B16: Fourier Spectrum, Blast 18, Station 2, Channel 3.
EXPAHD 1 A SPEC 2 200.00 - - - . . . , IIlI MAG )
セ
h 0.0 0.0 HZ 50.000. . . . .
-.
EXPAND 1 HI /'lAG 0.0 A SPEC 2 200.00-r..---,
0.0 HZ 50.000Fig. B18: Fourier Spectrum, Blast 18, Station 2, Channel 5.
EXPAND 1 A SPEC 2 200. 00MイMセMMMMMMMMMMMMMMMMMMMMMMMMMMMMMN HI MAG 0.0 0.0 HZ 50.000
EXPAND Vil. 0000 • ' A l l . A SPEC 1 40.000 ...- - - ,
•
CH. 1 0.0 1.1 HZ 50.000Fig. B20: Fourier Spectrum. Blast 19. Station 2. Channell.
1 II SPEC 1 500.00 - - - . , III CH.2 "AG 0.0 0.0 lIZ 5e ••••
EXPAND 1 'A, A SPEC 2 500.00- r - - - , III CH.3 MAG 0.0 0.0 HZ 50.000
Fig. B22: Fourier Spectrum, Blast 19, Station 2, Channel 3.
EXPAND 1
'A.
A SPEC 2 !IJO. 00 MMMMMMMMMMMMMMMMMセMMMMMMMMMMMML III MAG 0.0 0.0 HZ 50.000EXP"HD 1 A SPEC 2 500.90
..
-r---...,
CM.S MAG 0.0 0.0 HZ 50.000Fig. B24: Fourier Spectrum, Blast 19, Station 2, Channel 5.
A SPEC 2
,A.
1350.00
•
CH.60.0
EXPAHO 1 A SPEC 1 500.00 _ . _ - - - . . , III CH.1 MAG 0.0 0.0 HZ 50.000
Fig. B26: Fourier Spectrum, Blast 20, Station 2, Channell.
EXPAHO 1 IA. A SHC 2 500.00 _ - - - . . . , III CH.2 MAG 0.0 0.0 HZ 50.000
EXPA!'!O 1 'A: A SPEC 2 500. CO
..
-r---..,
CH.3 /'lAG 0.0 HZ 50.000Fig. B28: Fourier Spectrum, Blast 20. Station 2. Channel 3.
EXPAND 1 A SPEC 2 500.00
_r---,
II CH.4 /'lAG 0.0 0.0 HZ 50.0001
EXPAND 1 A SPEC 2 500.00_ r - - - ,
HI CH.5 MAG 0.0 0.0 HZ 50.000Fig. B30: Fourier Spectrum, Blast 20, Station 2, ChannelS.
V: -321.6911 A SPEC 2 'AI 1 600.00 CH.6 II MAG 0.0 0.0 HZ 50.000
-- -
MセMMMMMMj
--- --- --
-L-- -
---MBGセセaMヲBGGGGGGBGG
''''''''.".
I
ChI
if-セセセセセ
I I セセ _セ__-:L.-セセZGセ
GZBセ\Gゥセ
w-
セャセ
..
-セ -セ
.
セGᆬQujiiャNwGiャiNョLェ
0./
s
IS,8
rnm/s
Ch.2
Fig. B32: Velocity Records for Blast 15, Station 4 (900'), Band-Pass Filtered 2 - 2000 Hz.
I I I I I I I I I I I I I I I
I
I,
I,
I I r T セイr:J
I? Iセセセ
A
セ
.
IJ
i
•
...
t....
..
セ-"
...
....
I "セ
....
--
..
r"""-
-Iセ [Nセ
I
Iit;
·13
セ
ILJ,.,J'l
セ
..-r...
.;. 0.:----. セ--:. . ' 1"1'·'.
,., ,. i..
r ' - .--
-
セ fV
h
セiャ
セ -- t-J -
セMj
-- --
__
, --- --f-/'2
0
s
Ii
Nセ
r . .. e-' セM - - - - -l- f--- --- -- - -iMセMf--Ie
if
''lセ
セ
セ
1M
セ
セ
セL..
....
セ
.
.,
I......
セ...
•
..
.--
-
...""
-- _.- - f - - - --_. - r----t--- M M M セ セ M M セ --t-- --- - - .. . -- - - ---.. - - - f-- f--f--f-----c
セN I:::> - r-セ
- -- - - I - t- セM --- イGセ ._--...
,...
セN
-
- r - - ..セ「ッ b-' - -エMセ⦅NM -. Mセ IA -\" 1""..- . • ... - ''''''''セ iMMMセ(
セP-l
._- セ - - - ' - - - - - t- --f - .-t---. - -- f---f- t-- f - - - - t--- - -1--- -- - 1---.- --- _. . .- ---I--セM -- --I---- - - - - .. -- r---- f - - 1--I- f--- --I-- - Mセ セ... I---- セNM 1--- -- -- _. - - - - -f---- I-- - - f - t- -- I - -- f--- 1-- 1--- I---- 1-. --.. j - -t-- -f-. l- I- セM f -- _. j - - -エMMMMセ セ ... -セ セ --- I--I-- Nセ 1 - -セM -- - -_.- - .. 1--- - ---t--- セ M 1--- - I----,
mm-セNセ
⦅[エMMセャM]QセセZ
-
y_+
-8
-+---+
.t-:i=
_.
.j-+-
_ t
-_L IFig. B33: Velocity Records for Blast 18, Station 4 (900'), Band-Pass Filtered 2 - 200 Hz.
セjセセ
,BBセセNjiiiiキiiGヲャAャャャャャャャャZ
セ
! ' IFig. B34: Velocity Records for Blast 18, Station 4 (900'), Band-Pass Filtered 2 - 20 Hz.
I
」NセN
I
6"
7
J -I」NZセN
2
lセNォ
vセMWI
_. I - . _ . - - t - - - ._---+--+--t--Ir--t-,-+--+--+-+--1--1-- .- ...- --セMMKMMMMKMKM ---. - r - f - - - f--- - MセヲMM . -r
--- - - . -- .-- - - ---- ---- f----.- 1- .-- c.--.--. .. -- -- セMエM - ---- - I - .I - -セM - t--I----1---- -f- I - -- +-. -- ._- - - t---+-Fig. B35: Displacement Records for Blast 19, Station 4 (900'), Band-Pass
"1
,i
I I
I I ir;.1
i I I : 1(V6-V
! I --- --- -, ! ! i i I Ii
t I I ! t ! ! I II
I i I I I ! I 1--.Fig. B36: Displacement Records for Blast 19, Station 4 (900'), Band-Pass Filtered 2 - 20 hコセ
++ ----'-11
t
f-1 I I i ! I ,-t-1.0
.s:
CI,./f
Ch.5
- ---.,.--- t-I I , I 'I ' i i i 'I セ--;- --t----'--+
I - i - - \-- -; IFig. B37: Velocity Records for Blast 20, Station 4 (900'), Band-Pass
-t
I , L '-- j -" '.1
- .. _-_ _-_ 0 . 0 セBi
'--. - -, - >-
-f
...セ-- --,--
1'1
1 ' .GᄋZZGMMGセZ[ᄋWセZp]NZZZZNGセMNNLNセセMMセᄋエ
セZM
I- --, --- - - --セ
• -セセ
""'7I--:--o-C:-'. - - - - ' ,,
-I" !-:;;,.-- ..i.. セ - "-T-+--+--+"-, .. セi"'Yl
I f f'\1
I
I
f-MMセ
セ
-(c
«
IJ-II
rr
I
i
:
Iセェ
I
tOrsI
I
セN ヲMセ
セt/:
MMijセM
hf-1,'
Lセ
1I !i il
!, I !, ;, I i l ) 1 II !エ
M ⦅ ᄋ⦅ M セ M
I'-
a.1z'l
Bjセ
!
I ....:
セ|
セ
..;
セ
..:...1
j _セL
-r"",v·..-,'"
,
セMNケャ :-!
II : •!
I 'I
i, 'Ii i i
1
1HvセMWI
1,
BLjlセ
a⦅セェ
)..','
jNNN{Lセ
⦅セ
_
0
J2_
Lセ
.-'VV\J"
,wセヲ y\';7fI セャ""!
fllI" - ! - :- -! . : ; : : ! I :,,
;CJ,.f
(C7)
I
i
!
j
I I i,
i ; --I"'"I
!i
I I I ; セ,
:Fig. B38: Velocity Records for Blast 20, Station 4 (900'), Band-Pass
A SPEC ! 70.000
..
MAG 0.0 0.0 JJ HZ 'AI 1 50.000Fig. B39: Fourier Spectrum, Blast 18, Station 4 (900'), Channel 2.
A SPEC 2 100.00
..
MAG 0.0 0.0 J" HZ ,A, 1 50.000A SPEC 2 100.00
•
HAG 0.0 0.0 J6 HZ 1 50.000Fig. B4l: Fourier Spectrum, Blast 18, Station 4 (900'), Channel 4.
A SPEC 2 38 VIJ6.968 • -AI 1 ElCPAHD 35.000
•
HAG 0.0 0.0 HZ 50.000A SPEC 1 200.00
•
MAG 0.0 0.0 Y,249.87 • 1 HZ EllPAHO 50.000Fig. B43: Fourier Spectrum of Displacement, Blast 19, Station 4 (900'), Channell. A SPEC 2 2S
,,,,
1 450.00•
MAG 0.0 0.0 HZ 50.000Fig. B44: Fourier Spectrum of Displacement, Blast 19, Station 4 (900'), Channel 2.
A SPEC 2 400.00
•
MAG 0.0 0.0 28 HZ 1 50.000Fig. B45: Fourier Spectrum of Displacement, Blast 19, Station 4 (900'), Channel 3. A SPECl 180.00
•
MAG 0.0 0.0 31 HZ 1 50.000A SPEC 1 120.00
•
0.0 0.0II,.
1 V1134.04 • 1 HZ EXPAHD 50.000Fig. B47: Fourier Spectrum, Blast 20, Station 4 (900'), Channell.
A SPEC 2 200.00
•
MAG 0.0 0.0 2 V.242.32 • 1 HZ EXPAND 50.000A SPEC 2 200.00
•
MAG 0.0 0.0 5 V,242.J2 • 1 HZ ElCPAHD 50.000Fig. B49: Fourier Spectrum, Blast 20, Station 4 (900'), Channel 3.
V,242.J2 • A SPEC 2 200.00
•
MAG 0.0 0.0 1 HZ ElCPAHD 50.000V.105.12 • A SPEC 2 100.00
..
0.0 0.0 11 HZ.A.
1 EXPAND 50.000Fig. B5l: Fourier Spectrum, Blast 20, Station 4 (900'), Channel 5.
V.249.87 • A SPEC 2 200.00
•
MAG 0.0 0.0 HZ.A.
1 EXPAND 50.0008
C. MODE SHAPES FROM BLASTING RECORDS
The determination of the mode shapes for the main arch (V6-7) proved to be a difficult undertaking. The task was complicated by the low level of signals in the low frequency range; this gave rise to interference by the tape recorder noise and the noise from the
transducers. As far as instrumentation is concerned. the recording of the high frequency blast waves was basically incompatible with the determination of the lower modes of vibration. There were also an insufficient number of transducer stations for ready identification of some of the higher modes. Because of the low signal levels. it was not initially possible to obtain a better separation of the resonance peaks, as this requires a longer signal. for which noise then becomes even more dominant.
An attempt to isolate modes from the blasting records resulted in some tentative shapes, but they are not considered sufficiently
reliable for presentation here. It may be possible to substantiate some of these 'candidates' once more detailed mode shapes have been
determined by other methods.
It became evident from these results that a separate measurement program was needed whose sole objective would be the
determination of mode shapes. In this manner the necessary compromises in type and deployment of instruments can be kept to a minimum and better results anticipated. Towards this objective, an ambient
vibration survey was undertaken in October 1982; the results for this are presented within Section G.