HAL Id: hal-02971700
https://hal-univ-tlse3.archives-ouvertes.fr/hal-02971700
Submitted on 21 Oct 2020
HAL is a multi-disciplinary open access
archive for the deposit and dissemination of
sci-entific research documents, whether they are
pub-lished or not. The documents may come from
teaching and research institutions in France or
abroad, or from public or private research centers.
L’archive ouverte pluridisciplinaire HAL, est
destinée au dépôt et à la diffusion de documents
scientifiques de niveau recherche, publiés ou non,
émanant des établissements d’enseignement et de
recherche français ou étrangers, des laboratoires
publics ou privés.
Human impacts on minimum subsets of species critical
for maintaining ecosystem structure
Forest Isbell, Michel Loreau
To cite this version:
Forest Isbell, Michel Loreau.
Human impacts on minimum subsets of species critical for
main-taining ecosystem structure.
Basic and Applied Ecology, Elsevier, 2013, 14 (8), pp.623-629.
�10.1016/j.baae.2013.09.001�. �hal-02971700�
Human impacts on minimum subsets of species critical for maintaining
ecosystem structure
Forest Isbell
a,∗, Michel Loreau
baDepartment of Ecology, Evolution and Behavior, University of Minnesota, Saint Paul, MN 55108, USA
bCentre for Biodiversity Theory and Modelling, Station d’Ecologie Expérimentale du CNRS, 09200 Moulis, France
Received 7 January 2013; accepted 2 September 2013 Available online 13 September 2013
Abstract
Humans have indirectly influenced species at lower trophic levels by driving losses of apex consumers. Furthermore, humans have indirectly influenced species at higher trophic levels by driving losses of primary producers. Beyond these broad classes of apex consumers and primary producers, it remains challenging to identify minimum subsets of species that are particularly important for maintaining ecosystem structure and functioning. Here we use a novel method at the intersection of control theory and network theory to identify a minimum set of driver node species upon which ecosystem structure strongly depends. Specifically, humans could unintentionally completely restructure ecosystems (i.e., change species abundances from any initial values to any final values, including zero) by altering the abundances of these few critical driver node species. We then quantify the proportion of these driver nodes that are influenced by humans, top predators, and primary producers in several marine food webs. We find that humans could unintentionally completely restructure marine food webs while only directly influencing less than one in four species. Additionally, humans directly influence: (1) most or all of the species necessary to completely restructure each network, (2) more driver nodes than top predators, and at least as many driver nodes as primary producers, and (3) an increasing proportion of driver nodes over time in the Adriatic Sea. We conclude that humans have potentially huge impacts on marine ecosystems while directly influencing only the relatively small subset of species that are currently fished. It may be possible to reduce unintentional and undesirable cascading human influences by decreasing human impacts on driver node species in these and other food webs.
Zusammenfassung
Der Mensch hat Arten auf unteren trophischen Ebenen indirekt beeinflusst, indem er Verluste bei Spitzenkonsumenten verursachte. Der Mensch hat aber auch Arten auf höheren trophischen Ebenen indirekt beeinflusst, indem er Verluste bei Primärproduzenten bewirkt hat. Jenseits dieser groben Gruppierungen von Spitzenkonsumenten und Primärproduzenten stellt sich die Aufgabe, die kleinsten Untergruppen von Arten zu identifizieren, die besonders wichtig für den Erhalt von Struktur und Funktion von Ökosystemen sind. Hier nutzen wir eine neuartige Methode an der Schnittstelle von Kontrolltheorie und Netzwerktheorie, um eine Minimalgruppe von Steuerknotenarten zu identifizieren, von denen die Ökosystemstruktur beson-ders stark abhängt. Insbesondere der Mensch könnte unbeabsichtigt Ökosysteme vollständig umgestalten (d.h. die Abundanzen der Arten von beliebigen Ausgangswerten hin zu beliebigen Endwerten, einschließlich null, verändern), indem er die Abun-danzen dieser wenigen entscheidenden Steuerknotenarten verändert. Wir bestimmen dann den Anteil dieser Steuerknoten, die in verschiedenen marinen Nahrungsnetzen vom Menschen, von Gipfelräubern oder Primärproduzenten beeinflusst werden. Wir
∗Corresponding author. Tel.: +1 515 291 1812; fax: +1 612 624 6777.
E-mail address:[email protected](F. Isbell).
1439-1791/$ – see front matter © 2013 Gesellschaft für Ökologie. Published by Elsevier GmbH. All rights reserved. http://dx.doi.org/10.1016/j.baae.2013.09.001
624 F. Isbell, M. Loreau / Basic and Applied Ecology 14 (2013) 623–629
finden, dass der Mensch marine Nahrungsnetze unbeabsichtigt vollständig umgestalten könnte, obwohl er direkt nur weniger als jede vierte Art beeinflusst. Darüber hinaus beeinflusst der Mensch (1) die meisten oder alle Arten, die erforderlich sind, um das Netzwerk vollständig umzugestalten, (2) mehr Steuerknoten als die Top-Prädatoren und mindestens so viele Steuerknoten wie die Primärproduzenten, sowie (3) einen im Laufe der letzten 100000 Jahre zunehmenden Anteil von Steuerknoten im Adriatischen Meer. Wir schließen, dass der Mensch potentiell einen gewaltigen Einfluss auf marine Ökosysteme ausübt, während er direkt nur auf die relativ kleine Gruppe von Arten einwirkt, die gegenwärtig befischt werden. Möglicherweise ließen sich die unbeabsichtigten und nicht wünschenswerten kaskadierenden menschlichen Einflüsse reduzieren, indem der menschliche Einfluss auf die Steuerknotenarten in diesen und anderen Nahrungsnetzen reduziert wird.
© 2013 Gesellschaft für Ökologie. Published by Elsevier GmbH. All rights reserved.
Keywords: Food web; Marine; Control theory; Network theory; Fishing; Conservation
Introduction
Humans are influencing natural systems on a global scale (Kareiva, Watts, McDonald, & Boucher 2007; Rockström et al. 2009; Vitousek, Mooney, Lubchenco, & Melillo 1997). For example, species are rapidly going extinct (Barnosky et al. 2011), partly due to over-exploitation of apex con-sumers (Butchart et al. 2010; Estes et al. 2011). Furthermore, human nitrogen fixation results in widespread N deposition and aquatic dead zones (Vitousek, Aber et al. 1997), and anthropogenic CO2 emissions are on pace to drive global warming 2◦C above pre-industrial levels (Peters et al. 2013). It remains difficult, however, to predict the cascading effects of such global environmental changes on ecosystem struc-ture (Sala et al. 2000) and ecosystem functioning (Worm et al. 2006). Toward this end, recent studies have identified species (or functional response traits) that are most sensi-tive to such global environmental changes, and species (or functional effect traits) upon which ecosystem structure and functioning most strongly depend (Isbell et al. 2011; Kirwan et al. 2009; Mori, Furukawa, & Sasaki 2013). Here we use a novel method at the intersection of control theory and net-work theory to identify subsets of species in marine food webs upon which ecosystem structure strongly depends, and then determine how many of these species are directly influenced by humans.
There is considerable evidence that ecosystem structure and functioning can strongly depend on certain broad groups of species, such as apex consumers and primary produc-ers. Numerous experimental and theoretical modeling studies have found that disrupting top–down (or bottom–up) control of ecosystems can have strong cascading effects to species at lower (or higher) trophic levels (Estes et al. 2011; Gruner et al. 2008; Hillebrand et al. 2007). For example, removing apex consumers can shift communities to an alternative stable state of low biodiversity (Schmitz 2004). Additionally, decreasing the number of plant species can decrease the abundance and diversity of herbivores and carnivores (Scherber et al. 2010). In addition to determining the sensitivity of various ecosys-tems to disruption of top–down or bottom–up control (Estes et al. 2011; Gruner et al. 2008; Hillebrand et al. 2007), it may also be useful to identify a particular subset of apex consumers, primary producers, or other species upon which
ecosystem structure and functioning most strongly depend. For example, the extent to which human influences on apex consumers will cascade to lower trophic levels can depend on the degree distribution of trophic interactions in the food web (Liu, Slotine, & Barabasi 2011). Control theory and network theory can help identify subsets of species that are critical for maintaining ecosystem structure. Counter-intuitively, these do not tend to be the most highly connected species (Liu et al. 2011).
Consider the following linear dynamics of a controlled network (Liu et al. 2011):
dx(t)
dt = Ax(t) + Bu(t), (1)
where the vector x(t) describes the state of a system of S nodes at time t. The matrix A, which is S× S, includes elements aij that indicate the link weight between nodes i and j. The
input matrix B, which is S× M, identifies the nodes controlled by the controller. The system is controlled using the time-dependent input vector u(t), which consists of M unique input signals, and which is imposed by the controller.
Specifically, here we consider humans as an external con-troller of marine food webs. Let xi(t) be the biomass of species i at time t, and aij be the interspecific interaction coefficient
describing the net effect of species j on species i, relative to the net effect of species i on itself, as defined by the sensitivity of species i’s population growth rate to a change in species j’s population density. Let the matrix B indicate which species humans directly influence and the vector u(t) indicate the time-dependent direct influences of humans on other species. The system in Eq. (1) is fully controllable if each node can be individually controlled (Liu et al. 2011). Control, in this case, is defined as the ability to take a system from any initial state to any final state in the state space (including boundaries where one or more species are extinct). For exam-ple, humans could fully control food webs by controlling the abundances of all species. It is, however, rarely possible or useful to control all nodes individually. Thus, part of control theory involves identifying a minimum set of driver nodes that could be used to guide the system from some initial state to some other final state (Liu et al. 2011). Although it is unlikely that humans could strategically use driver node species to fully control marine food webs in practice
Table 1. Network properties.
S HI ND HD.T HD.B
Atlantic Kelp Forest 5 4 2 2 2 Pacific Kelp Forest 8 6 3 2 3 Coral reef 14 11 5 4 3 Estuary 19 10 6 5 0 Adriatic Sea 38 33 10 10 5 Atlantic Shelf 80 28 17 9 2
S = number of nodes (species) in network; HI= number of human influences;
ND= number of driver nodes; HD= number of driver nodes influenced by
humans in top–down (T) or bottom–up (B) controlled version of network.
(i.e., desirably altering the abundances of all species), it is possible that humans are unintentionally completely restruc-turing food webs (i.e., altering the abundances of all species) by directly influencing this small subset of species upon which ecosystem structure strongly depends. To explore this possibility, here we: (1) identify a minimum set of driver node species upon which ecosystem structure strongly depends in each of 6 marine networks, (2) test whether humans directly influence more driver nodes than other top predators or pri-mary producers, and (3) test whether the proportion of driver nodes directly influenced by humans has increased over time. Our objective is not to determine how to control these food webs in practice, but rather to identify subsets of species upon which ecosystem structure strongly depends, and to deter-mine how many of these species are influenced by human fishing.
Materials and methods
We consider 6 previously published marine food webs that included humans (Coll, Lotze, & Romanuk 2008; Jackson et al. 2001; Link 2002; Lotze, Coll, & Dunne 2011). These networks range in diversity from 5 to 80 taxonomic groups (Table 1;Fig. 1), which are either functional feeding groups of trophically similar species (e.g., kelp) or single species (e.g., sea otters). Henceforth, we refer to these taxonomic groups as ‘species’ for brevity. These networks represent simplifications of trophic interactions in kelp forests, coral reefs, estuaries, a continental shelf, and the Adriatic Sea. Each of these networks was composed from a binary “who-eats-whom” matrix. See previous studies for structural properties and further network details (Coll et al. 2008; Jackson et al. 2001; Link 2002; Lotze et al. 2011).
First, we used a novel method (Liu et al. 2011) at the inter-section of control theory and network theory to identify a minimum set of driver nodes that could be used to fully con-trol each network. This method can be used for any directed network (Liu et al. 2011). We considered both top–down (i.e., a directed network with recipient control) and bottom–up (i.e., a directed network with donor control) control for each network because both are commonly important in marine
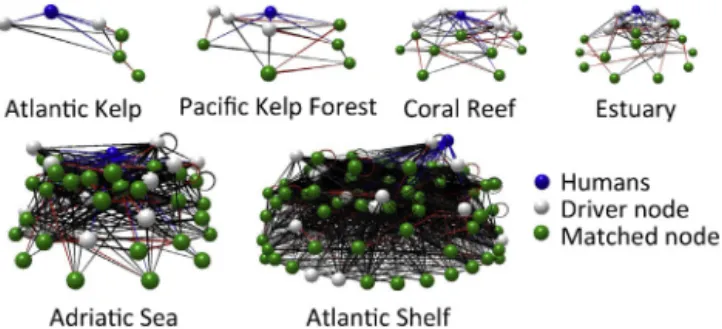
Fig. 1. Humans (blue spheres) could completely restructure each
of these food webs by directly influencing only a subset of the species (driver nodes: white spheres) because the abundances of other species (matched nodes: green spheres) would be indirectly impacted. Blue lines indicate direct human influences; red and black lines respectively indicate matching and non-matching links. Top–down controlled versions of networks are shown. Images were produced with Network3D (Williams 2010). (For interpretation of the references to color in this text, the reader is referred to the web version of the article.)
ecosystems (Gruner et al. 2008). To identify a minimum set of driver nodes, we recast digraphs in their bipartite repre-sentation (Fig. 2), and then identified a maximum-matching edge set (Liu et al. 2011). This was done using the Find-IndependentEdgeSet function of Mathematica 8.0 (Wolfram Research, Inc.). An edge subset is a matching one if no two edges in the subset share a common starting vertex or end-ing vertex. In other words, each node can have at most one matching link entering it, and at most one matching link leav-ing it. A vertex is matched if it is an endleav-ing vertex of an edge in the matching, and unmatched otherwise. In other words, if a node has a matching link entering it, then it is a matched node. The unmatched vertices are the driver nodes because all of these must be directly controlled to control the entire network (Liu et al. 2011). The matched nodes can be indi-rectly controlled by diindi-rectly controlling all unmatched nodes. A maximum-matching edge set is one in which the number of driver nodes is minimized.
Although parameter uncertainty and nonlinear dynamics could make it difficult to fully control food webs in practice (Loehle 2006; Runge & Johnson 2002), they do not prevent us from identifying a subset of species that could be used to completely restructure each food web, and determining how many of these species humans directly influence. The approach we use does not require knowledge of the magni-tudes of time-dependent human influences on all species (i.e., values in the u(t) vector), nor of the magnitudes of species influences on one another (i.e., values in the A matrix), which are often unknown (Liu et al. 2011). The number and iden-tity of driver nodes simply depend on the binary structure of the A matrix. Decreasing the strengths of species interactions without completely eliminating the interaction could change the rate at which the system moves through state space, or require different magnitudes of time-dependent human influ-ences, but would not prevent controllability. That is, it would
626 F. Isbell, M. Loreau / Basic and Applied Ecology 14 (2013) 623–629
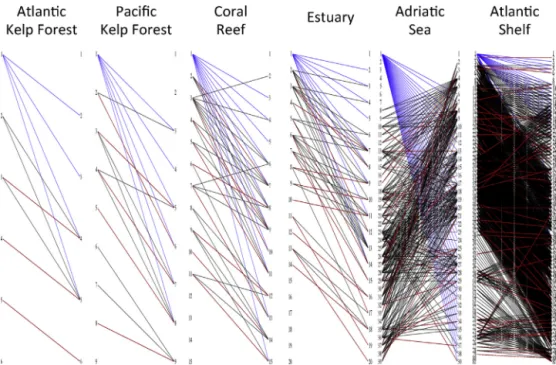
Fig. 2. Bipartite representations of digraphs. Each node is shown as the same number on both the left and right sides. Lines connect a consumer
(left) with its resource (right). Humans are node 1 in all panels. One of the possible maximum matchings is shown (i.e., maximum number of red lines when each node has at most one red line on each side). If we assume top–down (bottom–up) control, then all nodes on the right (left) without a red line are driver nodes, except for humans. Link colors matchFig. 1: human influences (blue), matching links (red), and non-matching links (black). (An electronic version of this figure with explanations of colors and nodes is included in Appendix A.)
remain possible to move the system between any two points in state space in finite time. The approach provides suffi-cient conditions for many nonlinear systems and is robust to nearly all parameter combinations (Liu et al. 2011), making it useful for identifying driver nodes even when empirical and logistical constraints will undermine attempts to fully control networks. Additionally, this method requires consid-erably less data than previous approaches for identifying sets of species that influence ecosystem functioning (Isbell et al. 2011; Kirwan et al. 2009).
Second, we tested whether humans directly influenced more driver nodes than other top predators or primary produc-ers. To do this, we identified the set of driver nodes in the food web that excluded only humans for both the top–down and bottom–up versions of each network (Fig. 2), and then quan-tified the proportion of these driver nodes that were directly influenced by humans (i.e., by fishing) according to the pre-viously published structures of each of these food webs (Coll et al. 2008; Jackson et al. 2001; Link 2002; Lotze et al. 2011). Similarly, for each of the other top predators (i.e., all species that were not eaten by another species), we removed the top predator (and humans) from the network, identified a set of driver nodes, and then quantified the proportion of these driver nodes that were directly influenced by the top predator (i.e., the species eaten by this predator). Similarly, for each of the primary producers (i.e., all species that do not eat other species), we removed the primary producer (and humans) from the network, identified a set of driver nodes, and then quantified the proportion of these driver nodes that were directly influenced by the primary producer (i.e., the
species that consumed this producer). Results were similar if we included humans in the network when we excluded top predators or primary producers. To test whether humans directly influenced a greater proportion of driver nodes than top predators or primary producers, we used the glm func-tion in R 2.15.1 to fit a quasibinomial generalized linear model (glm). Specifically, we fit the proportion of driver nodes directly influenced as a function of a species group factor that had two levels: human and predator (or human and primary producer when considering bottom–up control). Sample sizes were as follows: N = 6 for humans (one value for each food web); N = 12 for predators (one value for each apex predator in each food web); and N = 20 for producers (one value for each primary producer in each food web). The quasi-maximum-likelihood version of the binomial general-ized linear model accounts for over- or under-dispersion in the data.
Third, we tested whether the proportion of driver nodes directly influenced by humans has increased over time. One of these marine networks (i.e., Adriatic Sea) was constructed for 10 historical periods ranging from prehuman to recent times, allowing consideration of temporal trends in human influences (Lotze et al. 2011). We used the methods described above to quantify the proportion of driver nodes directly influ-enced by humans for each of the 10 time periods. To test whether this proportion increased over time, we fit a quasibi-nomial glm, assuming either top–down or bottom–up control. Specifically, we fit the proportion of driver nodes directly influenced by humans in the Adriatic Sea as a function of the time period.
Results
Humans directly influenced the majority of the species in all but one network (Table 1). For all of these networks, humans directly influenced more species than the mini-mum number needed to completely restructure the network (Table 1). Furthermore, humans directly influenced the par-ticular subset of species upon which ecosystem structure strongly depends in the top–down controlled versions of the Atlantic Kelp Forest and Adriatic Sea networks (Table 1;
Fig. 2). In other cases, humans directly influenced some, but not all of the driver nodes (Table 1). For example, humans could not completely restructure the top–down controlled version of the Pacific Kelp Forest network without addition-ally directly influencing killer whales (Node 2 in Pacific Kelp Forest panel ofFig. 2).
Humans directly influenced more driver nodes than other top predators when we assumed top–down control (Fig. 3A). Specifically, the average proportion of driver nodes directly influenced by humans was approximately four times greater than that directly influenced by other top preda-tors (F1,16= 43.52, P < 0.001) (Fig. 3A). In contrast, humans did not directly influence more driver nodes than primary producers when we assumed bottom–up control (Fig. 3B). Specifically, the average proportion of driver nodes directly influenced by humans was approximately two times greater than that directly influenced by primary producers; however, this difference was not significant (F1,24= 1.89, P = 0.182) (Fig. 3A).
The proportion of driver nodes directly influenced by humans has increased over time in the Adriatic Sea, regard-less of whether we assume top–down control (F1,7= 23.17, P = 0.002) or bottom–up control (F1,7= 10.56, P = 0.014) (Fig. 3C). Humans have directly influenced many of the driver species since arriving in this area as hunter-gatherers, and at least 90% of the species necessary for completely restruc-turing the top–down controlled version of this food web for approximately 1500 years (Fig. 3C). Humans directly influenced all of the species necessary for completely restruc-turing the top–down controlled version of the Adriatic Sea food web as early as Medieval times (Fig. 3C).
The minimum number of driver nodes for completely restructuring the network increased with the number of species in the network (Pearson’s r = 0.994, t = 17.610, P < 0.001) such that approximately 23% of the nodes in each network were driver nodes (Table 1). Interest-ingly, the proportion of driver nodes that humans directly influenced did not significantly change with the num-ber of species in the network, regardless of whether we assume top–down control (Pearson’s r =−0.545, t = −1.300, P = 0.264) or bottom–up control (Pearson’s r =−0.532, t =−1.257, P = 0.277) (Table 1). This suggests that the ways in which these food webs have been simplified, including omitting or consolidating taxa, have not led to systematic increases or decreases in the proportion of species that are driver nodes. Changing the complexity of these food webs
could, however, change the proportion of species that are driver nodes, particularly if it altered the network’s degree distribution (Liu et al. 2011).
Discussion
Our results suggest that humans could unintentionally completely restructure marine food webs while only directly influencing less than one in four species. Although previous studies have found that humans have many direct and indirect effects (Menge 1995), to our knowledge no previous study has determined whether humans directly influence enough species to potentially completely restructure ecosystems (i.e., change species abundances from any initial values to any final values, including zero). In all of the marine food webs that we considered, humans directly influenced more species than the minimum number needed to completely restructure the network. In some cases, humans directly influenced all of the particular species necessary to completely restructure the entire marine food web. Thus, humans could uninten-tionally completely restructure these food webs, including driving some species extinct, simply by fishing this subset of species.
Our results are consistent with previous findings that humans have reduced 98% of traditional marine resources to less than 50% of their former abundances and extir-pated 11% of the studied species in the Adriatic Sea (Lotze et al. 2011). By decreasing marine biodiversity, humans have decreased the ocean’s capacity to provide food, main-tain water quality, and recover from perturbations (Worm et al. 2006). Decreasing human influences on driver node species might reduce some of these unintentional and unde-sirable effects. We found that humans directly influenced approximately 80% of the species in these marine food webs, yet they only needed to directly influence approxi-mately 23% of the species to completely restructure each of these networks (Table 1). One way to decrease the extent to which humans unintentionally restructure marine food webs is to decrease the proportion of species that humans directly influence (e.g., decreasing the number of by-catch species). Doing this in a manner that does not result in over-exploitation of the few species that remain directly influenced by humans will be challenging, especially given increasing food demands (Tilman, Balzer, Hill, & Befort 2011) and uncertainties in ecosystem dynamics (Loehle 2006; Runge & Johnson 2002).
There are several limitations of our approach that could be addressed by future studies. First, although the set of driver nodes that we identified will generally allow complete restructuring of the network under nearly all combinations of link weights, there may be some pathological combi-nations of interaction coefficients that would undermine the controllability of these networks (Liu et al. 2011). Although it is unlikely that the actual interaction coefficients happen to be these pathological parameter combinations,
628 F. Isbell, M. Loreau / Basic and Applied Ecology 14 (2013) 623–629 Humans Predators 0 20 40 60 80 100
Driver nodes influenced (%)
Top-down control (A) Humans Producers 0 20 40 60 80 100 Bottom-up control (B) 2 4 6 8 10 0 20 40 60 80 100 Time period
(C) Top-down controlBottom-up control Prehuman
Fig. 3. Humans directly influenced (A) more driver nodes than top predators, (B) at least as many driver nodes as primary producers, and
(C) an increasing percentage of driver nodes over time in the Adriatic Sea. Error bars in (A and B) indicate 95% confidence intervals. Time periods in (C): (1) prehuman, before∼100,000 BC; (2) hunter–gatherer, 100,000–6000 BC; (3) agricultural, 6000–900 BC; (4) local market, 900–500 BC; (5) classical, 500 BC-600 AD; (6) medieval, 600–1500 AD; (7) early modern, 1500–1800 AD; (8) late modern, 1800–1900 AD; (9) early global, 1900–1950; (10) late global, 1950–2000 AD (Lotze et al. 2011).
further study would be necessary to rule out this possibil-ity. Second, other minimum sets of driver nodes may also allow complete restructuring of the network. Although, we identified a maximum matching, there are often multiple maximum matching configurations in complex networks. New methods are needed to identify all possible minimum sets of driver nodes. Third, there is considerable uncertainty regarding both the structure of marine food webs and the nonlinear population dynamics of marine species. Further empirical study could help reduce these uncertainties, and further modeling investigations could consider the extent to which controllability is robust to the incorporation of such nonlinearities. Although these limitations could affect the proportion of driver nodes influenced by humans, they would not confound our comparisons between humans and other species, nor our consideration of the temporal trend in human influences.
We suspect our results generally offer conservative esti-mates for the proportion of species that are indirectly influenced by humans for several reasons. Note that we did not consider abiotic resources, but there is considerable evi-dence that humans increase nutrient inputs in these and other ecosystems (Galloway et al. 2008; Vitousek, Aber et al. 1997). Including these influences in models such as those considered here would likely increase the bottom–up effects of humans. Additionally, other human influences (e.g., cli-mate change) are ignored in the trophic webs considered here, but would also likely increase the indirect effects of humans on the species in these and other ecosystems. Fur-thermore, reciprocal interactions may be more common than strictly top–down or bottom–up control in many ecosystems (Gruner et al. 2008; Power 1992). Although we considered top–down and bottom–up control independently, considering
them together would likely lead to even more indirect path-ways of human influences.
Ecological applications of control theory require careful consideration. Although humans often intentionally influ-ence engineered systems to guide them toward a desirable final state, humans have had numerous intentional and unin-tentional influences on natural systems that have guided these systems toward both desirable and undesirable states (Kareiva et al. 2007). We suspect that control theory will be most useful for determining: (1) the extent to which humans could restructure ecosystems, and (2) ways to reduce uninten-tional and undesirable human impacts on ecosystems (e.g., avoiding by-catch of species that are driver nodes). It will likely be more difficult to use control theory to determine ways to increase desirable human impacts on ecosystems (e.g., strategically influencing some driver node species to restore biodiversity and ecosystem services). Full control of natural food webs will likely be restricted by the combina-tion of nonlinear dynamics, parameter uncertainty, stochastic environmental fluctuations, observation error, and barriers to policy implementation (Loehle 2006; Runge & Johnson 2002).
We are optimistic that further investigation at the intersec-tion of control theory and network theory will help identify general patterns and rules that will increase our ability to understand, predict, and manage ecosystems. Here we used a previously developed method to identify minimum sub-sets of species that are critically important for maintaining marine ecosystem structure, and considered how many of these species were directly influenced by human fishing. Future studies could similarly consider other anthropogenic effects on driver node species in these and other food webs.
Acknowledgement
We thank anonymous reviewers for insightful suggestions. ML was supported by the TULIP Laboratory of Excellence (ANR-10-LABX-41).
Appendix A. Supplementary data
Supplementary data associated with this article can be found, in the online version, athttp://dx.doi.org/10.1016/j. baae.2013.09.001.
References
Barnosky, A. D., Matzke, N., Tomiya, S., Wogan, G. O. U., Swartz, B., Quental, T. B., et al. (2011). Has the earth’s sixth mass extinction already arrived? Nature, 471, 51–57.
Butchart, S. H. M., Walpole, M., Collen, B., van Strien, A., Scharlemann, J. P. W., Almond, R. E. A., et al. (2010). Global biodiversity: Indicators of recent declines. Science, 328, 1164–1168.
Coll, M., Lotze, H. K., & Romanuk, T. N. (2008). Structural degradation in mediterranean sea food webs: Testing ecolog-ical hypotheses using stochastic and mass-balance modelling. Ecosystems, 11, 939–960.
Estes, J. A., Terborgh, J., Brashares, J. S., Power, M. E., Berger, J., Bond, W. J., et al. (2011). Trophic downgrading of planet earth. Science, 333, 301–306.
Galloway, J. N., Townsend, A. R., Erisman, J. W., Bekunda, M., Cai, Z., Freney, J. R., et al. (2008). Transformation of the nitrogen cycle: Recent trends, questions, and potential solutions. Science, 320, 889–892.
Gruner, D. S., Smith, J. E., Seabloom, E. W., Sandin, S. A., Ngai, J. T., Hillebrand, H., et al. (2008). A cross-system synthesis of consumer and nutrient resource control on producer biomass. Ecology Letters, 11, 740–755.
Hillebrand, H., Gruner, D. S., Borer, E. T., Bracken, M. E. S., Cle-land, E. E., Elser, J. J., et al. (2007). Consumer versus resource control of producer diversity depends on ecosystem type and producer community structure. Proceedings of the National Academy of Sciences of the United States of America, 104, 10904–10909.
Isbell, F., Calcagno, V., Hector, A., Connolly, J., Harpole, W. S., Reich, P. B., et al. (2011). High plant diversity is needed to maintain ecosystem services. Nature, 477, 199-U196
Jackson, J. B. C., Kirby, M. X., Berger, W. H., Bjorndal, K. A., Botsford, L. W., Bourque, B. J., et al. (2001). Historical over-fishing and the recent collapse of coastal ecosystems. Science, 293, 629–638.
Kareiva, P., Watts, S., McDonald, R., & Boucher, T. (2007). Domes-ticated nature: Shaping landscapes and ecosystems for human welfare. Science, 316, 1866–1869.
Kirwan, L., Connolly, J., Finn, J. A., Brophy, C., Luscher, A., Nyfeler, D., et al. (2009). Diversity-interaction modeling: Estimating contributions of species identities and interactions to ecosystem function. Ecology, 90, 2032–2038.
Link, J. (2002). Does food web theory work for marine ecosystems? Marine Ecology Progress Series, 230, 1–9.
Liu, Y. Y., Slotine, J. J., & Barabasi, A. L. (2011). Controllability of complex networks. Nature, 473, 167–173.
Loehle, C. (2006). Control theory and the management of ecosys-tems. Journal of Applied Ecology, 43, 957–966.
Lotze, H. K., Coll, M., & Dunne, J. A. (2011). Historical changes in marine resources, food-web structure and ecosystem functioning in the adriatic sea, mediterranean. Ecosystems, 14, 198–222. Menge, B. A. (1995). Indirect effects in marine rocky intertidal
inter-action webs: Patterns and importance. Ecological Monographs, 65, 21–74.
Mori, A. S., Furukawa, T., & Sasaki, T. (2013). Response diver-sity determines the resilience of ecosystems to environmental change. Biological Reviews, 88, 349–364.
Peters, G. P., Andrew, R. M., Boden, T., Canadell, J. G., Ciais, P., Le Quere, C., et al. (2013). The challenge to keep global warming below 2◦c. Nature Climate Change, 3, 4–6.
Power, M. E. (1992). Top–down and bottom–up forces in food webs: Do plants have primacy. Ecology, 73, 733–746.
Rockström, J., Steffen, W., Noone, K., Persson, A., Chapin, F. S., Lambin, E. F., et al. (2009). A safe operating space for humanity. Nature, 461, 472–475.
Runge, M. C., & Johnson, F. A. (2002). The importance of functional form in optimal control solutions of problems in population dynamics. Ecology, 83, 1357–1371.
Sala, O. E., Chapin, F. S., Armesto, J. J., Berlow, E., Bloomfield, J., Dirzo, R., et al. (2000). Biodiversity: Global biodiversity scenarios for the year 2100. Science, 287, 1770–1774. Scherber, C., Eisenhauer, N., Weisser, W. W., Schmid, B., Voigt, W.,
Fischer, M., et al. (2010). Bottom–up effects of plant diversity on multitrophic interactions in a biodiversity experiment. Nature, 468, 553–556.
Schmitz, O. J. (2004). Perturbation and abrupt shift in trophic control of biodiversity and productivity. Ecology Letters, 7, 403–409. Tilman, D., Balzer, C., Hill, J., & Befort, B. L. (2011). Global
food demand and the sustainable intensification of agriculture. Proceedings of the National Academy of Sciences of the United States of America, 108, 20260–20264.
Vitousek, P. M., Aber, J. D., Howarth, R. W., Likens, G. E., Matson, P. A., Schindler, D. W., et al. (1997). Human alteration of the global nitrogen cycle: Sources and consequences. Ecological Applications, 7, 737–750.
Vitousek, P. M., Mooney, H. A., Lubchenco, J., & Melillo, J. M. (1997). Human domination of earth’s ecosystems. Science, 277, 494–499.
Williams, R. J. (2010). Network3d software. Cambridge, UK: Microsoft Research.
Worm, B., Barbier, E. B., Beaumont, N., Duffy, J. E., Folke, C., Halpern, B. S., et al. (2006). Impacts of biodiversity loss on ocean ecosystem services. Science, 314, 787–790.
Available online atwww.sciencedirect.com