HAL Id: hal-00301023
https://hal.archives-ouvertes.fr/hal-00301023
Submitted on 23 Feb 2006HAL is a multi-disciplinary open access
archive for the deposit and dissemination of sci-entific research documents, whether they are pub-lished or not. The documents may come from teaching and research institutions in France or abroad, or from public or private research centers.
L’archive ouverte pluridisciplinaire HAL, est destinée au dépôt et à la diffusion de documents scientifiques de niveau recherche, publiés ou non, émanant des établissements d’enseignement et de recherche français ou étrangers, des laboratoires publics ou privés.
Efficiency of the deposition mode ice nucleation on
mineral dust particles
O. Möhler, P. R. Field, P. Connolly, S. Benz, H. Saathoff, M. Schnaiter, R.
Wagner, R. Cotton, M. Krämer, A. Mangold, et al.
To cite this version:
O. Möhler, P. R. Field, P. Connolly, S. Benz, H. Saathoff, et al.. Efficiency of the deposition mode ice nucleation on mineral dust particles. Atmospheric Chemistry and Physics Discussions, European Geosciences Union, 2006, 6 (1), pp.1539-1577. �hal-00301023�
ACPD
6, 1539–1577, 2006 Ice nucleation on mineral dust O. M ¨ohler et al. Title Page Abstract Introduction Conclusions References Tables Figures J I J I Back CloseFull Screen / Esc
Printer-friendly Version
Interactive Discussion
EGU Atmos. Chem. Phys. Discuss., 6, 1539–1577, 2006
www.atmos-chem-phys-discuss.net/6/1539/2006/ © Author(s) 2006. This work is licensed
under a Creative Commons License.
Atmospheric Chemistry and Physics Discussions
E
fficiency of the deposition mode ice
nucleation on mineral dust particles
O. M ¨ohler1, P. R. Field2,5, P. Connolly3, S. Benz1, H. Saathoff1, M. Schnaiter1, R. Wagner1, R. Cotton2, M. Kr ¨amer4, A. Mangold4,*, and A. J. Heymsfield5
1
Forschungszentrum Karlsruhe, Institute for Meteorology and Climate Research (IMK-AAF), Germany
2
Met Office, OBR (Observations Based Research), UK 3
University of Manchester, School of Earth, Atmospheric and Environmental Sciences, UK 4
Forschungszentrum J ¨ulich, Institute of Chemistry and Dynamics of the Geosphere (ICG-I), Germany
5
NCAR, MMM (Mesoscale and Microscale Meteorology), USA *
now at: Royal Meteorological Institute, Ozone Research Group, Belgium
Received: 5 December 2005 – Accepted: 23 December 2005 – Published: 23 February 2006 Correspondence to: O. M ¨ohler ([email protected])
ACPD
6, 1539–1577, 2006 Ice nucleation on mineral dust O. M ¨ohler et al. Title Page Abstract Introduction Conclusions References Tables Figures J I J I Back CloseFull Screen / Esc
Printer-friendly Version
Interactive Discussion
EGU
Abstract
The deposition mode ice nucleation efficiency of various dust aerosols was investigated at cirrus cloud temperatures between 196 K and 223 K using the aerosol chamber fa-cility AIDA (Aerosol Interaction and Dynamics in the Atmosphere). Arizona test dust (ATD) as a reference material and two dust samples from the Takla Makan desert in
5
Asia (AD1) and Sahara (SD2) were used for the experiments at simulated cloud condi-tions. The dust particle sizes were almost lognormally distributed with mode diameters between 0.3 µm and 0.5 µm and geometric standard deviations between 1.6 and 1.9. Deposition ice nucleation was most efficient on ATD particles with ice-active particle fractions of about 0.6 and 0.8 at an ice saturation ratio Si<1.15 and temperatures of 10
223 K and 209 K, respectively. No significant change of the ice nucleation efficiency was found in up to three subsequent cycles of ice activation and evaporation with the same ATD aerosol. The desert dust samples SD2 and AD1 showed a significantly lower fraction of active deposition nuclei, about 0.25 at 223 K and Si<1.35. For all
samples the ice activated aerosol fraction could be approximated by an exponential
15
equation as function of Si. This formulation of ice activation spectra may be used to calculate the formation rate of ice crystals in models, if the number concentration of dust particles is known. More experimental work is needed to quantify the variability of the ice activation spectra as function of the temperature and dust particle properties.
1 Introduction
20
Whether cirrus clouds have a net cooling or heating effect on climate depends, among other factors, on the number concentration, size, and habit of ice crystals and therefore on the cirrus formation mechanisms. It is known from numerous field and modelling studies that both homogeneous freezing of solution droplets and heterogeneous ice nucleation on the surface of insoluble aerosol particles contribute to the formation of
25
ACPD
6, 1539–1577, 2006 Ice nucleation on mineral dust O. M ¨ohler et al. Title Page Abstract Introduction Conclusions References Tables Figures J I J I Back CloseFull Screen / Esc
Printer-friendly Version
Interactive Discussion
EGU measurements during the European project INCA (Str ¨om et al., 2003) revealed that
in parts of the polluted northern hemisphere, cirrus clouds are formed via the hetero-geneous pathway, but that homohetero-geneous ice nucleation is also involved (Haag et al., 2003;Seifert et al.,2003). Aircraft studies of wave clouds also demonstrated the role of heterogeneous ice nucleation (Jensen et al.,1998;Field et al.,2001) and of mineral
5
particles as ice nuclei (Targino et al.,2005).
Specific surface properties of the heterogeneous ice nuclei can markedly lower the ice supersaturation threshold for heterogeneous ice nucleation compared to homo-geneous freezing (Pruppacher and Klett, 1997), thereby changing not only the fre-quency of occurrence but also the microphysical and optical properties of cirrus clouds.
10
Heintzenberg et al.(1996) found desert dust particles probably originating from Saha-ran source regions to dominate the composition of non-volatile residuals of ice crystals in cirrus over the Alps. Chen et al.(1998) found enhanced number fractions of crustal particles, besides carbonaceous and metallic particles, in the population of ice nuclei measured during the SUCCESS studies over Northern America. More recently, the
15
role of desert dust particles as ice nuclei was demonstrated by several aircraft-based studies of a Saharan dust plume event over Florida (DeMott et al.,2003;Sassen et al., 2003;Cziczo et al.,2004) which were conducted as part of the CRYSTAL-FACE project. During the same project,Twohy and Poellot(2005) investigated the nature of ice resid-ual particles in anvil cirrus at temperatures between about 252 K and 217 K. Crustal
20
components were found, among other insoluble particles, especially at higher temper-atures, whereas more soluble salt and sulphates were present at lower temperatures.
Mineral surfaces are known to effectively initiate ice formation both in the immersion freezing and deposition nucleation mode (Roberts and Hallett,1968;Pruppacher and Klett,1997;Zuberi et al.,2002;Bailey and Hallett,2002). Hung et al.(2003) found that
25
the heterogeneous ice nucleation rates of ammonium sulphate solution droplets with a mineral dust core depend, beside temperature and ice supersaturation, on the size of the immersed mineral particle.Archuleta et al.(2005) recently reported size-dependent ice nucleation efficiencies of aluminium oxide, alumina-silicate, and iron oxide particles
ACPD
6, 1539–1577, 2006 Ice nucleation on mineral dust O. M ¨ohler et al. Title Page Abstract Introduction Conclusions References Tables Figures J I J I Back CloseFull Screen / Esc
Printer-friendly Version
Interactive Discussion
EGU as well as a desert dust sample from Asia.
In contrast to homogeneous freezing rates of solution droplets which can be param-eterised in numerical models mainly as function of the temperature, relative humidity, and aerosol parameters (Sassen and Dodd,1988;Heymsfield and Miloshevich,1993; Koop et al.,2000;K ¨archer and Lohmann,2002), microphysical-based
parameterisa-5
tions for heterogeneous ice nucleation processes are more difficult to assess. Up to now, most models rely on empirical relations for the number concentrations of ice nu-clei as function of the temperature and/or ice saturation ratio (Fletcher,1962;Meyers et al.,1992). Stochastic models have been developed to calculate the nucleation rates of supercooled water in contact with solid surfaces (Pruppacher and Klett,1997).
De-10
Mott et al. (1998) used an enhanced effective freezing temperature in the expression of the classical nucleation rate of pure water to calculate heterogeneous freezing rates. Only recently, new concepts have been suggested to calculate heterogeneous freez-ing rates as function of aerosol properties (K ¨archer and Lohmann, 2003; Diehl and Wurzler,2004).
15
The heterogeneous ice nucleation of various dust samples was comprehensively investigated in several experiment series using the AIDA aerosol chamber facility. In this paper we describe the experimental methods and discuss results of experiments with dry mineral dust aerosols, mainly so-called Arizona test dust, at temperatures between 224 K and 196 K. Results from similar experiments with desert dust samples
20
from Africa and Asia are discussed in more detail in a companion paper by Field et al. (2006).
2 Experimental methods
2.1 Description of AIDA aerosol chamber
Figure 1 schematically shows the setup and instrumentation of the aerosol chamber
25
Forschungszen-ACPD
6, 1539–1577, 2006 Ice nucleation on mineral dust O. M ¨ohler et al. Title Page Abstract Introduction Conclusions References Tables Figures J I J I Back CloseFull Screen / Esc
Printer-friendly Version
Interactive Discussion
EGU trum Karlsruhe which was used for the ice nucleation studies. The facility can be
operated as an expansion cloud chamber to investigate microphysical processes at simulated cloud conditions. Respective experimental methods have been described previously (M ¨ohler et al.,2003,2005a,b;Benz et al.,2005) and are only briefly sum-marised here. The facility mainly consists of a cylindrical aerosol vessel encased in a
5
large, thermally insulated box and connected to a vacuum and air supply system. The aerosol vessel (4 m diameter, 84 m3 volume) can be evacuated to a pressure below 0.1 hPa and filled with particle free synthetic air to start any experiment with clean conditions with an aerosol background concentration of less than 0.1 cm−3.
The interior of the thermally insulated box can be cooled by air ventilation to any
10
temperature down to 183 K. Cooling rates are limited by the air ventilation and cooling system to about 5 K h−1. Strong cooling or heating causes larger temperature gradi-ents inside the box and is therefore achieved by automatic control during the night when no expansion experiments take place. The experiments discussed here are not per-formed during such strong temperature change conditions but by running the chamber
15
at a constant temperature during each day of experiments. During constant tempera-ture control the temporal and spatial temperatempera-ture fluctuations around the mean value are typically less than ±0.3 K throughout the entire box and the aerosol vessel. The interior of the aerosol vessel is additionally stirred with a mixing fan which is located in the bottom part of the aerosol vessel. Under stirred conditions the deviations of the
20
gas temperature inside the aerosol vessel from the mean value are typically less than ±0.2 K.
2.2 Simulation of cloud expansion
Before starting ice nucleation experiments, the cloud chamber is typically cooled to a temperature of about 268 K and filled with humidified air with a frost point temperature
25
of at least 263 K. During slow cooling, the excess water vapour forms a frost layer on the chamber walls. The frost layer maintains almost ice saturated conditions at lower temperatures. After reaching conditions of uniform temperature (within ±0.2 K) and
ACPD
6, 1539–1577, 2006 Ice nucleation on mineral dust O. M ¨ohler et al. Title Page Abstract Introduction Conclusions References Tables Figures J I J I Back CloseFull Screen / Esc
Printer-friendly Version
Interactive Discussion
EGU relative humidity (within ±3%) inside the aerosol vessel, the aerosol to be studied is
added (see Sect.2.3) and the first ice activation experiment is started. Ice supersatu-rated conditions are achieved by controlled pumping, typically from 1000 to 800 hPa. After pumping starts, the gas temperature Tg drops almost adiabatically due to volume expansion. Because the wall temperature Tw remains almost constant during
expan-5
sion, there is a heat flux from the warmer walls to the volume which increases with increasing Tw−Tg. Therefore, Tg deviates from the adiabatic profile and approaches an almost constant steady state value after about 15 to 20 min of pumping at a constant rate of pressure change. The mixing fan maintains homogeneous temperature and humidity conditions within the entire volume of the aerosol vessel except for a few
cen-10
timetre thick boundary transition layer to the vessel walls. Even during strong pumping expansion and cooling, temperatures throughout the mixed part of the volume differ from the mean value by typically less than 0.3 K.
Starting at almost ice saturated conditions, ice saturation is exceeded shortly af-ter pumping starts. The ice saturation ratio Si=ew/es,i increases due to the fact that
15
the water vapour saturation pressure with respect to ice, es,i, exponentially decreases with decreasing Tg, whereas the actual water vapour pressure, ew, only linearly de-creases with decreasing pressure during pumping. With the highest pumping speed maximum initial cooling rates of about 4 K min−1 can be achieved in the AIDA aerosol chamber which corresponds to the cooling rate of an adiabatically expanding air parcel
20
ascending in the upper troposphere at an updraft speed of about 6 m s−1. During the simulation runs Si typically increases at a rate of about 0.1 to 0.5 min−1(M ¨ohler et al., 2005a).
2.3 Origin, preparation, and characterisation of dust samples
Three mineral dust samples were used, namely two desert dust samples from Asia
25
(AD1) and the Sahara (SD2) and so-called Arizona test dust (ATD). The sample AD1 which was provided by the University of Mainz, Germany, was collected from the ground in the easterly parts of the Takla Makan Desert in China, east of the Dalimu
ACPD
6, 1539–1577, 2006 Ice nucleation on mineral dust O. M ¨ohler et al. Title Page Abstract Introduction Conclusions References Tables Figures J I J I Back CloseFull Screen / Esc
Printer-friendly Version
Interactive Discussion
EGU Basin between Kuerle and Ruoquiang. The Saharan dust SD2 is also a surface
sam-ple which was collected about 50 km north of Cairo city, Egypt. Both desert samsam-ples were stored and transported in clean bottles to avoid contamination. The ATD sample was selected because it is available from Powder Technology Inc. (Minnesota, USA) as a reference material which can be used in other labs for comparison of results and
5
methods of ice nucleation. According to the manufacturer, ATD is produced by (1) grinding samples of sand from Arizona in a stainless steel ball mill, (2) separating the fine particle size fractions by elutriation in water, (3) drying the coarse material in an oven, (4) remilling and separating the dried sample into four distinct size classes, and (5) blending the four milling fractions to get a sample of the desired particle size
distri-10
bution. We used a sample with a nominal 0–3 µm particle diameter size range (batch No. 130300).
The elemental composition of each sample was analysed by X-ray fluorescence analysis (XRF, SRS 303AS, Bruker AXS). Amounts of 200 mg were taken from the ATD sample and from sieve fractions of AD1 and SD2 with particles smaller than 20 µm in
15
diameter. The 200 mg dust samples were tempered for one hour at 1000◦C prior to the analysis. The results listed in Table1are weight percentages of respective oxides. Silicon, aluminium, and calcium oxides are most abundant in all samples. ATD shows relatively large amounts of aluminium, AD1 of silicon, and SD2 of calcium oxides.
It should be noted that these are results of a bulk analysis with particles up to 20 µm
20
in diameter for the samples AD1 and SD2. The mineral composition will certainly change from particle to particle and probably also with particle diameter. In the latter case, the bulk analysis may not be representative for the aerosol used in our experi-ments because aerosol particles smaller than about 2 µm in diameter were selected in the following way: First, the mechanically sieved fraction of particles smaller than
25
70 µm was roughly dispersed with a rotating brush disperser (RGB 1000, Palas). The ATD sample was not sieved prior to dispersion because it contained only particles smaller than 3 µm in diameter. Second, the finest particles were de-agglomerated in an aerosol dispersion nozzle. Third, particles larger than about 2 µm in diameter were
ACPD
6, 1539–1577, 2006 Ice nucleation on mineral dust O. M ¨ohler et al. Title Page Abstract Introduction Conclusions References Tables Figures J I J I Back CloseFull Screen / Esc
Printer-friendly Version
Interactive Discussion
EGU removed in a series of four 90◦ inertial impactor stages with a 50% cut-off diameter
of about 1.5 µm. Both the brush disperser and the dispersion nozzle were operated with dry and particle-free synthetic air to avoid contamination of the dust aerosol with particles of unknown origin. The dispersion pressure of the nozzle was 1.5 bar. After passing the impactor stages the aerosol flow was directly added to the aerosol
cham-5
ber.
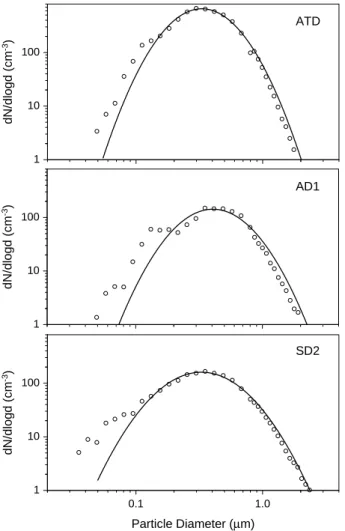
Figure 2shows typical number size distributions of the three dust types ATD, AD1, and SD2 sampled from the AIDA aerosol chamber. The size distributions have been measured with a scanning mobility particle sizer (SMPS, TSI) and an aerodynamic particle spectrometer (APS, TSI). The measured size distributions of the three dust
10
samples can be approximated by a lognormal fit with a median diameter of 0.33 µm, 0.41 µm, and 0.33 µm and a geometric standard deviation of 1.65, 1.72, and 1.86, for ATD, AD1, and SD2, respectively. At diameters below about 0.2 µm the SMPS over-estimates the number concentrations due to incomplete charge correction of multiply charged particles with diameters larger than 0.8 µm, which is the upper mobility size
15
range limit of the SMPS system.
The range of lognormal fit parameters for all mineral dust size distributions measured during the experiments discussed in this paper are given in Table 1. The respective surface areas sae have been normalized to a number concentration nae=100 cm−3. These surface areas will be used in Sect.3.3to estimate surface nucleation rates. It
20
should be noted that we assumed spherical particle shapes to calculate sae. Electron micrographs showed the mineral particles to have irregular and partly aggregate-like structures. Therefore, the actual surface area of the dust aerosols may be somewhat higher than given in Table1. We were not able to quantify this structure dependent enhancement of surface area.
25
2.4 Water vapour and ice saturation measurements
The concentration of total water (gas and condensed phase) was measured with a fast scanning chilled mirror hygrometer (LX-373, MBW) and the Ly-α hygrometer FISH
ACPD
6, 1539–1577, 2006 Ice nucleation on mineral dust O. M ¨ohler et al. Title Page Abstract Introduction Conclusions References Tables Figures J I J I Back CloseFull Screen / Esc
Printer-friendly Version
Interactive Discussion
EGU of Forschungszentrum J ¨ulich (Z ¨oger et al., 1999). Both instruments are located
out-side the cold box and take their sample flow through a stainless steel tube. All ice particles completely evaporate after entering the tube which is heated to 303 K. The LX-373 measures the frost point temperature with an uncertainty of less than ±0.1 K and serves as a reference for the water concentration measurements if no ice particles
5
are present in the aerosol vessel. Advantages of the FISH instrument are a higher sensitivity and time resolution. Both sampling instruments may underestimate the total water concentrations if large ice crystals are sampled at less than 100% efficiency into the horizontal sampling tube. This artifact does not affect the conclusions of this paper. The water vapour pressure ew is directly measured in situ with a tunable diode laser
10
(TDL) absorption spectrometer. The TDL system is based on a room temperature near-infrared tunable diode laser at 1370±2 nm and a 82 m White multi-path cell (Ebert et al., 2005;M ¨ohler et al.,2005a). Systematic errors, e.g. due to uncertainties of absorption line parameters taken from the literature, were eliminated by scaling the TDL data set to the chilled mirror data with a constant factor of up to 1.3, depending on the
15
water absorption line used for the TDL scans. After this scaling correction, the TDL system provided a time resolution of about 1 Hz, an accuracy of ±5 to ±10%, and a resolution in the water vapour mixing ratio of up to 15 ppb. Time series of the mean ice saturation ratio Si in the well-mixed chamber volume are obtained at a time resolution of 1 s from the ratio of ew and the ice saturation pressure es,i as function of the mean
20
gas temperature Tg. The latter is calculated as an average of measurements with four carefully calibrated thermocouples oriented along a vertical line located about 1 m from the center of the aerosol vessel. With the uncertainties of the water vapour data and the fluctuation and uncertainty of about ±0.3 K for Tg we can estimate the uncertainty of Si to range between about ±0.06 at Tg≈220 K and ±0.11 at Tg≈190 K.
25
2.5 Aerosol and ice particle measurements
The total aerosol number concentration nae was measured with a condensation par-ticle counter (CPC3010, TSI) which has been modified and calibrated for sampling
ACPD
6, 1539–1577, 2006 Ice nucleation on mineral dust O. M ¨ohler et al. Title Page Abstract Introduction Conclusions References Tables Figures J I J I Back CloseFull Screen / Esc
Printer-friendly Version
Interactive Discussion
EGU at reduced pressures between 1000 hPa and 100 hPa (Seifert et al., 2004). Aerosol
particles with diameters up to about 2 µm are sampled at 100% efficiency through a horizontally oriented stainless steel tube. The sampling tube is about 2 m long and has an inner diameter of 4 mm. About one half of the tube is located inside the aerosol vessel and the cold box. Therefore, small ice particles that form in the chamber during
5
pumping expansion runs can pass this cold tube section and evaporate in the second part of the sampling tube which is at normal room temperature. The CPC then mea-sures the sum of the interstitial aerosol and the residuals from smaller ice particles that do not settle out in the cold tube section. Because the size dependent ice particle loss in the sampling tube cannot quantitatively be determined, the contributions of aerosol
10
particles and ice residuals to the reading of the CPC cannot quantitatively be ruled out if a significant fraction of the aerosol particles acted as ice nuclei.
During pumping expansion, the total particle concentration np=nae+nice, i.e. the sum of the interstitial aerosol and the ice particles or ice nuclei, can be calculated as np=nae(t0)×(p/p(t0)). This equation describes the pumping dilution of the initial
15
aerosol concentration nae(t0) where t0 denotes the time when pumping starts. With that, the fraction fi of ice activated aerosol, which will be discussed in Sect.3, is ob-tained from
fi =nice
np =
nice p(t0)
nae(t0) p (1)
The number concentration nice of ice particles is measured with two optical particle
20
counters (PCS2000 and Welas, Palas GmbH, Germany) and the so-called small ice detector SID, which was developed by the University of Hertfordshire for aircraft-based cloud studies (Hirst et al., 2001). A technical description of the SID probe and its application to AIDA ice nucleation studies is given byField et al.(2006). Most of the results discussed in this paper rely on measurements with the PCS2000 instrument,
25
hereafter termed OPC-PCS. The OPC-PCS measures, at 90±12◦scattering angle, the intensity of white light scattered by single particles. The particle number concentration
ACPD
6, 1539–1577, 2006 Ice nucleation on mineral dust O. M ¨ohler et al. Title Page Abstract Introduction Conclusions References Tables Figures J I J I Back CloseFull Screen / Esc
Printer-friendly Version
Interactive Discussion
EGU the optical detection volume. The latter is calibrated with an aerosol of known number
concentration.
The OPC-PCS is not only sensitive to ice particles but also to dust aerosol particles, depending on their size and refractive index. Dust particles have refractive indices typ-ically larger than 1.5 and are therefore detected with the OPS-PCS if larger than about
5
0.5 µm in diameter. According to the aerosol size distributions shown in Fig.2, the OPC-PCS detects only a minor fraction of the total dust aerosol. Ice particles have a relatively low refractive index of 1.32 and are therefore detected only if larger than about 0.8 µm in diameter. Because there is an overlapping size range for aerosol and ice particles detected with the OPC-PCS, the ice particle number concentration
10
is not directly obtained from the PSC measurements. Mineral dust particles are not expected to significantly grow in size by liquid water uptake under the conditions of our experiment, and so any increase of nP CS can only be due to pristine ice crystals with
d >0.8 µm. Therefore, taking into account pumping dilution, the ice number
concentra-tion can be estimated as
15
nice ≈ nPCS− nPCS(t0) p
p(t0). (2)
In addition, the total number concentration nPCS gives an upper estimate for nice. As mentioned above, the OPC is only sensitive to ice particles with d >0.8 µm. Therefore, the ice particle detection is delayed by the growth time of pristine deposition ice germs to ice crystals of detectable size. The mass growth equation for spherical particles was
20
applied to estimate respective growth times of 4 s at 223 K, 8 s at 210 K, and 50 s at 196 K. This delay of ice particle detection with the OPC is considered in the analysis of the ice activation spectra discussed in Sect.3.
Ice particle number concentrations were also retrieved from FTIR extinction spectra as described byMangold et al.(2005). The extinction spectra were measured in situ
25
with a White-type multiple reflection cell with a horizontal optical path of up to 254.3 m (Wagner et al.,2005). Spectra are recorded with a FTIR spectrometer (IFS 66v, Bruker) in the wave number range from 800 to 6000 cm−1, at a resolution of 4 cm−1, and at a
ACPD
6, 1539–1577, 2006 Ice nucleation on mineral dust O. M ¨ohler et al. Title Page Abstract Introduction Conclusions References Tables Figures J I J I Back CloseFull Screen / Esc
Printer-friendly Version
Interactive Discussion
EGU rate of 3 spectra per minute. T-matrix calculations using the code for randomly oriented
circular cylinders (Mishchenko and Travis,1998) were performed to fit the measured extinction spectra of the ice particles. In our previous study (Mangold et al.,2005) the a-spherical ice particles were represented in the calculations by cylinders with a fixed aspect ratio D/L=0.7, where D is the diameter and L the length of the cylinder. In the
5
present work, aspect ratios ranging from 0.5 to 3.0 were employed to examine more thoroughly the effect of particle a-sphericity on the retrieval results. The deduced ice particle number concentrations and ice particle fractions discussed in Sect.3together with the OPC data represent averaged fit results over the specified range of aspect ratios. The details of this approach, as well as a systematic comparison of the ice
10
particle number concentrations measured with the OPC-PCS, OPC-Welas, and SID instruments and those retrieved from the FTIR extinction spectra, will be presented in a separate publication.
In this paper, we discuss ice nucleation results from three distinct series of ice nu-cleation experiments hereafter termed IN02, IN03, and IN04 (see Sect. 2.6 and
Ta-15
ble2). FTIR measurements were performed during all experiments. The OPC-PCS was available only during IN02 and IN03. The optical particle counter Welas (OPC-Welas), an improved version of the OPC-PCS, was used during IN03 and IN04. The optical setup of the OPC-Welas is similar to the OPC-PCS. A major advantage of the OPC-Welas is a separate optics block which is connected with optical fibres to the lamp
20
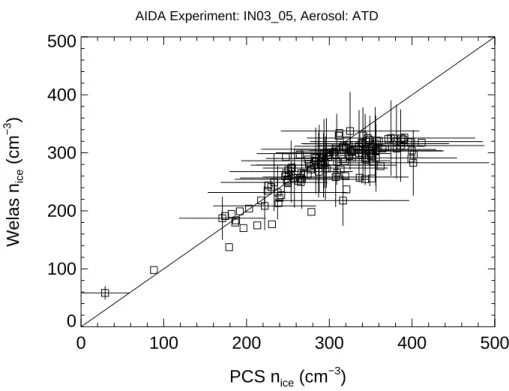
and photomultiplier unit. Only during IN03, both OPCs where available for simultane-ous measurements and intercomparison. Both probes where mounted below the cloud chamber to vertical sampling tubes of about 1 m length and 8 mm inner diameter. From the OPC-Welas, data sets of nicewere obtained in the same way as for the OPC-PCS sensor (see Eq.2). The OPC-Welas is also sensitive to ice particles with d >0.8 µm.
25
Figure3shows, for experiment IN03 5, a typical scatter plot of the OPC-PCS and the OPC-Welas data set. The error bars include both counting errors and an estimated un-certainty of ±10% for the conversion of the count rate into a number concentation. The major contribution to the latter comes from the uncertainty of the flow velocity through
ACPD
6, 1539–1577, 2006 Ice nucleation on mineral dust O. M ¨ohler et al. Title Page Abstract Introduction Conclusions References Tables Figures J I J I Back CloseFull Screen / Esc
Printer-friendly Version
Interactive Discussion
EGU the optical detection volume. The counting efficiency was independently determined
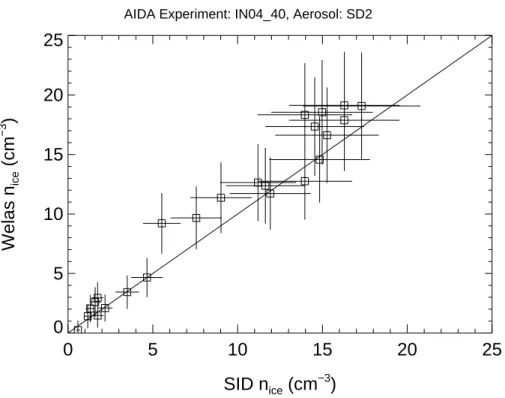
by comparison to measurements with a condensation particle counter. The one-to-one line in Fig.3indicates good agreement between both OPCs within the estimated range of uncertainty. In addition to the OPC-Welas the small ice detector SID was available during IN04 for measurements of the ice particle number concentration. The
uncer-5
tainty of SID ice particle concentrations is about ±20%. As shown in Fig.4 there is also good agreement between ice particle number concentrations measured with the OPC-Welas and the SID probe.
2.6 Experimental parameters
As explained in Sect.2.2 any AIDA cloud expansion run is started at homogeneous
10
temperature and pressure conditions. The initial pressure p, gas temperature Tg, and aerosol number concentration nae are listed in Table 2 for all runs discussed in this paper. The experiments were carried out in three series of AIDA ice nucleation stud-ies (IN02, IN03, and IN04). All runs were started at an initial pressure p(t0) close to 1000 hPa and an ice saturation ratio of about 0.95 (not shown in the Table). Initial
15
temperatures Tg(t0) ranged from 196.4 K to 223.5 K and the aerosol number concen-trations from about 100 to 650 cm−3. In this paper we mainly focus on the deposition ice nucleation efficiency of the freshly dispersed mineral dust samples ATD, AD1, and SD2. Two series of experiments with ATD and initial temperatures of 223 K (IN02 147 to IN02 149) and 210 K investigated the ice nucleation of the same dust aerosol in
sub-20
sequent ice activation and evaporation cycles. The ice nucleation efficiency of freshly dispersed Saharan dust SD2 was investigated in the same temperature range as ATD. Only one experiment with AD1 has been carried out with an initial Tg of 222 K. The characteristics of ice nucleation on the desert dust samples AD1 and SD2 in subse-quent activation and evaporation cycles are discussed in more detail by Field et al.
25
(2006).
ACPD
6, 1539–1577, 2006 Ice nucleation on mineral dust O. M ¨ohler et al. Title Page Abstract Introduction Conclusions References Tables Figures J I J I Back CloseFull Screen / Esc
Printer-friendly Version
Interactive Discussion
EGU which will be discussed in Sect.3.2in terms of the fraction fi of ice activated aerosol
particles as function of Si. The threshold data for fi>0.08 and the fi measured at the peak ice saturation ratio will also be discussed in Sect.3.2.
3 Results and discussion
3.1 Time series
5
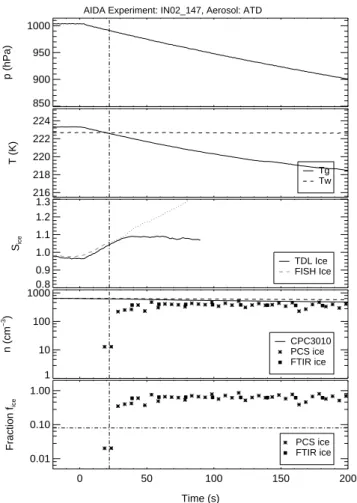
Figures5and 6show time series of data sets from the expansion runs IN02 147 and IN03 05 with initial temperatures of 223.3 K and 210.8 K, respectively. Similar data sets have been obtained for all experiments listed in Table2. The time is given in seconds relative to the time when the pumping started. Only the first 200 seconds of pumping to 800 hPa are considered here. The pressure drop due to pumping is shown in panel
10
1. Panel 2 depicts the almost constant wall temperature Tw (dashed line) and the gas temperature Tg (solid line) which decreases due to expansion cooling during pumping. As mentioned above, the cooling rate is greatest when the pumping starts and slightly decreases with time due to an increasing heat flux from the warmer vessel walls.
With cooling of the well-mixed chamber volume, the ice saturation (panel 3)
calcu-15
lated as the ratio of the actual water vapour pressure from the TDL instrument and the ice saturation pressure with respect to Tg starts to increase from an initial value of about 0.95 during experiment IN02 147 and 0.82 during experiment IN03 05. The lower initial value during experiment IN03 05 is due to the fact that the wall ice layer was almost consumed from previous ice nucleation runs. The ice layer is diminished
20
run by run because the evacuated aerosol vessel is replenished with dry synthetic air. Nevertheless, the initial relative humidity was high enough to exceed the threshold hu-midity for ice nucleation. During both experiments the TDL spectrometer accurately measured the water vapour pressure from the start of pumping until about 50 s after the maximum ice saturation ratio was reached. Thereafter, the data is omitted in the
25
ACPD
6, 1539–1577, 2006 Ice nucleation on mineral dust O. M ¨ohler et al. Title Page Abstract Introduction Conclusions References Tables Figures J I J I Back CloseFull Screen / Esc
Printer-friendly Version
Interactive Discussion
EGU resonant vibrations. The dashed and dotted lines in panel 3 show the ice saturation
ratio calculated from the total water concentration which was measured with the Ly-α hygrometer FISH during experiment IN02 147 and the chilled-mirror hygrometer during experiment IN03 05. There is good agreement between the total and gas-phase water data until the onset of ice nucleation. Later on, the increasing difference between both
5
data sets indicates the increasing water content of the growing ice particles.
Panel 4 of Figs.5 and 6shows measured number concentrations of aerosol (nae) and ice particles (nice). The solid line depicts naedirectly measured with the CPC3010. The dashed line indicates the total particle number concentration which was calculated from the initial aerosol concentration assuming constant mixing ratio of particles during
10
pumping. As explained in Sect.2.5, the difference between the solid and dashed lines indicates partial loss of larger ice particles by sedimentation in the sampling tube of the CPC3010 instrument. This loss is only small in the examples shown here but can be much larger in experiments at higher temperatures and low ice nuclei concentrations when the ice particles grow to larger sizes. The number concentration of ice particles
15
was calculated with Eq. (2) from OPC-PCS measurements (stars in panel 4) and re-trieved from FTIR extinction spectra (solid squares). The OPC-PCS time series have been shifted by the characteristic time for the growth of ice crystals into the detection range of the OPC-PCS instrument (see Sect.2.5).
In general, the OPC-PCS ice number concentrations are in good agreement with
20
those retrieved from the FTIR extinction spectra. After the onset of ice nucleation the number of ice crystals increases until Si reaches its peak value Smax. This maximum value of Si (see Table2) mainly depends on the rate of ice particle formation, the growth rate of the ice crystals and the cooling rate. Smax of only 1.09 and 1.16 are reached in experiments IN02 147 and IN03 05, respectively. In all experiments discussed here,
25
the formation of new ice particles was mainly observed in relatively short time periods when Si increased from a threshold value for onset of ice nucleation close to 1 to
Smax. Formation of new ice crystals almost instantly stopped after Smax was reached. In the further course of most experiments, Si stayed almost constant or only slightly
ACPD
6, 1539–1577, 2006 Ice nucleation on mineral dust O. M ¨ohler et al. Title Page Abstract Introduction Conclusions References Tables Figures J I J I Back CloseFull Screen / Esc
Printer-friendly Version
Interactive Discussion
EGU decreased without any further ice particle nucleation. This indicates that the formation
rate of ice crystals by the deposition nucleation on the surface of dust particles may be described mainly as a function of Si at a given temperature and is independent of e.g. the cooling rate.
The fraction fi of ice particles to the total aerosol particle concentration (see Eq.1)
5
is shown in panel 5 of Figs.5and 6. Similar to the total ice particle concentration, fi steadily increases after the onset of ice nucleation and stays almost constant after the time tmaxwhen Smaxwas reached. The relation between fi and Si will be discussed in detail in Sect.3.2. In the following paragraphs we discuss the ice particle fraction fmax measured at tmaxwhich gives a first idea of the ice nucleation efficiency of the different
10
dust samples as function of the ice saturation ratio and temperature (see alsoMangold et al.,2005). We do not attempt here to quantitatively describe Smaxas function of the cooling rate, the formation rate of ice crystals, and the dynamic partitioning of water vapour between the gaseous and condensed phases. This will be done in a process modelling study which is in preparation. However, it is obvious that Smax tends to be
15
higher for (1) faster cooling rates, (2) less efficient ice formation (smaller ice surface for uptake of water vapour) or smaller aerosol concentration, and (3) lower temperature (slower crystal growth rates). Table2shows Smaxof all experiments to range between 1.09 and 1.45 with respective fmaxbetween 0.26 and 0.88. All fmaxdata was obtained by linear interpolation of the FTIR fi data points to tmax. The data show that significant
20
number fractions of the dust particles are active deposition ice nuclei at very low ice supersaturations.
In three subsequent expansion runs with the same ATD aerosol starting at T ≈223 K (runs IN02 147 to IN02 149) about 60% of the dust particles acted as deposition ice nuclei at Si<1.15. At T ≈210 K (runs IN03 05 to IN03 07) a somewhat higher ATD 25
aerosol number fraction of about 80% is activated in the same range of supersaturation. Note that in both series the number concentrations decreased from run to run both by dilution during pumping and refilling with particle free synthetic air and by partial deposition of ice particles. Furthermore, different pumping speeds where applied in the
ACPD
6, 1539–1577, 2006 Ice nucleation on mineral dust O. M ¨ohler et al. Title Page Abstract Introduction Conclusions References Tables Figures J I J I Back CloseFull Screen / Esc
Printer-friendly Version
Interactive Discussion
EGU different runs which is reflected by the parameter dSi/d t in Table2. Changes of both
the aerosol number concentration and the cooling rate have no significant effect on the peak Si and fi data. Only during IN03 21 with ATD at the lowest temperature of 196 K the maximum Si was significantly higher, mainly resulting from the high pumping speed during this run combined with slower ice particle growth rate at the low temperature and
5
therefore a slower depletion rate by uptake of water vapour to the ice surface. It is likely that most of the ice crystals already formed at saturation ratios below the peak value of 1.41, but could not be detected earlier because of the detection limit for ice crystals of the OPC-PCS and the FTIR retrieval (see Sect.2.5). No reliable correction for the growth time delay was possible at temperatures around 196 K.
10
During two runs with SD2 and AD1 and initial temperatures above 220 K, fi was limited to 0.24 for SD2 and 0.26 for AD1 with Smaxof 1.45 and 1.41, respectively. Two more runs with SD2 at initial temperatures of 213.1 K and 210.0 K show significantly lower Smax and higher fmax. This indicates a strong temperature dependence with higher ice nucleation efficiency at lower temperature. At the lowest temperature run
15
with SD2 we can, for the same reasons as discussed above for the runs with ATD, assume that the value of 1.44 for Smax is only an upper limit for fi to reach a value of 0.81. Unfortunately, no runs with AD1 are available so far at T <220 K.
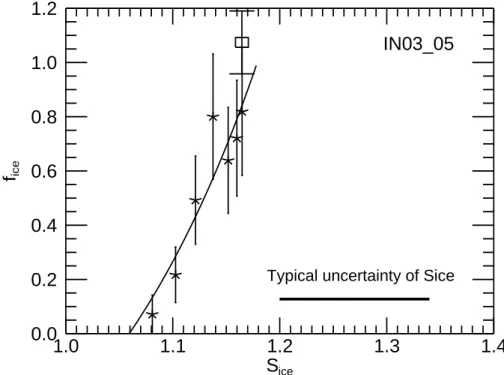
3.2 Ice activation spectra
In this section we discuss the efficiency of the different mineral aerosol particles as
20
deposition ice nuclei in terms of the ice activated number fraction fi as function of the increasing ice saturation ratio Si. Two examples for this relation are plotted in Figs.7and 8for experiments IN02 147 and IN03 05, respectively. The figures depict only data between t0, the start of pumping, and tmax, the time when the maximum Si was reached. fi was obtained from the OPC-PCS data set at a time resolution of 5 s
25
(stars). Only few data points of fi were obtained from the FTIR spectra before tmax (open squares). The horizontal bar indicates the typical range of uncertainty for Si as discussed in Sect.2.4with a major contribution from distribution of the actual gas
tem-ACPD
6, 1539–1577, 2006 Ice nucleation on mineral dust O. M ¨ohler et al. Title Page Abstract Introduction Conclusions References Tables Figures J I J I Back CloseFull Screen / Esc
Printer-friendly Version
Interactive Discussion
EGU perature around the mean gas temperature used to calculate Si. The relative change
of Si during the course of an experiment is much more precisely determined. If the ice formation observed during our expansion experiments would e.g. be dominated by the minimum instead of the mean gas temperature, the activation spectra have systemati-cally to be shifted by about 4% to higher Si. The minimum and mean temperatures are
5
obtained from four independent temperature readings along a vertical line close to the center of the cloud chamber.
As already indicated in the discussion of the time series and maximum values of
fi and Si in Sect. 3.1 the number fraction of mineral dust particles acting as deposi-tion ice nuclei is mainly determined, at a given initial temperature of AIDA expansion
10
experiments, by the increasing ice saturation ratio. Meyers et al. (1992) fitted an ex-ponential function to atmospheric ice nuclei measurements at temperatures between about 266 K and 253 K which is used in cloud models to calculate the number of ice particles as function of the ice saturation ratio. Based on our experimental results, we suggest a similar exponential equation to parameterise the fraction of mineral particles
15
acting as deposition nuclei as function of Si−S0. It is assumed that no ice nucleation occurs below the threshold ice saturation ratio S0. Above S0, the fraction fi increases exponentially according to
fi = exp[a (Si− S0)] − 1, (3)
where both S0 and the scaling factor a may depend on aerosol properties and the
20
temperature. Fits of Eq. (3) to the experimental data which are defined for 0<fi<1 are
shown as solid lines in Figs.7and8. The exponential approximations were applied to the OPC-PCS data sets of fi for experiment series IN02 and IN03 and the OPC-Welas data sets for IN04. The resulting fit parameters S0 and a are listed in Table 2 for all experiments with reliable data sets of fi and Si. For all runs the ice nucleation was
25
found to start at very low threshold ratios 1.0<S0<1.19. The highest values of 1.1 and
1.19 are found for runs with SD2 and AD1, respectively, at temperatures above 220 K. For the experiments at the lowest temperatures around 197 K we only obtained an estimate for S0of 1.1 and 1.02 for ATD and SD2, respectively.
ACPD
6, 1539–1577, 2006 Ice nucleation on mineral dust O. M ¨ohler et al. Title Page Abstract Introduction Conclusions References Tables Figures J I J I Back CloseFull Screen / Esc
Printer-friendly Version
Interactive Discussion
EGU The exponential factor a determines the steepness of the activation curve and
there-fore the formation rate of ice crystals as function of Si. This factor scatters between 3.3 and 13.2 for all experiments with ATD. Mean values of 4.7 and 9.2 are obtained for the three runs at 223 K and 210 K. The higher value at the lower temperature is consistent with the fact that also fmaxis higher at the lower temperature (see Sect.3.1).
5
For the experiments with the desert dust samples, the exponential factor is somewhat smaller with values of less than 1 for experiments above 220 K and of 1.7 to 3.0 for experiments IN04 44 and IN03 11 with SD2. This also shows the ice activity of SD2 to increase with decreasing temperature.
We have also calculated from Eq. (3) the ice saturation S8% at which fi exceeds a
10
value of 0.08 (see Table2). In a companion paperField et al.(2006) show that a value of fi≈0.08 separates two different ice nucleation modes which appeared in repeated ice nucleation and evaporation cycles with the desert dust samples AD1 and SD2. For comparison with these results we have chosen the same threshold value of 0.08.Field et al. (2006) describe the characteristics of the dual mode nucleation behaviour and
ex-15
plain the second ice nucleation mode which appears at Si between 1.35 and 1.5 either as deposition nucleation or condensation freezing. The second mode became more obvious in the subsequent expansion runs of the same dust aerosol. The parameter-isation we suggest here applies only to the first deposition nucleation mode in freshly dispersed dust samples and low ice supersaturations. To avoid interference with the
20
second nucleation mode the fits discussed here have been restricted to Si<1.35.
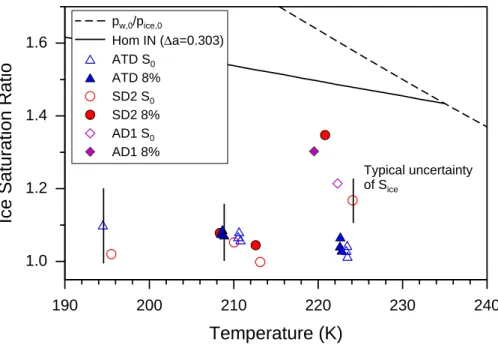
Figure 9 depicts, as function of temperature, the threshold ice saturation ratios S0 (open symbols) and S8% (closed symbols). The onset thresholds are below 1.1 for all three dust types except for the desert dust samples SD2 and AD1 at the highest temperature. Also S8% is significantly higher for the desert dusts at similar
tempera-25
tures. At the lowest temperatures only the ice nucleation onset could be determined for ATD and SD2. The characteristics of ice nucleation on SD2 and AD1 dust aerosols at temperatures above 220 K are discussed byField et al.(2006).
ACPD
6, 1539–1577, 2006 Ice nucleation on mineral dust O. M ¨ohler et al. Title Page Abstract Introduction Conclusions References Tables Figures J I J I Back CloseFull Screen / Esc
Printer-friendly Version
Interactive Discussion
EGU the relative increase of fi with Si which is obtained from Eq. (3) as
d fi
d Si = a exp[a (Si − S0)]= a (fi + 1). (4)
It can be seen that d fi/d Si is initially determined by the parameter a (i.e. fi=0) and is larger by a factor of two when fi approaches its maximum value of 1. Values calculated for fi = 0.08 are listed in Table2. The formation rate of ice crystals can be calculated
5
from Eqs. (1) and (4) as
d nice d t = np d fi d Si d Si d t ≈ npa d Si d t , (5)
where the approximation neglects the exponential factor in Eq. (4). This equation may be used to parameterise the ice formation rate by deposition nucleation in models as function of the rate of ice saturation increase above S0, provided that the aerosol
10
particle concentration npand the respective parameters S0and a are known. 3.3 Nucleation rates
It is difficult if not impossible to formulate a surface nucleation rate for a complex sys-tem like a mineral dust aerosol which is composed of particles with different sizes, mineralogy, shape, and surface roughness. Nevertheless, experimental data may, if
15
appropriate, be used to estimate nucleation rates as function of temperature, ice su-persaturation, and aerosol properties. Archuleta et al.(2005) e.g. calculated, from ice nucleation measurements in a continuous flow diffusion chamber, heterogeneous sur-face nucleation rates Js on size-fractionated aluminium and iron oxide particles with diameters between 50 and 200 nm which were treated with sulphuric acid. As
ex-20
pected, Js was larger at larger relative humidity or water activity of the sulphuric acid and lower temperature. At temperatures between about 203 and 233 K and water ac-tivities between 0.79 and 0.91, Jsvaried between about 105cm−2s−1and 107cm−2s−1. In a flow tube study with similar oxide particles but with ammonium sulphate instead of
ACPD
6, 1539–1577, 2006 Ice nucleation on mineral dust O. M ¨ohler et al. Title Page Abstract Introduction Conclusions References Tables Figures J I J I Back CloseFull Screen / Esc
Printer-friendly Version
Interactive Discussion
EGU sulphuric acid treatmentHung et al. (2003) found Js to be about a factor of 100 lower
at temperatures around 233 K.
To estimate an equivalent surface nucleation rate for the conditions of our experi-ments we first calculated the formation rate of ice crystals from Eqs. (5) and (4) for
fi=0.08 with the total particle concentration np discussed in Sect.2.5. Assuming that
5
all particles form ice germs with the same surface nucleation rate we can calculate the effective surface nucleation rate Js from the ratio of the measured ice formation rate and the aerosol surface area concentration sae. The aerosol surface area was calculated from the size distribution parameters given in Table1and the initial aerosol number concentration (see Table 1) minus the 8% of particles that already acted as
10
ice nuclei. Here we neglect the fact that the size distribution parameters of the dust aerosol should change with ongoing ice nucleation because the larger particles with larger surface areas nucleate first. From the results listed in Table2we get mean val-ues of about 3×106 cm−2s−1 and 5×106 cm−2s−1 for the runs with ATD at 223 K and 210 K, respectively. The nucleation rates are smaller by a factor of 5 to 10 for the Asian
15
and Saharan desert dusts. As mentioned above, this difference cannot be explained by a size effect, because the different aerosols showed similar size distributions and surface area concentrations.
It is important to note that the nucleation rates estimated above only apply for the conditions of our experiments, i.e. a mixture of dust particles with diameters mainly
20
between about 0.1 and 1 µm and a steady increase of Si at different rates given in Ta-ble2. As already discussed in Sect.3.1the formation rate of ice crystals and therefore the nucleation rate approaches zero as soon as Si reaches its maximum value, even if a significant fraction of the dust particles have not yet formed an ice crystal.
4 Conclusions
25
In three series of AIDA aerosol chamber experiments at cirrus temperatures between 196 and 223 K we investigated the deposition mode ice nucleation efficiency of
so-ACPD
6, 1539–1577, 2006 Ice nucleation on mineral dust O. M ¨ohler et al. Title Page Abstract Introduction Conclusions References Tables Figures J I J I Back CloseFull Screen / Esc
Printer-friendly Version
Interactive Discussion
EGU called Arizona Test Dust as reference aerosol and two desert dust samples from Asia
(AD1) and the Sahara (SD2). The latter two may be more typical for dust particles found in the atmosphere. The aerosols were generated by dry dispersion of the dust sam-ples and inertial removal of particles with diameters larger than about 2 µm. The size distributions of the dust aerosols could be approximated by lognormal fits with mode
5
diameters of about 0.3 µm to 0.5 µm and geometric standard deviations of about 1.6 to 1.9. During the cloud chamber experiments, different rates of cooling and increase of ice saturation ratio where achieved by controlled pumping. In 12 experiments with different initial temperatures and aerosol number concentrations the fraction fi of ice particles, i.e. ice activated aerosol particles, to the total particle (aerosol plus ice)
num-10
ber concentration was measured as a function of the increasing ice saturation ratio. All three mineral dust aerosol samples contained significant numbers of very efficient deposition ice nuclei. Heterogeneous ice nucleation already started at ice saturation ratios Si below 1.2, in most cases below 1.1. The ATD sample was most active with activated fractions of about 0.6 and 0.8 at Si<1.15 and temperatures of 223 and 209 K, 15
respectively (see alsoM ¨ohler et al.,2005b, andMangold et al.,2005). The desert dust samples SD2 and AD1 showed a significantly lower fraction of deposition nuclei, about 0.25 at 223 K and Si<1.35. Archuleta et al.(2005) investigated the ice nucleation of re-suspended and size segregated particles from another Asian dust sample. At 223 K, only 1% of particles with a diameter of 0.2 µm acted as ice nuclei. In the same study,
20
smaller dust particles showed an even higher ice saturation threshold for ice nucleation on the same fraction of particles. Because in our study most particles were larger than 0.2 µm, the higher fraction of ice active dust particles may be explained by the larger particle sizes. However, the difference in ice activity we observed between the ATD and desert dust samples can not be explained by a size effect, because the different
25
aerosols had similar size distribution. The more active ATD particles even tended to be slightly smaller. Therefore, the ice nucleation activity is also influenced by other particle properties like surface roughness or mineralogical composition. We can only speculate whether the higher activity of ATD is due to a higher surface roughness of the milled
ACPD
6, 1539–1577, 2006 Ice nucleation on mineral dust O. M ¨ohler et al. Title Page Abstract Introduction Conclusions References Tables Figures J I J I Back CloseFull Screen / Esc
Printer-friendly Version
Interactive Discussion
EGU particles or due to the different elemental and therefore also mineral composition (see
Table1).
There is evidence that for a given aerosol sample and initial temperature the ice activation spectrum, i.e. the relation between fi and Si, is almost independent of the cooling rate and the total aerosol number concentration. Furthermore, the formation of
5
new ice particles is always correlated with an increase of Si. The ice number fraction remains almost constant after Si reached its peak value. This may be explained by a given distribution of surface sites for deposition nucleation as function of Si which are activated almost immediately after the respective critical ice saturation ratios are exceeded. A narrow distribution results in a large value and a broad distribution in a low
10
value of d fi/d Si. Similar to the parameterisation suggested by Meyers et al.(1992) to predict the number of heterogeneous ice nuclei at higher temperatures, we suggest an exponential equation as function of Si to calculate the fraction of mineral particles acting as deposition nuclei. Our limited data set already shows that both the onset ice saturation S0 and the exponential factor a, that mainly determines the ice particle
15
formation rate, depend on temperature and the type of the dust aerosol (see Table2). Two series of three subsequent ice activation and evaporation cycles with ATD at initial temperatures of 223 and 210 K showed no significant change in the ice nucleation activity. For the desert dust samples a second ice nucleation mode appeared at Si between 1.35 and 1.5. The characteristics of this dual mode ice nucleation, which
20
became more obvious in subsequent expansion runs of the same desert dust aerosol, are discussed in more detail in a companion paper (Field et al.,2006).
Initial surface nucleation rates of 3×106 cm−2s−1, 2×105 cm−2s−1, and 5×105 cm−2s−1, were determined at about 223 K for ATD, SD2, and AD1, respec-tively. However, the formation rate of ice crystals and therefore the nucleation rate
25
dropped to markedly lower values as soon as Si reached its maximum value, even if a significant fraction of the dust particles have not yet formed an ice crystal. From this we conclude that the concept of surface nucleation rates may not be feasible to predict ice formation by deposition nucleation in complex mineral dust aerosols, at least under the
ACPD
6, 1539–1577, 2006 Ice nucleation on mineral dust O. M ¨ohler et al. Title Page Abstract Introduction Conclusions References Tables Figures J I J I Back CloseFull Screen / Esc
Printer-friendly Version
Interactive Discussion
EGU conditions of our experiments which are similar to cloud expansion at updraft velocities
of about 0.5 ms−1to 2 ms−1. Our experimental results indicate that a parameterisation of the ice active aerosol particle fraction as function of only the ice saturation ratio may be more appropriate for atmospheric models to calculate the ice formation rate. Fur-ther experiments and process modelling studies are needed to assess the influence of
5
temperature and particle properties on the respective ice activation spectra of mineral dust aerosols.
Acknowledgements. Continuous support by the AIDA staff members R. Buschbacher,
T. Chudy, M. Koyro, E. Kranz, G. Scheurig, and S. Vogt is gratefully acknowledged. We thank L. Sch ¨utz from the University Mainz, Germany, for providing the dust sample from the
10
Takla Makan desert in Asia, and K. Megahed for collecting the Saharan dust sample. We also thank C. Adelhelm from the Institute of Material Research (IMF I) of Forschungszentrum Karlsruhe for XRF analysis of mineral dust samples. The first author is grateful to the Na-tional Centre for Atmospheric Research (NCAR) in Boulder, Colorado, for financial support of a stay as visiting scientist which was partially used for data analysis and preparation of
15
this manuscript. This work contributed to the HGF (Hermann-von-Helmholtz-Gemeinschaft Deutscher Forschungszentren) project Particles and Cirrus Clouds (PAZI-II).
References
Archuleta, C. M., DeMott, P. J., and Kreidenweis, S. M.: Ice nucleation by surrogates for atmo-spheric mineral dust and mineral dust/sulfate particles at cirrus temperatures, Atmos. Chem.
20
Phys., 5, 2617–2634, 2005. 1541,1558,1560
Bailey, M. and Hallett, J.: Nucleation effects on the habit of vapour grown ice crystals from −18 to −42◦C, Quart. J. Royal Met. Soc., 128, 1461–1483, 2002. 1541
Benz, S., Megahed, K., M ¨ohler, O., Saathoff, H., Wagner, R., and Schurath, U.: T-dependent rate measurements of homogeneous ice nucleation in cloud droplets using
25
a large atmospheric simulation chamber, J. Photochem. Photobiol., A, 176, 208–217, doi:10.1016/j.jphotochem.2005.08.026, 2005. 1543
ACPD
6, 1539–1577, 2006 Ice nucleation on mineral dust O. M ¨ohler et al. Title Page Abstract Introduction Conclusions References Tables Figures J I J I Back CloseFull Screen / Esc
Printer-friendly Version
Interactive Discussion
EGU particle analyses of ice nucleating aerosols in the upper troposphere and lower stratosphere,
Geophys. Res. Lett., 25, 1391–1394, 1998. 1541
Cziczo, D. J., Murphy, D. M., Hudson, P. K., and Thomson, D. S.: Single particle measurements of the chemical composition of cirrus ice residue during CRYSTAL-FACE, J. Geophys. Res., 109, D04201, doi:10.1029/2003JD004032, 2004. 1541
5
DeMott, P. J., Rogers, D. C., Kreidenweis, S. M., Chen, Y. L., Twohy, C. H., Baumgardner, D., Heymsfield, A. J., and Chan, K. R.: The role of heterogeneous freezing nucleation in upper tropospheric clouds: Inferences from SUCCESS, Geophys. Res. Lett., 25, 1387–1390, 1998.
1542
DeMott, P. J., Sassen, K., Poellot, M. R., Baumgardner, D., Rogers, D. C., Brooks, S. D., Prenni,
10
A. J., and Kreidenweis, S. M.: African dust aerosols as atmospheric ice nuclei, Geophys. Res. Lett., 30, doi:10.1029/2003GL017410, 2003. 1541
Diehl, K. and Wurzler, S.: Heterogeneous drop freezing in the immersion mode: Model calcula-tions considering soluble and insoluble particles in the drops, J. Atmos. Sci., 61, 2063–2072, 2004. 1542
15
Ebert, V., Teichert, H., Giesemann, C., Saathoff, H., and Schurath, U.: Fibre-coupled in-situ laser absorption spectrometer for the selective detection of water vapour traces down to the ppb-level, Tech. Mess., 72, 23–30, 2005. 1547
Field, P. R., Cotton, R. J., Noone, K., Glantz, P., Kaye, P. H., Hirst, E., Greenaway, R. S., Jost, C., Gabriel, R., Reiner, T., Andreae, M., Saunders, C. P. R., Archer, A., Choularton, T.,
20
Smith, M., Brooks, B., Hoell, C., Bandy, B., Johnson, D., and Heymsfield, A.: Ice nucleation in orographic wave clouds: Measurements made during INTACC, Quart. J. Royal Met. Soc., 127, 1493–1512, 2001. 1541
Field, P. R., M ¨ohler, O., Connolly, P., Kr ¨amer, M., Cotton, R. J., Heymsfield, A. J., and Schnaiter, M.: Some ice nucleation characteristics of Asian and Saharan desert dust, Atmos. Chem.
25
Phys. Discuss., 6, 1509–1537, 2006. 1548,1551,1557,1561
Fletcher, N. H.: Physics of rain clouds, Cambridge University Press, 1962. 1542
Haag, W., K ¨archer, B., Str ¨om, J., Minikin, A., Lohmann, U., Ovarlez, J., and Stohl, A.: Freezing thresholds and cirrus cloud formation mechanisms inferred from in situ measurements of relative humidity, Atmos. Chem. Phys., 3, 1791–1806, 2003. 1541
30
Heintzenberg, J., Okada, K., and Str ¨om, J.: On the composition of non-volatile material in upper tropospheric aerosols and cirrus crystals, Atmos. Res., 41, 81–88, 1996. 1541
ACPD
6, 1539–1577, 2006 Ice nucleation on mineral dust O. M ¨ohler et al. Title Page Abstract Introduction Conclusions References Tables Figures J I J I Back CloseFull Screen / Esc
Printer-friendly Version
Interactive Discussion
EGU Water in Orographic Wave Clouds, J. Atmos. Sci., 50, 2335–2353, 1993. 1542
Hirst, E., Kaye, P. H., Greenaway, R. S., Field, P., and Johnson, D. W.: Discrimination of micrometre-sized ice and super-cooled droplets in mixed-phase cloud, Atmos. Environ., 35, 33–47, 2001. 1548
Hung, H.-M., Malinowski, S. T., and Martin, S. T.: Kinetics of heterogeneous ice nucleation
5
on the surfaces of mineral dust cores inserted into aqueous ammonium sulfate particles, J. Phys. Chem. A, 107, 1296–1306, 2003. 1541,1559
Jensen, E. J., Toon, O. B., Tabazadeh, A., Sachse, G. W., Anderson, B. E., Chan, K. R., Twohy, C. W., Gandrud, B., Aulenbach, S. M., Heymsfield, A., Hallett, J., and Gary, B.: Ice nucleation processes in upper tropospheric wave-clouds observed during SUCCESS, Geophys. Res.
10
Lett., 25, 1363–1366, 1998. 1541
K ¨archer, B. and Lohmann, U.: A Parameterization of cirrus cloud formation: Homo-geneous freezing including effects of aerosol size, J. Geophys. Res., 107, 4698, doi:10.1029/2001JD001429, 2002. 1542
K ¨archer, B. and Lohmann, U.: A parameterization of cirrus cloud formation: Heterogeneous
15
freezing, J. Geophys. Res., 108, 4402, doi:10.1029/2002JD003220, 2003. 1542
Koop, T., Luo, B. P., Tsias, A., and Peter, T.: Water activity as the determinant for homogeneous ice nucleation in aqueous solutions, Nature, 406, 611–614, 2000. 1542,1577
Lynch, D. K., Sassen, K., Starr, D. O., and Stephens, G., eds.: Cirrus, Oxford University Press, 2002. 1540
20
Mangold, A., Wagner, R., Saathoff, H., Schurath, U., Giesemann, C., Ebert, V., Kr¨amer, M., and M ¨ohler, O.: Experimental investigation of ice nucleation by different types of aerosols in the aerosol chamber AIDA: implications to microphysics of cirrus clouds, Meteorol. Z., 14, 485–497, 2005. 1549,1550,1554,1560
Meyers, M. P., Demott, P. J., and Cotton, W. R.: New Primary Ice-Nucleation Parameterizations
25
in an Explicit Cloud Model, J. Appl. Meteorol., 31, 708–721, 1992. 1542,1556,1561
Mishchenko, M. I. and Travis, L. D.: Capabilities and limitations of a current FORTRAN imple-mentation of the T-matrix method for randomly oriented, rotationally symmetric scatterers, J. Quant. Spectroscop. Radiat. Transfer, 60, 309–324, 1998. 1550
M ¨ohler, O., Stetzer, O., Schaefers, S., Linke, C., Schnaiter, M., Tiede, R., Saathoff, H., Kr¨amer,
30
M., Mangold, A., Budz, P., Zink, P., Schreiner, J., Mauersberger, K., Haag, W., K ¨archer, B., and Schurath, U.: Experimental investigation of homogeneous freezing of sulphuric acid particles in the aerosol chamber AIDA, Atmos. Chem. Phys., 3, 211–223, 2003. 1543
ACPD
6, 1539–1577, 2006 Ice nucleation on mineral dust O. M ¨ohler et al. Title Page Abstract Introduction Conclusions References Tables Figures J I J I Back CloseFull Screen / Esc
Printer-friendly Version
Interactive Discussion
EGU M ¨ohler, O., B ¨uttner, S., Linke, C., Schnaiter, M., Saathoff, H., Stetzer, O., Wagner, R.,
Kr ¨amer, M., Mangold, A., Ebert, V., and Schurath, U.: Effect of sulphuric acid coating on heterogeneous ice nucleation by soot aerosol particles, J. Geophys. Res., 110, D11210, doi:10.1029/2004JD005169, 2005a. 1543,1544,1547
M ¨ohler, O., Linke, C., Saathoff, H., Schnaiter, M., Wagner, R., Mangold, A., Kr¨amer, M., and
5
Schurath, U.: Ice nucleation on flame soot aerosol of different organic carbon content, Mete-orol. Z., 14, 477–484, 2005b. 1543,1560
Murphy, D. M. and Koop, T.: Review of the vapour pressures of ice and supercooled water for atmospheric applications, Quart. J. Royal Met. Soc., 131, 1539–1565, 2005. 1577
Pruppacher, H. R. and Klett, J. D.: Microphysics of clouds and precipitation, Kluwer Academic
10
Publishers, Dordrecht, The Netherlands, 1997. 1541,1542
Roberts, P. and Hallett, J.: A laboratory study of the ice nucleating properties of some mineral particulates, Quart. J. Royal Met. Soc., 94, 25–34, 1968. 1541
Sassen, K. and Dodd, G. C.: Homogeneous Nucleation Rate for Highly Supercooled Cirrus Cloud Droplets, J. Atmos. Sci., 45, 1357–1369, 1988. 1542
15
Sassen, K., DeMott, P. J., Prospero, J. M., and Poellot, M. R.: Saharan dust storms and in-direct aerosol effects on clouds: CRYSTAL-FACE results, Geophys. Res. Lett., 30, 1633, doi:10.1029/2003GL017371, 2003. 1541
Seifert, M., Strom, J., Krejci, R., Minikin, A., Petzold, A., Gayet, J. F., Schumann, U., and Ovar-lez, J.: In-situ observations of aerosol particles remaining from evaporated cirrus crystals:
20
Comparing clean and polluted air masses, Atmos. Chem. Phys., 3, 1037–1049, 2003. 1541
Seifert, M., Tiede, R., Schnaiter, M., Linke, C., M ¨ohler, O., Schurath, U., and Str ¨om, J.: Oper-ation and performance of a differential mobility particle sizer and a TSI 3010 condensation particle counter at stratospheric temperatures and pressures, J. Aerosol Sci., 35, 981–993, 2004. 1548
25
Str ¨om, J., Seifert, M., K ¨archer, B., Ovarlez, J., Minikin, A., Gayet, J. F., Krejci, R., Petzold, A., Auriol, F., Haag, W., Busen, R., Schumann, U., and Hansson, H. C.: Cirrus cloud occurrence as function of ambient relative humidity: a comparison of observations obtained during the INCA experiment, Atmos. Chem. Phys., 3, 1807–1816, 2003. 1541
Targino, A. C., Krejci, R., Noone, K. J., and Glantz, P.: Single particle analysis of ice crystal
30
residuals observed in orographic wave clouds over Scandinavia during INTACC experiment, Atmos. Chem. Phys. Discuss., 5, 8055–8090, 2005. 1541