HAL Id: hal-00295985
https://hal.archives-ouvertes.fr/hal-00295985
Submitted on 21 Jul 2006
HAL is a multi-disciplinary open access
archive for the deposit and dissemination of
sci-entific research documents, whether they are
pub-lished or not. The documents may come from
teaching and research institutions in France or
abroad, or from public or private research centers.
L’archive ouverte pluridisciplinaire HAL, est
destinée au dépôt et à la diffusion de documents
scientifiques de niveau recherche, publiés ou non,
émanant des établissements d’enseignement et de
recherche français ou étrangers, des laboratoires
publics ou privés.
mineral dust particles
O. Möhler, P. R. Field, P. Connolly, S. Benz, H. Saathoff, M. Schnaiter, R.
Wagner, R. Cotton, M. Krämer, A. Mangold, et al.
To cite this version:
O. Möhler, P. R. Field, P. Connolly, S. Benz, H. Saathoff, et al.. Efficiency of the deposition mode
ice nucleation on mineral dust particles. Atmospheric Chemistry and Physics, European Geosciences
Union, 2006, 6 (10), pp.3007-3021. �hal-00295985�
www.atmos-chem-phys.net/6/3007/2006/ © Author(s) 2006. This work is licensed under a Creative Commons License.
Chemistry
and Physics
Efficiency of the deposition mode ice nucleation on mineral dust
particles
O. M¨ohler1, P. R. Field2,*, P. Connolly3, S. Benz1, H. Saathoff1, M. Schnaiter1, R. Wagner1, R. Cotton2, M. Kr¨amer4, A. Mangold4,**, and A. J. Heymsfield5
1Institute for Meteorology and Climate Research, Forschungszentrum Karlsruhe, Germany 2Met Office, Exeter, UK
3School of Earth, Atmospheric and Environmental Sciences, University of Manchester, Manchester, UK 4Institut f¨ur Chemie und Dynamik der Geosph¨are (ICG-I), Forschungszentrum J¨ulich, Germany 5National Center for Atmospheric Research (NCAR), Boulder, CO, USA
*now at: National Center for Atmospheric Research (NCAR), Boulder, CO, USA **now at: Royal Meteorological Institute of Belgium, Brussels, Belgium
Received: 5 December 2005 – Published in Atmos. Chem. Phys. Discuss.: 23 February 2006 Revised: 29 May 2006 – Accepted: 19 June 2006 – Published: 21 July 2006
Abstract. The deposition mode ice nucleation efficiency of
various dust aerosols was investigated at cirrus cloud temper-atures between 196 and 223 K using the aerosol and cloud chamber facility AIDA (Aerosol Interaction and Dynamics in the Atmosphere). Arizona test dust (ATD) as a reference material and two dust samples from the Takla Makan desert in Asia (AD1) and the Sahara (SD2) were used for the ex-periments at simulated cloud conditions. The dust particle sizes were almost lognormally distributed with mode diam-eters between 0.3 and 0.5 µm and geometric standard devi-ations between 1.6 and 1.9. Deposition ice nucleation was most efficient on ATD particles with ice-active particle frac-tions of about 0.6 and 0.8 at an ice saturation ratio Si<1.15
and temperatures of 223 and 209 K, respectively. No signif-icant change of the ice nucleation efficiency was found in up to three subsequent cycles of ice activation and evapo-ration with the same ATD aerosol. This indicates that the phenomenon of preactivation does not apply to ATD parti-cles. The desert dust samples SD2 and AD1 showed a sig-nificantly lower fraction of active deposition nuclei, about 0.25 at 223 K and Si<1.35. For all samples the ice
acti-vated aerosol fraction could be approximated by an exponen-tial equation as function of Si. This indicates that deposition
ice nucleation on mineral particles may not be treated in the same stochastic sense as homogeneous freezing. The sug-gested formulation of ice activation spectra may be used to calculate the formation rate of ice crystals in models, if the number concentration of dust particles is known. More ex-perimental work is needed to quantify the variability of the
Correspondence to: O. M¨ohler
ice activation spectra as function of the temperature and dust particle properties.
1 Introduction
Whether cirrus clouds have a net cooling or heating effect on climate depends, among other factors, on the number con-centration, size, and habit of ice crystals and therefore on the cirrus formation mechanisms. It is known from numerous field and modelling studies that both homogeneous freezing of solution droplets and heterogeneous ice nucleation on the surface of insoluble aerosol particles contribute to the forma-tion of ice crystals in cirrus clouds (Lynch et al., 2002). Tra-jectory model analysis of aircraft measurements (Str¨om et al., 2003) suggested that in parts of the polluted northern hemi-sphere, cirrus clouds are formed via the heterogeneous path-way, but that homogeneous ice nucleation is also involved (Haag et al., 2003; Seifert et al., 2003). Aircraft studies of wave clouds also indicated the role of heterogeneous ice nu-cleation (DeMott et al., 1998; Jensen et al., 1998; Field et al., 2001) and of mineral particles as ice nuclei (Targino et al., 2006).
Specific surface properties of the heterogeneous ice nu-clei can markedly lower the ice supersaturation threshold for heterogeneous ice nucleation compared to homogeneous freezing (Pruppacher and Klett, 1997), thereby changing not only the frequency of occurrence but also the micro-physical and optical properties of cirrus clouds (K¨archer and Lohmann, 2003; Haag et al., 2003; Lohmann et al., 2004). Heintzenberg et al. (1996) found desert dust particles
probably originating from Saharan source regions to domi-nate the composition of non-volatile residuals of ice crystals in cirrus over the Alps. Chen et al. (1998) found enhanced number fractions of crustal particles, besides carbonaceous and metallic particles, in the population of ice nuclei mea-sured over Northern America. More recently, the role of desert dust particles as ice nuclei was demonstrated by sev-eral aircraft-based studies of a Saharan dust plume event over Florida (DeMott et al., 2003; Sassen et al., 2003; Cz-iczo et al., 2004). Twohy and Poellot (2005) investigated the nature of ice residual particles in anvil cirrus at tempera-tures between −21◦C and −56◦C. Crustal components were found, among other insoluble particles, especially at higher temperatures, whereas more soluble salt and sulphates were present at lower temperatures.
According to Vali (1985), the deposition mode ice nucle-ation is defined as the formnucle-ation of ice from a supersaturated vapour environment directly onto a solid surface, whereas immersion freezing is induced by a nucleus suspended in a supercooled water droplet. It is also common to refer to ice nucleation of a nucleus immersed in a supercooled solution as immersion freezing. Mineral surfaces are known to effec-tively initiate ice formation both in the immersion freezing and deposition nucleation mode (Roberts and Hallett, 1968; Pruppacher and Klett, 1997; Zuberi et al., 2002; Bailey and Hallett, 2002). Hung et al. (2003) found that the heteroge-neous ice nucleation rates of ammonium sulphate solution droplets with a mineral dust core depend, beside tempera-ture and ice supersaturation, on the size of the immersed mineral particle. Archuleta et al. (2005) recently reported size-dependent ice nucleation efficiencies of aluminium ox-ide, alumina-silicate, and iron oxide particles as well as a desert dust sample from Asia.
In contrast to homogeneous freezing rates of solution droplets, which can be parameterised in numerical models mainly as function of the temperature, relative humidity, and aerosol parameters (Sassen and Dodd, 1988; Heymsfield and Miloshevich, 1993; Koop et al., 2000; K¨archer and Lohmann, 2002), microphysically based parameterisations for hetero-geneous ice nucleation processes are more difficult to assess. Up to now, most models rely on empirical relations for the number concentrations of ice nuclei as functions of the tem-perature and/or ice saturation ratio (Fletcher, 1962; Meyers et al., 1992). Stochastic models have been developed to cal-culate the nucleation rates of supercooled water in contact with solid surfaces (Pruppacher and Klett, 1997). A new con-cept has been suggested to calculate heterogeneous freezing rates with modified stochastic nucleation rate equations as function of aerosol properties (K¨archer and Lohmann, 2003). In contrast to stochastic nucleation rates, concepts of instan-taneous ice nucleation according to measured freezing nuclei spectra have been applied in models of heterogeneous ice nu-cleation above (Diehl and Wurzler, 2004) and below the ho-mogeneous freezing temperature of pure water droplets (De-Mott et al., 1998) .
The heterogeneous ice nucleation of various dust samples was comprehensively investigated in several series of experi-ments using the AIDA aerosol and cloud chamber facility. In this paper we describe the experimental methods and discuss results of experiments with dry mineral dust aerosols, mainly so-called Arizona test dust, at temperatures between 224 K and 196 K. Results from similar experiments with desert dust samples from Africa and Asia are discussed in more detail in a companion paper by Field et al. (2006).
2 Experimental methods
2.1 Description of AIDA cloud chamber
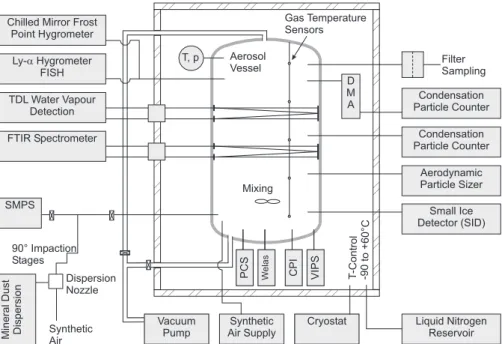
Figure 1 schematically shows the setup and instrumen-tation of the aerosol and cloud chamber facility AIDA (Aerosol Interaction and Dynamics in the Atmosphere) of Forschungszentrum Karlsruhe, which was used for the ice nucleation studies. The facility can be operated as an expan-sion cloud chamber to investigate microphysical processes at simulated cloud conditions. Respective experimental meth-ods have been described previously (M¨ohler et al., 2003, 2005a,b; Benz et al., 2005) and are only briefly summarised here. The facility mainly consists of a cylindrical aerosol ves-sel encased in a large, thermally insulated box and connected to a vacuum and air supply system. The aerosol vessel (4 m diameter, 84 m3volume) can be evacuated to a pressure be-low 0.1 hPa and filled with particle free synthetic air to start any experiment with clean conditions with an aerosol back-ground concentration of less than 0.1 cm−3.
The interior of the thermally insulated box can be cooled by air ventilation to any temperature down to 183 K. Cooling rates are limited by the air ventilation and cooling system to about 5 K h−1. Strong cooling or heating causes larger tem-perature gradients inside the box and is therefore achieved by automatic control during the night when no expansion ex-periments take place. The exex-periments discussed here are not performed during such strong temperature change condi-tions but by running the chamber at a constant temperature during each day of experiments. During constant tempera-ture control, the temporal and spatial temperatempera-ture variability is less than ±0.3 K throughout the entire box. The interior of the aerosol vessel is additionally stirred with a mixing fan which is located in the bottom part of the aerosol vessel. Un-der stirred conditions, the temperature variability inside the aerosol vessel is less than ±0.2 K. Gas and wall temperatures are measured with an accuracy of ±0.3 K.
2.2 Simulation of cloud expansion
Before starting ice nucleation experiments, the cloud cham-ber is typically cooled to a temperature of about 268 K and filled with humidified air with a frost point temperature of at least 263 K. During slow cooling, the excess water vapour forms a frost layer on the chamber walls. The frost layer
Chilled Mirror Frost Point Hygrometer T -C o n tr o l -9 0 to +6 0 °C Aerosol Vessel T, p Vacuum Pump MineralDust Dispersion SMPS Ly- Hygrometer FISH a TDL Water Vapour Detection FTIR Spectrometer Filter Sampling Condensation Particle Counter Aerodynamic Particle Sizer Cryostat Synthetic Air Supply Gas Temperature Sensors Liquid Nitrogen Reservoir Condensation Particle Counter D M A Dispersion Nozzle Synthetic Air 90° Impaction Stages
PCS Welas CPI VIPS
Mixing
Small Ice Detector (SID)
Fig. 1. Schematic of the AIDA (Aerosol Interaction and Dynamics in the Atmosphere) cloud simulation chamber with instrumentation for
heterogeneous ice nucleation studies of mineral dust aerosols.
maintains almost ice saturated conditions at lower temper-atures. After reaching conditions of uniform temperature (within ±0.2 K) and relative humidity (within ±3%) inside the aerosol vessel, the aerosol to be studied is added (see Sect. 2.3) and the first ice activation experiment is started. Ice supersaturated conditions are achieved by controlled pump-ing, typically from 1000 to 800 hPa. After pumping starts, the gas temperature Tgdrops almost adiabatically due to
vol-ume expansion. Because the wall temperature Tw remains
almost constant during expansion, there is a heat flux from the warmer walls to the volume, which increases with in-creasing Tw−Tg. Therefore, Tg deviates from the adiabatic
profile and approaches an almost constant steady state value after about 15 to 20 min of pumping at a constant rate of pres-sure change. The mixing fan maintains homogeneous tem-perature and humidity conditions inside the aerosol cham-ber. Even during strong pumping expansion and cooling, the spatial and short-term temperature variability is less than ±0.3 K, except for a few centimetre thick transition layer to the vessel walls.
With initially almost ice saturated conditions, ice satura-tion is exceeded shortly after pumping starts. The ice satu-ration ratio Si=ew/es,i increases due to the fact that the
wa-ter vapour saturation pressure with respect to ice, es,i,
expo-nentially decreases with decreasing Tg, whereas the actual
water vapour pressure, ew, only linearly decreases with
de-creasing pressure during pumping. With the highest pump-ing speed, maximum initial coolpump-ing rates of about 4 K min−1 can be achieved in the AIDA chamber. This corresponds to the cooling rate of an adiabatically expanding air parcel
as-cending in the upper troposphere at an updraft speed of about 6 m s−1. During the simulation runs, S
i typically increases at
a rate of about 0.1 to 0.5 min−1(M¨ohler et al., 2005a).
2.3 Origin, preparation, and characterisation of dust sam-ples
Three mineral dust samples were used, namely two desert dust samples from Asia (AD1) and the Sahara (SD2) and so-called Arizona test dust (ATD). The sample AD1 which was provided by the University of Mainz, Germany, was collected from the ground in the easterly parts of the Takla Makan Desert in China, east of the Dalimu Basin between Kuerle and Ruoquiang. The Saharan dust SD2 is also a surface sam-ple, which was collected about 50 km north of Cairo city, Egypt. Both desert samples were stored and transported in clean bottles to avoid contamination. The ATD sample was selected because it is available from Powder Technology Inc. (Minnesota, USA) as a reference material, which can be used in other labs for comparison of results and methods of ice nucleation. According to the manufacturer, ATD is produced by (1) grinding samples of sand from Arizona in a stainless steel ball mill, (2) separating the fine particle size fractions by elutriation in water, (3) drying the coarse material in an oven, (4) remilling and separating the dried sample into four distinct size classes, and (5) blending the four milling frac-tions to get a sample of the desired particle size distribution. We used a sample with a nominal 0–3 µm particle diameter size range (batch No. 130300).
The elemental composition of each sample was analysed by X-ray fluorescence analysis (XRF, SRS 303AS, Bruker
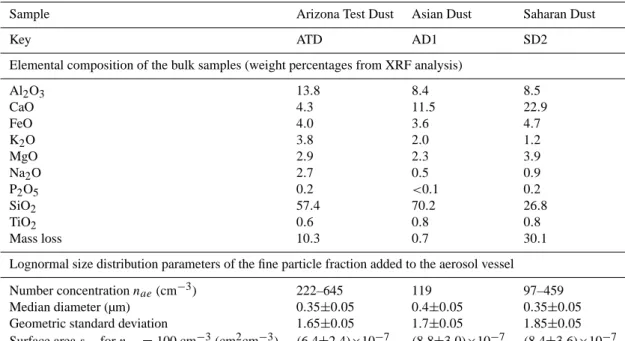
Table 1. Origin and properties of mineral dust samples.
Sample Arizona Test Dust Asian Dust Saharan Dust
Key ATD AD1 SD2
Elemental composition of the bulk samples (weight percentages from XRF analysis)
Al2O3 13.8 8.4 8.5 CaO 4.3 11.5 22.9 FeO 4.0 3.6 4.7 K2O 3.8 2.0 1.2 MgO 2.9 2.3 3.9 Na2O 2.7 0.5 0.9 P2O5 0.2 <0.1 0.2 SiO2 57.4 70.2 26.8 TiO2 0.6 0.8 0.8 Mass loss 10.3 0.7 30.1
Lognormal size distribution parameters of the fine particle fraction added to the aerosol vessel
Number concentration nae(cm−3) 222–645 119 97–459
Median diameter (µm) 0.35±0.05 0.4±0.05 0.35±0.05
Geometric standard deviation 1.65±0.05 1.7±0.05 1.85±0.05 Surface area saefor nae=100 cm−3(cm2cm−3) (6.4±2.4)×10−7 (8.8±3.0)×10−7 (8.4±3.6)×10−7
AXS). Amounts of 200 mg were taken from the ATD sam-ple and from sieve fractions of AD1 and SD2 with particles smaller than 20 µm in diameter. The 200 mg dust samples were tempered for one hour at 1000◦C prior to the analysis. The results listed in Table 1 are weight percentages of respec-tive oxides. Silicon, aluminium, and calcium oxides are most abundant in all samples. ATD shows relatively large amounts of aluminium, AD1 of silicon, and SD2 of calcium oxides. The XRF analysis of ATD agrees with the composition given by the manufacturer except for the SiO2mass fraction, which was about 5% below the range given by the manufacturer. In general, only limited information about the mineral compo-sition can be derived from the bulk elemental analysis of dust samples. The presence of large amounts of SiO2and Al2O3 indicate the presence of layer silicates. All dust samples used in the present studies showed larger fractions of SiO2which indicates the presence of quartz particles. Minor abundance of kaolinite is also likely.
It should be noted that these are results of a bulk anal-ysis with particles up to 20 µm in diameter for the sam-ples AD1 and SD2. The mineral composition will certainly change from particle to particle and probably also with par-ticle diameter. In the latter case, the bulk analysis may not be representative of the aerosol used in our experiments be-cause it is dominated by particles larger than 2 µm, while the aerosol sample used in the experiments was smaller than 2 µm. Aerosol particles smaller than 2 µm in diameter were selected in the following way: First, the mechanically sieved fraction of particles smaller than 70 µm was roughly dis-persed with a rotating brush disperser (RGB 1000, Palas). The ATD sample was not sieved prior to dispersion because it
contained only particles smaller than 3 µm in diameter. Sec-ond, the finest particles were de-agglomerated in an aerosol dispersion nozzle. Third, particles larger than about 2 µm in diameter were removed in a series of four 90◦ inertial im-pactor stages with a 50% cut-off diameter of about 1.5 µm. Both, the brush disperser and the dispersion nozzle were op-erated with dry and particle-free synthetic air to avoid con-tamination of the dust aerosol with particles of unknown ori-gin. The dispersion pressure of the nozzle was 1.5 bar. Af-ter passing the impactor stages the aerosol flow was directly added to the AIDA cloud chamber.
Figure 2 shows typical number size distributions of the three dust types ATD, AD1, and SD2 sampled from the AIDA aerosol chamber. The size distributions were mea-sured with a scanning mobility particle sizer (SMPS, TSI) and an aerodynamic particle spectrometer (APS, TSI). A bulk density of 2.6 g cm−3 and a dynamic shape factor of 1.5 were used to convert the aerodynamic diameter measured with the APS into a mobility-equivalent diameter for com-parison with the SMPS data. The measured size distributions have been approximated by a lognormal fit with a median di-ameter of 0.35, 0.40, and 0.35 µm and a geometric standard deviation of 1.65, 1.70, and 1.85 for ATD, AD1, and SD2, respectively. At diameters below about 0.2 µm the SMPS overestimates the number concentrations due to incomplete charge correction of multiply charged particles with diame-ters larger than 0.8 µm, the upper mobility size range limit of the SMPS system.
The ranges of lognormal fit parameters for all mineral dust size distributions measured during the experiments discussed in this paper are given in Table 1. The respective surface areas sae have been normalized to a number concentration
nae=100 cm−3. These surface areas will be used in Sect. 3.3
to estimate surface nucleation rates. Please note that we as-sumed spherical particle shapes to calculate sae. Electron
mi-crographs showed the mineral particles to have irregular and partly aggregate-like structures. Therefore, the actual sur-face area of the dust aerosols may be somewhat higher than given in Table 1. We were not able to quantify this structure dependent enhancement of surface area.
2.4 Water vapour and ice saturation measurements
The concentration of total water (gas and condensed phase) was measured with a fast scanning chilled mirror hygrom-eter (LX-373, MBW) and the Ly-α hygromhygrom-eter FISH of Forschungszentrum J¨ulich (Z¨oger et al., 1999). Both instru-ments are located outside the cold box and take their sample flow through a stainless steel tube. All ice particles com-pletely evaporate after entering the tube which is heated to 30◦C. The MBW chilled mirror instrument served as an ac-curate reference for the water vapour concentration if no ice particles were present in the aerosol vessel. Advantages of the FISH instrument are a higher sensitivity and time resolu-tion. Both sampling instruments may underestimate the total water concentrations if large ice crystals are sampled at less than 100% efficiency into the horizontal sampling tube. This artifact does not affect the conclusions of this paper.
The water vapour pressure ew is directly measured in
situ with a tunable diode laser (TDL) absorption spectrom-eter. The TDL system is based on a room temperature near-infrared tunable diode laser at 1370±2 nm and an 82 m White multi-path cell (Ebert et al., 2005; M¨ohler et al., 2005a). The water vapour pressure ewis measured with a time resolution
of 1 s. Systematic errors, e.g. due to uncertainties of absorp-tion line parameters taken from the literature, were elimi-nated by scaling the TDL data set to the chilled mirror data with a constant factor of up to 1.3, depending on the water absorption line used for the TDL scans. The MBW chilled mirror instrument measures the frost point temperature with an accuracy of ±0.1 K. Therefore, the uncertainty of ewfrom
TDL, after scaling, is only ±1.3% at 220 K and ±1.7% at 190 K.
The mean gas temperature is measured with an accuracy of ±0.3 K, resulting in an uncertainty for es,iof ±3.9% at 220 K
and ±5.2% at 190 K. Time series of the mean ice saturation ratio Si in the well-mixed chamber volume are obtained at a
time resolution of 1 s from the ratio of ew and the ice
satu-ration pressure es,i as function of the mean gas temperature
Tg. The latter is calculated as an average of measurements
with four carefully calibrated thermocouples oriented along a vertical line located about 1 m from the center of the aerosol vessel. With the uncertainty of the water vapour data given
1 10 100 dN/dlog d (cm ) -3 1 10 100 dN/dlog d (cm ) -3 0.1 1.0 Particle Diameter ( m)µ 1 10 100 dN /d lo g d (c m ) -3 ATD AD1 SD2
Fig. 2. Typical aerosol size distributions of Arizona test dust (ATD), Asian Dust (AD1), and Saharan dust (SD2) after dispersion and addition to the AIDA aerosol vessel.
above and the uncertainty of ±0.3 K for Tg we obtain an
overall uncertainty for Si measurements of ±4% at 220 K
and ±6% at 190 K.
2.5 Aerosol and ice particle measurements
The total aerosol number concentration nae was measured
with a condensation particle counter (CPC3010, TSI), which has been modified and calibrated for sampling at reduced pressures between 1000 and 100 hPa (Seifert et al., 2004). Aerosol particles with diameters up to about 2 µm were sampled at 100 % efficiency through a horizontally oriented stainless steel tube. Diffusional loss of particles in the sam-pling tube can be neglected because only a minor fraction of the particles is smaller than 100 nm in diameter (see Fig. 2). The sampling tube is about 2 m long and has an inner diam-eter of 4 mm. About one half of the tube is located inside the aerosol vessel and the cold box. Therefore, small ice
particles that form in the chamber during pumping expan-sion runs can pass this cold tube section and evaporate in the second part of the sampling tube at room temperature. The CPC then measures the sum of the interstitial aerosol and the residuals from smaller ice particles that do not settle out in the cold tube section. Because the size dependent ice parti-cle loss in the sampling tube cannot quantitatively be deter-mined, the contributions of aerosol particles and ice residuals to the reading of the CPC cannot quantitatively be ruled out if a significant fraction of the aerosol particles acted as ice nuclei.
During pumping expansion, the total particle concentra-tion np=nae+nice, i.e. the sum of the interstitial aerosol
and the ice particles or ice nuclei, can be calculated as np=nae(t0)×(p/p(t0)). This equation describes the
pump-ing dilution of the initial aerosol concentration nae(t0)where
t0denotes the time when pumping starts. It follows that the fraction fi of ice activated aerosol, which will be discussed
in Sect. 3, is obtained from
fi = nice np = nicep(t0) nae(t0) p (1)
The number concentration nice of ice particles is measured with two optical particle counters (PCS2000 and Welas, Palas GmbH, Germany) and the so-called small ice detector SID, which was developed by the University of Hertfordshire for aircraft-based cloud studies (Hirst et al., 2001). A techni-cal description of the SID probe and its application to AIDA ice nucleation studies is given by Field et al. (2006). Most of the results discussed in the present paper rely on measure-ments with the PCS2000 instrument, hereafter termed OPC-PCS. The OPC-PCS measures, at 90±12◦scattering angle,
the intensity of white light scattered by single particles. The particle number concentration nPCS can be calculated from the single particle count rate and the sample flow through the optical detection volume. The latter is calibrated with an aerosol of known number concentration.
The OPC-PCS is not only sensitive to ice particles but also to dust aerosol particles, depending on their size and refrac-tive index. Dust particles have refracrefrac-tive indices typically larger than 1.5 and are therefore detected with the OPC-PCS if larger than about 0.5 µm in diameter. According to the aerosol size distributions shown in Fig. 2, the OPC-PCS de-tects a smaller amount of the total dust aerosol. Ice parti-cles have a relatively low refractive index of 1.32 and are therefore detected only if larger than about 0.8 µm in diam-eter. Because there is an overlapping size range for aerosol and ice particles detected with the OPC-PCS, the ice parti-cle number concentration is not directly obtained from these measurements. During an expansion experiment, it can be calculated from the relative increase of the OPC-PCS number concentration which is caused by the growth of ice crystals to sizes above the detection threshold. Hygroscopic growth of dust particles can be neglected under the conditions of the experiments discussed here. Ion chromatographic analysis
showed that the soluble mass fraction of the dust samples ATD, AD1 and SD2 was below 1%. Furthermore, experi-ments at room temperature (Gustafsson et al., 2005) revealed the hygroscopic growth factors of ATD particles to be less than 1.05 for relative humidities up to 75% . From this we conclude that any increase of nPCS can be attributed to pris-tine ice crystals with d>0.8 µm. Taking into account pump-ing dilution, the ice number concentration is estimated as
nice≈nPCS−nPCS(t0) p
p(t0) (2)
In addition, the total number concentration nPCSgives an upper estimate for nice. The ice particle detection is delayed by the growth time of pristine deposition ice germs to ice crystals of a detectable size d>0.8 µm. During this growth, the ice particles pass the transition regime from kinetically controlled growth to diffusion growth. A molecular accom-modation coefficient of 0.5 was used to calculate the growth rate in the kinetic regime. For the transition regime to dif-fusion growth we used a formulation suggested by Dahneke (1983). Latent heat terms are not included because they have only a minor impact on the growth rate under the conditions of our experiments. Respective growth times are 4 s at 223 K, 8 s at 210 K, and 50 s at 196 K. This delay of ice particle de-tection with the OPC is considered in the analysis of the ice activation spectra discussed in Sect. 3.
Ice particle number concentrations were also retrieved from Fourier Transform Infrared (FTIR) extinction spectra as described by Mangold et al. (2005). The extinction spectra were measured in situ with a White-type multiple reflection cell with a horizontal optical path of up to 254.3 m (Wag-ner et al., 2005). Spectra are recorded with a FTIR spec-trometer (IFS 66v, Bruker) in the wave number range 800 to 6000 cm−1, at a resolution of 4 cm−1, and at a rate of 3 spec-tra per minute. T-matrix calculations using the code for ran-domly oriented circular cylinders (Mishchenko and Travis, 1998) were performed to fit the measured extinction spec-tra of the ice particles. In our previous study (Mangold et al., 2005) the aspherical ice particles were represented in the cal-culations by cylinders with a fixed aspect ratio D/L=0.7, where D is the diameter and L the length of the cylinder. In the present work, aspect ratios ranging from 0.5 to 3.0 were employed to examine more thoroughly the effect of particle asphericity on the retrieval results. The deduced ice particle number concentrations and ice particle fractions discussed in Sect. 3 together with the OPC data represent averaged fit re-sults over the specified range of aspect ratios. The details of this approach, as well as a systematic comparison of the ice particle number concentrations measured with the OPC-PCS, OPC-Welas, and SID instruments and those retrieved from the FTIR extinction spectra, are discussed in more de-tail by Wagner et al. (2006).
In this paper, we discuss ice nucleation results from three distinct series of ice nucleation experiments hereafter termed IN02, IN03, and IN04 (see Sect. 2.6 and Table 2). FTIR
0 100 200 300 400 500 PCS nice (cm −3) 0 100 200 300 400 500 Welas n ice (cm − 3)
AIDA Experiment: IN03_05, Aerosol: ATD
Fig. 3. Comparison of ice particle concentrations measured with the optical particle counters Welas and PCS2000.
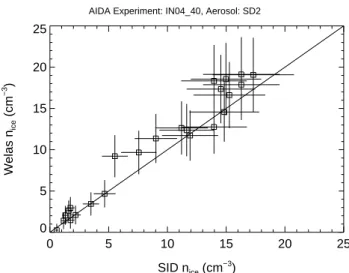
measurements were performed during all experiments. The OPC-PCS was available only during IN02 and IN03. The op-tical particle counter Welas (OPC-Welas), an improved ver-sion of the OPC-PCS, was used during IN03 and IN04. The optical setup of the OPC-Welas is similar to the OPC-PCS. A major advantage of the OPC-Welas is a separate optics block, which is connected with optical fibres to the lamp and photomultiplier unit. The small optical sensor can be oper-ated at the same temperature as the aerosol chamber without additional heaters and with only a very short sampling tube. Therefore the risk of ice particle sampling losses and evap-oration is markedly reduced. Only during IN03, both OPCs were available for simultaneous measurements and intercom-parison. Both probes were mounted below the cloud cham-ber to vertical sampling tubes of about 1 m length and 8 mm inner diameter. From the OPC-Welas, data sets of nicewere obtained in the same way as for the OPC-PCS sensor (see Eq. 2). The OPC-Welas is also sensitive to ice particles with d>0.8 µm. Figure 3 shows, for experiment IN03 5, a typi-cal scatter plot of the OPC-PCS and the OPC-Welas data set. The error bars include both counting errors and an estimated uncertainty of ±10% for the conversion of the count rate into a number concentation. The major contribution to the latter comes from the uncertainty of the flow velocity through the optical detection volume. The counting efficiency was inde-pendently determined by comparison to measurements with a condensation particle counter. The data set in Fig. 3 in-dicates good agreement between both OPCs within the esti-mated range of uncertainty. In addition to the OPC-Welas the small ice detector SID was available during IN04 for mea-surements of the ice particle number concentration. The un-certainty of SID ice particle concentrations is about ±20%. As shown in Fig. 4 there is also good agreement between ice particle number concentrations measured with the OPC-Welas and the SID probe.
0 5 10 15 20 25 SID nice (cm −3 ) 0 5 10 15 20 25 Welas n ice (cm − 3 )
AIDA Experiment: IN04_40, Aerosol: SD2
Fig. 4. Comparison of ice particle concentrations measured with the optical particle counter Welas and the small ice detector SID.
2.6 Experimental parameters
As explained in Sect. 2.2 an AIDA cloud expansion run is started at homogeneous temperature and pressure conditions. The initial pressure p, gas temperature Tg, and aerosol
num-ber concentration nae are listed in Table 2 for all runs
dis-cussed in this paper. The experiments were carried out in three series of AIDA ice nucleation studies (IN02, IN03, and IN04). All runs were started at an initial pressure p(t0)close to 1000 hPa and an ice saturation ratio of about 0.95 (not shown in the table). Initial temperatures Tg(t0)ranged from 196.4 to 223.5 K and the aerosol number concentrations from about 100 to 650 cm−3. In this paper we mainly focus on the deposition ice nucleation efficiency of the freshly dispersed mineral dust samples ATD, AD1, and SD2. Two series of experiments with ATD and initial temperatures of 223 K (IN02 147 to IN02 149) and 210 K (IN03 05 to IN03 07) investigated the ice nucleation of the same dust aerosol in subsequent ice activation and evaporation cycles. The ice nucleation efficiency of freshly dispersed Saharan dust SD2 was investigated in the same temperature range as ATD. Only one experiment with AD1 has been carried out with an ini-tial Tgof 222 K. The characteristics of ice nucleation on the
desert dust samples AD1 and SD2 in subsequent activation and evaporation cycles are discussed in more detail by Field et al. (2006).
Also listed in Table 2 are parameters of an exponential fit to the ice activation spectra, which will be discussed in Sect. 3.2 in terms of the fraction fi of ice activated aerosol
particles as function of Si. The threshold data for fi>0.08
and the fimeasured at the peak ice saturation ratio will also
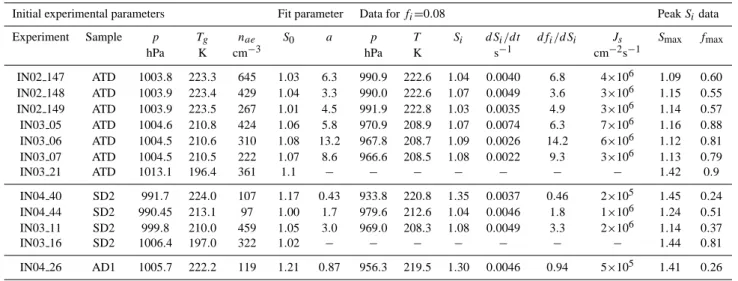
Table 2. Parameters of AIDA experiments and measured nucleation rates J .
Initial experimental parameters Fit parameter Data for fi=0.08 Peak Sidata
Experiment Sample p Tg nae S0 a p T Si dSi/dt dfi/dSi Js Smax fmax
hPa K cm−3 hPa K s−1 cm−2s−1 IN02 147 ATD 1003.8 223.3 645 1.03 6.3 990.9 222.6 1.04 0.0040 6.8 4×10⁶ 1.09 0.60 IN02 148 ATD 1003.9 223.4 429 1.04 3.3 990.0 222.6 1.07 0.0049 3.6 3×10⁶ 1.15 0.55 IN02 149 ATD 1003.9 223.5 267 1.01 4.5 991.9 222.8 1.03 0.0035 4.9 3×10⁶ 1.14 0.57 IN03 05 ATD 1004.6 210.8 424 1.06 5.8 970.9 208.9 1.07 0.0074 6.3 7×10⁶ 1.16 0.88 IN03 06 ATD 1004.5 210.6 310 1.08 13.2 967.8 208.7 1.09 0.0026 14.2 6×10⁶ 1.12 0.81 IN03 07 ATD 1004.5 210.5 222 1.07 8.6 966.6 208.5 1.08 0.0022 9.3 3×10⁶ 1.13 0.79 IN03 21 ATD 1013.1 196.4 361 1.1 − − − − − − − 1.42 0.9 IN04 40 SD2 991.7 224.0 107 1.17 0.43 933.8 220.8 1.35 0.0037 0.46 2×10⁵ 1.45 0.24 IN04 44 SD2 990.45 213.1 97 1.00 1.7 979.6 212.6 1.04 0.0046 1.8 1×10⁶ 1.24 0.51 IN03 11 SD2 999.8 210.0 459 1.05 3.0 969.0 208.3 1.08 0.0049 3.3 2×10⁶ 1.14 0.37 IN03 16 SD2 1006.4 197.0 322 1.02 − − − − − − − 1.44 0.81 IN04 26 AD1 1005.7 222.2 119 1.21 0.87 956.3 219.5 1.30 0.0046 0.94 5×10⁵ 1.41 0.26
3 Results and discussion
3.1 Time series
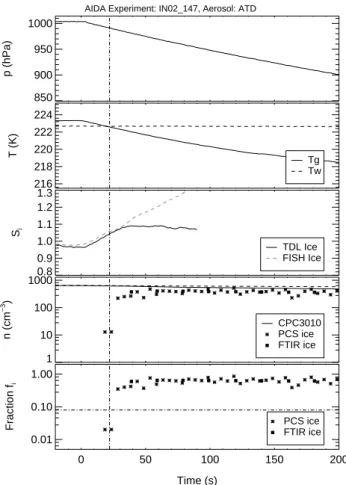
Figures 5 and 6 show time series of data sets from the expan-sion runs IN02 147 and IN03 05 with initial temperatures of 223.3 K and 210.8 K, respectively. Similar data sets have been obtained for all experiments listed in Table 2. The time is given in seconds relative to the time t0when the pumping started. Only the first 200 s of pumping to 800 hPa are con-sidered here. The pressure drop due to pumping is shown in panel 1. Panel 2 depicts the almost constant wall tempera-ture Tw(dashed line) and the gas temperature Tg(solid line),
which decreases due to expansion cooling during pumping. As mentioned above, the cooling rate is greatest when the pumping starts and slightly decreases with time due to an in-creasing heat flux from the warmer vessel walls.
With cooling of the well-mixed chamber volume, the ice saturation (panel 3) calculated as the ratio of the actual water vapour pressure from the TDL instrument and the ice sat-uration pressure with respect to Tg starts to increase from
an initial value of about 0.95 during experiment IN02 147 and 0.82 during experiment IN03 05. The lower initial value during experiment IN03 05 is due to the fact that the wall ice layer was almost consumed from previous ice nucle-ation runs. The ice layer is diminished run by run because the evacuated aerosol vessel is replenished with dry syn-thetic air. Nevertheless, the initial relative humidity was high enough to exceed the threshold humidity for ice nucleation after short time of pumping expansion. During both experi-ments the TDL spectrometer accurately measured the water vapour pressure from the start of pumping until about 50 s after the maximum ice saturation ratio was reached. There-after, the data are omitted in the figures because the noise on the TDL signal increased by a factor of 5 to 10 due
to mechanical vibrations from the pumping system. The dashed line in panel 3 shows the ice saturation ratio calcu-lated from the total water concentration, which was measured with the Ly-α hygrometer FISH during experiment IN02 147 and the chilled-mirror hygrometer MBW during experiment IN03 05. There is good agreement between the total and gas-phase water data until the onset of ice nucleation. Later on, the increasing difference between both data sets indicates the increasing water content of the growing ice particles.
Panel 4 of Figs. 5 and 6 shows measured number concen-trations of aerosol (nae) and ice particles (nice). The solid line depicts nae directly measured with the CPC3010. The
dashed line indicates the total particle number concentration calculated from the initial aerosol concentration assuming constant mixing ratio of particles during pumping. As ex-plained in Sect. 2.5, the difference between the solid and dashed lines indicates partial loss of larger ice particles by sedimentation in the sampling tube of the CPC3010 instru-ment. This loss is only small in the examples shown here but can be much larger in experiments at higher temperatures and low ice nuclei concentrations when the ice particles grow to larger sizes. The number concentration of ice particles was calculated with Eq. (2) from OPC-PCS measurements (stars in panel 4) and retrieved from FTIR extinction spectra (solid squares). The OPC-PCS time series have been shifted by 4 and 8 s in Figs. 5 and 6, respectively, which accounts for the characteristic time of ice crystal growth into the detection range of the OPC-PCS instrument (see Sect. 2.5).
In general, the OPC-PCS ice number concentrations are in good agreement with those retrieved from the FTIR extinc-tion spectra. After the onset of ice nucleaextinc-tion the number of ice crystals increased until Si reached its peak value Smax. This maximum value of Si (see Table 2) mainly depends on
the rate of ice particle formation, the growth rate of the ice crystals and the cooling rate. Smaxof only 1.09 and 1.16 are
850 900 950 1000 p (hPa) 216 218 220 222 224 T (K) Tg Tw 0.8 0.9 1.0 1.1 1.2 1.3 Si TDL Ice FISH Ice 1 10 100 1000 n (cm −3) CPC3010 PCS ice FTIR ice 0 50 100 150 200 Time (s) 0.01 0.10 1.00 Fraction f i PCS ice FTIR ice AIDA Experiment: IN02_147, Aerosol: ATD
Fig. 5. Time series from experiment IN02 147 with ATD at 223.3 K. Panel 1 (from top): pressure; panel 2: mean gas tempera-ture; panel 3: ice saturation ratio; panel 4: number concentration of aerosol and ice particles (see text); panel 5: ice particle fraction to total aerosol. The vertical dashed-dotted line marks the time when the ice-activated fraction fi exceeded a value of 0.08.
reached in experiments IN02 147 and IN03 05, respectively. In all experiments discussed here, the formation of new ice particles was mainly observed in relatively short time peri-ods when Siincreased from a threshold value for onset of ice
nucleation close to 1 to Smax. Formation of new ice crystals almost instantly stopped after Smaxwas reached. In the fur-ther course of an experiment, Si stayed almost constant or
only slightly decreased without any further formation of new ice crystals. The formation rate of ice crystals by deposition nucleation on the surface of dust particles is mainly a func-tion of Si at a given temperature. This indicates that time is
only a secondary effect and that at least the deposition mode nucleation rate may not be described in the same stochastic manner as homogeneous freezing as already pointed out in previous work (DeMott et al., 1998).
The fraction fi of ice particles to the total aerosol particle
concentration (see Eq. 1) is shown in panel 5 of Figs. 5 and 6. Similar to the total ice particle concentration, fi steadily
in-creases after the onset of ice nucleation and stays almost
con-850 900 950 1000 p (hPa) 202 204 206 208 210 212 T (K) Tg Tw 0.8 0.9 1.0 1.1 1.2 1.3 Si TDL Ice MBW Ice 1 10 100 n (cm −3 ) CPC3010 PCS ice FTIR ice 0 50 100 150 200 Time (s) 0.01 0.10 1.00 Fraction f i PCS ice FTIR ice AIDA Experiment: IN03_05, Aerosol: ATD
Fig. 6. Same as Fig. 5, but for experiment number IN03 05 with ATD at 210.8 K.
stant after the time tmaxwhen Smaxwas reached. The relation between fi and Si will be discussed in detail in Sect. 3.2. In
the following paragraphs we discuss the ice particle fraction fmaxmeasured at tmaxwhich gives a first idea of the ice nu-cleation efficiency of the different dust samples as function of the ice saturation ratio and temperature (see also Mangold et al., 2005). We do not attempt here to quantitatively de-scribe Smaxas function of the cooling rate, the formation rate of ice crystals, and the dynamic partitioning of water vapour between the gaseous and condensed phases. This will be done in a process modelling study which is in preparation. However, it is obvious that Smax tends to be higher for (1) faster cooling rates, (2) less efficient ice formation (smaller ice surface for uptake of water vapour) or lower aerosol con-centration, and (3) lower temperature (slower crystal growth rates). Table 2 shows Smax of all experiments to range be-tween 1.09 and 1.45 with respective fmaxbetween 0.26 and 0.88. All fmaxdata was obtained by linear interpolation of the FTIR fi data points to tmax. The data show that signifi-cant number fractions of the dust particles are active deposi-tion ice nuclei at very low ice supersaturadeposi-tions.
fi 1.2 1.0 0.8 0.6 0.4 0.2 0.0 Si 1.3 1.2 1.1 1.0 IN02_147
Fig. 7. Fraction fi of ice activated aerosol particles as function of the ice saturation ratio Simeasured during experiment IN02 147 with ATD at 222.6K. Siwas calculated as function of the mean gas temperature Tg(solid line) and Tg−0.3 K (dashed line).
In three subsequent expansion runs with the same ATD aerosol starting at T ≈223 K (runs IN02 147 to IN02 149) about 60% of the dust particles acted as deposition ice nu-clei at Si<1.15. At T ≈210 K (runs IN03 05 to IN03 07) a
somewhat higher ATD aerosol number fraction of about 80% is activated in the same range of supersaturation. Note that in both series the number concentrations decreased from run to run both by dilution during pumping and refilling with ticle free synthetic air and by partial deposition of ice par-ticles. The dust particles were exposed to Si≈0.5 for about
20 min when the aerosol chamber was replenished with syn-thetic air in between two pumping expansion runs. Further-more, different pumping speeds were applied in the differ-ent runs which is reflected by the parameter dSi/dt in
Ta-ble 2. Changes of both the aerosol number concentration and dSi/dt had no significant effect on the peak Si and fi
data. Only during IN03 21 with ATD at the lowest tempera-ture of 196 K the maximum Si was higher, mainly resulting
from the high pumping speed during this run combined with slower ice particle growth rate at the low temperature and therefore a slower depletion rate by uptake of water vapour to the ice surface. It is likely that most of the ice crystals already formed at saturation ratios below the peak value of 1.41, but could not be detected earlier because of the dalayed growth of the ice crystals into the detection range of the OPC-PCS and the FTIR retrieval (see Sect. 2.5). No reliable correc-tion for the growth time delay was possible at temperatures around 196 K.
During two runs with SD2 and AD1 and initial tempera-tures above 220 K, fi was limited to 0.24 for SD2 and 0.26
for AD1 with Smaxof 1.45 and 1.41, respectively. Two more runs with SD2 at initial temperatures of 213.1 K and 210.0 K show significantly lower Smax and higher fmax. This indi-cates a strong temperature dependence with higher ice
nu-fi 1.2 1.0 0.8 0.6 0.4 0.2 0.0 Si 1.3 1.2 1.1 1.0 IN03_05
Fig. 8. Fraction fi of ice activated aerosol particles as function of the ice saturation ratio Si measured during experiment IN03 05 with ATD at 210.8K Siwas calculated as function of the mean gas temperature Tg(solid line) and Tg−0.3 K (dashed line).
cleation efficiency at lower temperature. At the lowest tem-perature run with SD2 we can, for the same reasons as dis-cussed above for the runs with ATD, assume that the value of 1.44 for Smaxis only an upper limit for fi to reach a value of
0.81. Unfortunately, no runs with AD1 are available so far at T <220 K.
3.2 Ice activation spectra
In this section we discuss the efficiency of the different min-eral aerosol particles as deposition ice nuclei in terms of the ice activated number fraction fi as function of the
increas-ing ice saturation ratio Si. Two examples for this relation
are plotted in Figs. 7 and 8 for experiments IN02 147 and IN03 05, respectively. The figures depict only data between t0, the start of pumping, and tmax, the time when the maxi-mum Si was reached. fi was obtained from the OPC-PCS
data set at a time resolution of 5 s (stars). Only few data points of fiwere obtained from the FTIR spectra before tmax (open squares). The error bars for Siinclude uncertainties of
the measured water vapour pressures and ice saturation pres-sures as discussed in Sect. 2.4. An additional systematic un-certainty of the measured ice nucleation onset may arise from the fact that the ice nucleation is initiated by a temperature somewhat lower than the mean temperature (it is unlikely that the ice formation is initiated by the warmer fraction of the chamber volume). The temporal and spatial variability around the mean temperature is typically less than ±0.3 K. If the observed ice formation would be initiated at Tg−0.3 K
instead of Tg, Si(Tg)discussed in the present paper would
systematically underestimate the ice nucleation thresholds by about 4 % at 220 K and 5% at 190 K. This is indicated by the dashed line in Figs. 7 and 8.
As already indicated in the discussion of the time series and maximum values of fi and Si in Sect. 3.1, the number
fraction of mineral dust particles acting as deposition ice nu-clei is mainly determined, at a given initial temperature of AIDA expansion experiments, by the increasing ice satura-tion ratio. Meyers et al. (1992) fitted an exponential funcsatura-tion to atmospheric ice nuclei measurements at temperatures be-tween 266 and 253 K, which is used in cloud models to cal-culate the number of ice particles as function of the ice sat-uration ratio. Based on our experimental results, we suggest a similar exponential equation to parameterise the fraction of mineral particles acting as deposition nuclei as function of Si−S0. It is assumed that no ice nucleation occurs below the
threshold ice saturation ratio S0. Above S0, the fraction fi
increases exponentially according to
fi =exp[a (Si −S0)] −1. (3)
where both S0and the scaling factor a may depend on aerosol properties and the temperature. Fits of Eq. (3) to the exper-imental data, which are defined for 0<fi<1, are shown as
solid lines in Figs. 7 and 8. The exponential approximations were applied to the OPC-PCS data sets of fi for experiment
series IN02 and IN03 and the OPC-Welas data sets for IN04. The resulting fit parameters S0and a are listed in Table 2 for all experiments with reliable data sets of fi and Si. For all
runs the ice nucleation was found to start at very low thresh-old ratios 1.0<S0<1.19. The highest values of 1.1 and 1.19 are found for runs with SD2 and AD1, respectively, at tem-peratures above 220 K. For the experiments at the lowest temperatures around 197 K we only obtained an estimate for S0of 1.1 and 1.02 for ATD and SD2, respectively.
The exponential factor a determines the steepness of the activation curve and therefore the formation rate of ice crys-tals as function of Si. This factor scatters between 3.3 and
13.2 for all experiments with ATD. Mean values of 4.7 and 9.2 are obtained for the three runs at 223 K and 210 K, re-spectively. The higher value at the lower temperature is con-sistent with the fact that also fmaxis higher at the lower tem-perature (see Sect. 3.1). For the experiments with the desert dust samples, the exponential factor is somewhat smaller with values of less than 1 for experiments above 220 K and of 1.7 to 3.0 for experiments IN04 44 and IN03 11 with SD2, respectively. This also shows the ice activity of SD2 to in-crease with decreasing temperature.
We have also calculated from Eq. (3) the ice saturation S8%at which fi exceeded a value of 0.08 (see Table 2). In
a companion paper Field et al. (2006) show, that a value of fi≈0.08 separates two different ice nucleation modes, which
appeared in repeated ice nucleation and evaporation cycles with the desert dust samples AD1 and SD2. For comparison with these results we have chosen the same threshold value of 0.08. Field et al. (2006) describe the characteristics of the dual mode nucleation behaviour and explain the second ice nucleation mode, which appears at Si between 1.35 and 1.5,
either as a second deposition or a condensation type mode of
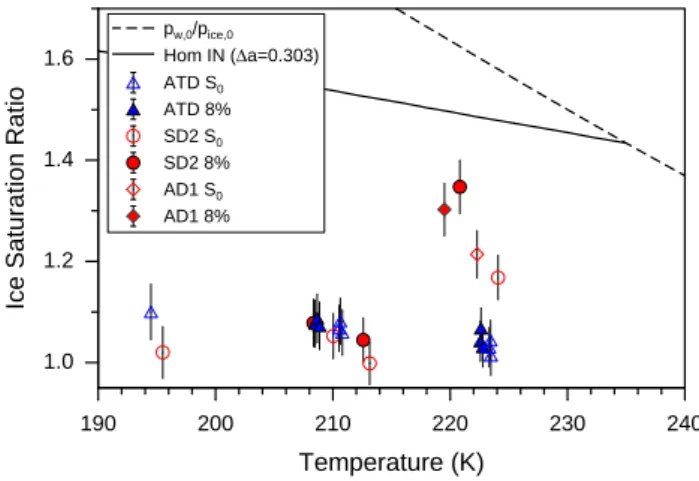
1.0 1.2 1.4 1.6 Ice S aturation R atio 190 200 210 220 230 240 Temperature (K) pw,0/pice,0 Hom IN ( a=0.303)∆ ATD S0 ATD 8% SD2 S0 SD2 8% AD1 S0 AD1 8%
Fig. 9. Threshold ice saturation ratios for freezing onset (open symbols) and for 8% ice activated aerosol fraction. The vertical bars show the estimated uncertainty for Si. Also shown are the ra-tio of the saturara-tion pressures for pure liquid water (dashed line) and typical ice saturation ratios for the freezing of solution droplets according to Koop et al. (2000). The water vapour saturation pres-sures are taken from Murphy and Koop (2005).
ice nucleation. The second mode became more obvious in the subsequent expansion runs of the same dust aerosol. The parameterisation we suggest here applies only to the first de-position nucleation mode in freshly dispersed dust samples and low ice supersaturations. To avoid interference with the second nucleation mode the fit discussed here have been re-stricted to Si<1.35.
Figure 9 depicts, as function of temperature, the threshold ice saturation ratios S0(open symbols) and S8%(closed sym-bols). The onset thresholds are below 1.1 for all three dust types except for the desert dust samples SD2 and AD1 at the highest temperature. Also S8%is significantly higher for the desert dusts at similar temperatures. At the lowest tempera-tures only the ice nucleation onset could be determined for ATD and SD2. The characteristics of ice nucleation on SD2 and AD1 dust aerosols at temperatures above 220 K are dis-cussed by Field et al. (2006).
The ice nucleation efficiency of the different dust aerosols can also be expressed by the relative increase of fi with Si,
which is obtained from Eq. (3) as dfi
dSi
=aexp[a (Si −S0)] = a (fi+1). (4)
It can be seen that dfi/dSi is initially determined by the
pa-rameter a and is larger by a factor of two when fiapproaches
its maximum value of 1. Values calculated for fi=0.08 are
listed in Table 2. The formation rate of ice crystals can be calculated from Eqs. (1) and (4) as
dnice dt =np dfi dSi dSi dt ≈npa dSi dt (5)
where the approximation neglects the exponential factor in Eq. (4). This equation may be used to parameterise the ice
formation rate by deposition nucleation in models as func-tion of the rate of ice saturafunc-tion increase above S0, provided that the aerosol particle concentration npand the respective
parameters S0 and a are known. It should be noted that in the laboratory experiments reported here these parameters significantly varied with temperature and the type of dust. Ageing processes like surface coating may cause additional change. Further experiments are needed to properly assess the variation of the activation spectra for atmospheric dust particles.
3.3 Nucleation rates
It is difficult if not impossible to formulate a surface nucle-ation rate for a complex system like a mineral dust aerosol, which is composed of particles with different sizes, miner-alogy, shape, and surface roughness. Nevertheless, experi-mental data may, if appropriate, be used to estimate nucle-ation rates as function of temperature, ice supersaturnucle-ation, and aerosol properties. Archuleta et al. (2005) e.g. calcu-lated, from ice nucleation measurements in a continuous flow diffusion chamber, heterogeneous surface nucleation rates Js
on size-fractionated aluminium and iron oxide particles with diameters between 50 and 200 nm, which were treated with sulphuric acid. As expected, Js was larger at larger relative
humidity or water activity of the sulphuric acid and lower temperature. At temperatures between about 203 and 233 K and water activities between 0.79 and 0.91, Js varied
be-tween about 105and 107cm−2s−1. In a flow tube study with similar oxide particles but with ammonium sulphate instead of sulphuric acid treatment, Hung et al. (2003) found Js to
be about a factor of 100 lower at temperatures around 233 K. To estimate an equivalent surface nucleation rate for the conditions of our experiments we first calculated the forma-tion rate of ice crystals from Eqs. (5) and (4) for fi=0.08
with the total particle concentration npdiscussed in Sect. 2.5.
Assuming that all particles form ice germs with the same surface nucleation rate we can calculate the effective surface nucleation rate Js from the ratio of the measured ice
forma-tion rate and the aerosol surface area concentraforma-tion sae. The
aerosol surface area was calculated from the size distribution parameters given in Table 1 and the initial aerosol number concentration (see Table 1) minus the 8% of particles that already acted as ice nuclei. Here we neglect the fact that the size distribution parameters of the dust aerosol should change with ongoing ice nucleation because the larger parti-cles with larger surface areas nucleate first. From the results listed in Table 2 we get mean values of about 3×10⁶ and 5×106cm−2s−1for the runs with ATD at 223 and 210 K, re-spectively. The nucleation rates are smaller by a factor of 5 to 10 for the Asian and Saharan desert dusts. As mentioned above, this difference cannot be explained by a size effect, because the different aerosols showed similar size distribu-tions and surface area concentradistribu-tions.
It is important to note that the nucleation rates estimated above only apply for the conditions of our experiments, i.e a mixture of dust particles with diameters mainly between about 0.1 and 1 µm and a steady increase of Si at different
rates given in Table 2. As already discussed in Sect. 3.1 the formation rate of ice crystals and therefore the nucleation rate approaches zero as soon as Si reaches its maximum value,
even if a significant fraction of the dust particles have not yet formed an ice crystal.
4 Conclusions
In three series of AIDA cloud chamber experiments at cir-rus temperatures between 196 and 223 K we investigated the deposition mode ice nucleation efficiency of so-called Ari-zona Test Dust as reference aerosol and two desert dust sam-ples from Asia (AD1) and the Sahara (SD2). The latter two may be more typical for dust particles found in the atmo-sphere. The aerosols were generated by dry dispersion of the dust samples and inertial removal of particles with diame-ters larger than about 2 µm. The size distributions of the dust aerosols could be approximated by lognormal fits with mode diameters of about 0.3 to 0.5 µm and geometric standard de-viations of about 1.6 to 1.9. During the cloud chamber ex-periments, different rates of cooling and increase of ice sat-uration ratio where achieved by controlled pumping. In 12 experiments with different initial temperatures and aerosol number concentrations the fraction fi of ice particles, i.e. ice
activated aerosol particles, to the total particle (aerosol plus ice) number concentration was measured as a function of the increasing ice saturation ratio.
All three mineral dust aerosol samples contained signifi-cant numbers of very efficient deposition ice nuclei. Hetero-geneous ice nucleation already started at ice saturation ratios Si below 1.2, in most cases below 1.1. The ATD sample
was most active with activated fractions of about 0.6 and 0.8 at Si<1.15 and temperatures of 223 and 209 K, respectively
(see also M¨ohler et al., 2005b, and Mangold et al., 2005). The desert dust samples SD2 and AD1 showed a significantly lower fraction of deposition nuclei, about 0.25 at 223 K and Si<1.35. Archuleta et al. (2005) investigated the ice
nucle-ation of re-suspended and size segregated particles from an-other Asian dust sample. At 223 K, only 1% of particles with a diameter of 0.2 µm acted as ice nuclei. In the same study, smaller dust particles showed an even higher ice saturation threshold for ice nucleation on the same fraction of parti-cles. Because in our study most particles were larger than 0.2 µm, the higher fraction of ice active dust particles may be explained by the larger particle sizes. However, the differ-ence in ice activity we observed between the ATD and desert dust samples can not be explained by a size effect, because the different aerosols showed similar size distribution. The more active ATD particles even tended to be slightly smaller. Therefore, the ice nucleation activity is also influenced by
other particle properties like surface roughness or mineralog-ical composition. We can only speculate whether the higher activity of ATD is due to a higher surface roughness of the milled particles or due to the different elemental and there-fore also mineral composition (see Table 1).
There is evidence that for a given aerosol sample and ini-tial temperature the ice activation spectrum, i.e. the relation between fi and Si, is almost independent of the cooling rate
and the total aerosol number concentration. Furthermore, the formation of new ice particles is always correlated with an increase of Si. The ice number fraction remains almost
con-stant after Si reached its peak value. This may be explained
by a given distribution of surface sites for deposition nucle-ation as function of Si, which are activated almost
immedi-ately after the respective critical ice saturation ratios are ex-ceeded. A narrow distribution results in a large value and a broad distribution in a low value of dfi/dSi. Similar to the
parameterisation suggested by Meyers et al. (1992) to predict the number of heterogeneous ice nuclei at higher tempera-tures, we suggest an exponential equation as function of Si
to calculate the fraction of mineral particles acting as deposi-tion nuclei. Our limited data set already shows that both the onset ice saturation S0 and the exponential factor a, which mainly determines the ice particle formation rate, depend on temperature and the type of the dust aerosol (see Table 2).
Two series of three subsequent ice activation and evapora-tion cycles with ATD at initial temperatures of 223 and 210 K showed no significant change in the ice nucleation activity. This indicates that the phenomenon of preactivation noted by Roberts and Hallett (1968) does not apply to ATD parti-cles under the conditions of our experiments. For the desert dust samples a second ice nucleation mode appeared at Si
between 1.35 and 1.5. The characteristics of this dual mode ice nucleation, which became more obvious in subsequent expansion runs of the same desert dust aerosol, are discussed in more detail in a companion paper (Field et al., 2006).
Initial surface nucleation rates of 3×10⁶, 2×10⁵, and 5×105cm−2s−1, were determined at about 223 K for ATD, SD2, and AD1, respectively. However, the formation rate of ice crystals and therefore the nucleation rate dropped to markedly lower values as soon as Si reached its maximum
value, even if a significant fraction of the dust particles have not yet formed an ice crystal. From this we conclude that the concept of surface nucleation rates may not be feasible to predict ice formation by deposition nucleation in complex mineral dust aerosols, at least under the conditions of our ex-periments, which are similar to cloud expansion at updraft velocities of about 0.5 to 2 m/s. Our experimental results in-dicate that a parameterisation of the ice active aerosol parti-cle fraction as function of only the ice saturation ratio may be more appropriate for atmospheric models to calculate the ice formation rate. Further experiments and process modelling studies are needed to assess the influence of temperature and particle properties on the respective ice activation spectra of mineral dust aerosols.
Acknowledgements. Continuous support by the AIDA staff
members R. Buschbacher, T. Chudy, E. Kranz, G. Scheurig, and S. Vogt is gratefully acknowledged. We thank L. Sch¨utz from the Universtiy Mainz, Germany, for providing the dust sample from the Takla Makan desert in Asia, and K. Megahed for collecting the Saharan dust sample. We also thank C. Adelhelm from the Institute of Material Research (IMF I) of Forschungszentrum Karlsruhe for XRF analysis of mineral dust samples. The first author is grateful to the National Center for Atmospheric Research (NCAR) in Boulder, Colorado, for financial support of a stay as visiting scientist, which was partially used for data analysis and preparation of this manuscript. This work contributes to the HGF (Hermann-von-Helmholtz-Gemeinschaft Deutscher Forschungszentren) project Particles and Cirrus Clouds (PAZI-II). Part of this work was funded within the European Union Integrated Project SCOUT-O3.
Edited by: T. Koop
References
Archuleta, C. M., DeMott, P. J., and Kreidenweis, S. M.: Ice nu-cleation by surrogates for atmospheric mineral dust and mineral dust/sulfate particles at cirrus temperatures, Atmos. Chem. Phys., 5, 2617–2634, 2005,
http://www.atmos-chem-phys.net/5/2617/2005/.
Bailey, M. and Hallett, J.: Nucleation effects on the habit of vapour grown ice crystals from −18 to −42◦C, Quart. J. Royal Meteo-rol. Soc., 128, 1461–1483, 2002.
Benz, S., Megahed, K., M¨ohler, O., Saathoff, H., Wagner, R., and Schurath, U.: T-dependent rate measurements of homogeneous ice nucleation in cloud droplets using a large atmospheric sim-ulation chamber, J. Photochem. Photobiol. A, 176, 208–217, doi:10.1016/j.jphotochem.2005.08.026, 2005.
Chen, Y. L., Kreidenweis, S. M., McInnes, L. M., Rogers, D. C., and DeMott, P. J.: Single particle analyses of ice nucleating aerosols in the upper troposphere and lower stratosphere, Geophys. Res. Lett., 25, 1391–1394, 1998.
Cziczo, D. J., Murphy, D. M., Hudson, P. K., and Thomson, D. S.: Single particle measurements of the chemical composition of cir-rus ice residue during CRYSTAL-FACE, J. Geophys. Res., 109, D04 201, doi:10.1029/2003JD004 032, 2004.
Dahneke, B.: Simple Kinetic Theory of Brownian Diffusion in Va-pors and Aerosols, in: Theory of Dispersed Multiphase Flow, edited by: Meyer, R. E., Academic Press, New York, pp. 97– 133, 1983.
DeMott, P. J., Rogers, D. C., Kreidenweis, S. M., Chen, Y. L., Twohy, C. H., Baumgardner, D., Heymsfield, A. J., and Chan, K. R.: The role of heterogeneous freezing nucleation in upper tropospheric clouds: Inferences from SUCCESS, Geophys. Res. Lett., 25, 1387–1390, 1998.
DeMott, P. J., Sassen, K., Poellot, M. R., Baumgardner, D., Rogers, D. C., Brooks, S. D., Prenni, A. J., and Kreidenweis, S. M.: African dust aerosols as atmospheric ice nuclei, Geophys. Res. Lett., 30(14), 1732, doi:10.1029/2003GL017 410, 2003. Diehl, K. and Wurzler, S.: Heterogeneous drop freezing in the
im-mersion mode: Model calculations considering soluble and in-soluble particles in the drops, J. Atmos. Sci., 61, 2063–2072, 2004.
Ebert, V., Teichert, H., Giesemann, C., Saathoff, H., and Schurath, U.: Fibre-coupled in-situ laser absorption spectrometer for the selective detection of water vapour traces down to the ppb-level, Tech. Mess., 72, 23–30, 2005.
Field, P. R., Cotton, R. J., Noone, K., Glantz, P., Kaye, P. H., Hirst, E., Greenaway, R. S., Jost, C., Gabriel, R., Reiner, T., Andreae, M., Saunders, C. P. R., Archer, A., Choularton, T., Smith, M., Brooks, B., Hoell, C., Bandy, B., Johnson, D., and Heymsfield, A.: Ice nucleation in orographic wave clouds: Mea-surements made during INTACC, Quart. J. Royal Meteorol. Soc., 127, 1493–1512, 2001.
Field, P. R., M¨ohler, O., Connolly, P., Kr¨amer, M., Cotton, R. J., Heymsfield, A. J., and Schnaiter, M.: Some ice nucleation char-acteristics of Asian and Saharan desert dust, Atmos. Chem. Phys., 6, 2991–3006, 2006,
http://www.atmos-chem-phys.net/6/2991/2006/.
Fletcher, N. H.: Physics of rain clouds, Cambridge University Press, 1962.
Gustafsson, R. J., Orlov, A., Badger, C. L., Griffiths, P. T., Cox, R. A., and Lambert, R. M.: A comprehensive evaluation of wa-ter uptake on atmospherically relaevant mineral surfaces: DRIFT spectroscopy, thermogravimetric analysis and aerosol growth measurements, Atmos. Chem. Phys., 5, 3415–3421, 2005, http://www.atmos-chem-phys.net/5/3415/2005/.
Haag, W., K¨archer, B., Str¨om, J., Minikin, A., Lohmann, U., Ovar-lez, J., and Stohl, A.: Freezing thresholds and cirrus cloud forma-tion mechanisms inferred from in situ measurements of relative humidity, Atmos. Chem. Phys., 3, 1791–1806, 2003,
http://www.atmos-chem-phys.net/3/1791/2003/.
Heintzenberg, J., Okada, K., and Str¨om, J.: On the composition of non-volatile material in upper tropospheric aerosols and cirrus crystals, Atmos. Res., 41, 81–88, 1996.
Heymsfield, A. J. and Miloshevich, L. M.: Homogeneous Ice Nucleation and Supercooled Liquid Water in Orographic Wave Clouds, J. Atmos. Sci., 50, 2335–2353, 1993.
Hirst, E., Kaye, P. H., Greenaway, R. S., Field, P., and John-son, D. W.: Discrimination of micrometre-sized ice and super-cooled droplets in mixed-phase cloud, Atmos. Environ., 35, 33– 47, 2001.
Hung, H.-M., Malinowski, S. T., and Martin, S. T.: Kinetics of heterogeneous ice nucleation on the surfaces of mineral dust cores inserted into aqueous ammonium sulfate particles, J. Phys. Chem. A, 107, 1296–1306, 2003.
Jensen, E. J., Toon, O. B., Tabazadeh, A., Sachse, G. W., Ander-son, B. E., Chan, K. R., Twohy, C. W., Gandrud, B., Aulen-bach, S. M., Heymsfield, A., Hallett, J., and Gary, B.: Ice nu-cleation processes in upper tropospheric wave-clouds observed during SUCCESS, Geophys. Res. Lett., 25, 1363–1366, 1998. K¨archer, B. and Lohmann, U.: A Parameterization of cirrus cloud
formation: Homogeneous freezing including effects of aerosol size, J. Geophys. Res., 107, 4698, doi:10.1029/2001JD001 429, 2002.
K¨archer, B. and Lohmann, U.: A parameterization of cirrus cloud formation: Heterogeneous freezing, J. Geophys. Res., 108, 4402, doi:10.1029/2002JD003 220, 2003.
Koop, T., Luo, B. P., Tsias, A., and Peter, T.: Water activity as the determinant for homogeneous ice nucleation in aqueous so-lutions, Nature, 406, 611–614, 2000.
Lohmann, U., K¨archer, B., and Hendricks, J.: Sensitivity
studies of cirrus clouds formed by heterogeneous freezing in the ECHAM GCM, J. Geophys. Res., 109, D16 204, doi:10.1029/2003JD004 443, 2004.
Lynch, D. K., Sassen, K., Starr, D. O., and Stephens, G. (Eds.): Cirrus, Oxford University Press, 2002.
Mangold, A., Wagner, R., Saathoff, H., Schurath, U., Giesemann, C., Ebert, V., Kr¨amer, M., and M¨ohler, O.: Experimental inves-tigation of ice nucleation by different types of aerosols in the aerosol chamber AIDA: implications to microphysics of cirrus clouds, Meteorol. Z., 14, 485–497, 2005.
Meyers, M. P., Demott, P. J., and Cotton, W. R.: New Primary Ice-Nucleation Parameterizations in an Explicit Cloud Model, J. Appl. Meteorol., 31, 708–721, 1992.
Mishchenko, M. I. and Travis, L. D.: Capabilities and limitations of a current FORTRAN implementation of the T-matrix method for randomly oriented, rotationally symmetric scatterers, J. Quant. Spectroscop. Radiat. Transfer, 60, 309–324, 1998.
M¨ohler, O., Stetzer, O., Schaefers, S., Linke, C., Schnaiter, M., Tiede, R., Saathoff, H., Kr¨amer, M., Mangold, A., Budz, P., Zink, P., Schreiner, J., Mauersberger, K., Haag, W., K¨archer, B., and Schurath, U.: Experimental investigation of homogeneous freez-ing of sulphuric acid particles in the aerosol chamber AIDA, At-mos. Chem. Phys., 3, 211–223, 2003,
http://www.atmos-chem-phys.net/3/211/2003/.
M¨ohler, O., B¨uttner, S., Linke, C., Schnaiter, M., Saathoff, H., Stet-zer, O., Wagner, R., Kr¨amer, M., Mangold, A., Ebert, V., and Schurath, U.: Effect of sulphuric acid coating on heterogeneous ice nucleation by soot aerosol particles, J. Geophys. Res., 110, D11 210, doi:10.1029/2004JD005 169, 2005a.
M¨ohler, O., Linke, C., Saathoff, H., Schnaiter, M., Wagner, R., Mangold, A., Kr¨amer, M., and Schurath, U.: Ice nucleation on flame soot aerosol of different organic carbon content, Meteorol. Z., 14, 477–484, 2005b.
Murphy, D. M. and Koop, T.: Review of the vapour pressures of ice and supercooled water for atmospheric applications, Quart. J. Royal Met. Soc., 131, 1539–1565, 2005.
Pruppacher, H. R. and Klett, J. D.: Microphysics of clouds and pre-cipitation, Kluwer Academic Publishers, Dordrecht, The Nether-lands, 1997.
Roberts, P. and Hallett, J.: A laboratory study of the ice nucleating properties of some mineral particulates, Quart. J. Royal Meteo-rol. Soc., 94, 25–34, 1968.
Sassen, K. and Dodd, G. C.: Homogeneous Nucleation Rate for Highly Supercooled Cirrus Cloud Droplets, J. Atmos. Sci., 45, 1357–1369, 1988.
Sassen, K., DeMott, P. J., Prospero, J. M., and Poellot, M. R.: Saharan dust storms and indirect aerosol effects on clouds: CRYSTAL-FACE results, Geophys. Res. Lett., 30, 1633, doi:10.1029/2003GL017 371, 2003.
Seifert, M., Strom, J., Krejci, R., Minikin, A., Petzold, A., Gayet, J. F., Schumann, U., and Ovarlez, J.: In-situ observations of aerosol particles remaining from evaporated cirrus crystals: Comparing clean and polluted air masses, Atmos. Chem. Phys., 3, 1037–1049, 2003,
http://www.atmos-chem-phys.net/3/1037/2003/.
Seifert, M., Tiede, R., Schnaiter, M., Linke, C., M¨ohler, O., Schu-rath, U., and Str¨om, J.: Operation and performance of a differen-tial mobility particle sizer and a TSI 3010 condensation particle counter at stratospheric temperatures and pressures, J. Aerosol
Sci., 35, 981–993, 2004.
Str¨om, J., Seifert, M., K¨archer, B., Ovarlez, J., Minikin, A., Gayet, J. F., Krejci, R., Petzold, A., Auriol, F., Haag, W., Busen, R., Schumann, U., and Hansson, H. C.: Cirrus cloud occurrence as function of ambient relative humidity: a comparison of ob-servations obtained during the INCA experiment, Atmos. Chem. Phys., 3, 1807–1816, 2003,
http://www.atmos-chem-phys.net/3/1807/2003/.
Targino, A. C., Krejci, R., Noone, K. J., and Glantz, P.: Single particle analysis of ice crystal residuals observed in orographic wave clouds over Scandinavia during INTACC experiment, At-mos. Chem. Phys., 6, 1977–1990, 2006,
http://www.atmos-chem-phys.net/6/1977/2006/.
Twohy, C. H. and Poellot, M. R.: Chemical characteristics of ice residual nuclei in anvil cirrus clouds: evidence for homogeneous and heterogeneous ice formation, Atmos. Chem. Phys., 5, 2289– 2297, 2005,
http://www.atmos-chem-phys.net/5/2289/2005/.
Vali, G.: Nucleation Terminology, Bull. Am. Meteorol. Soc., 66, 1426–1427, 1985.
Wagner, R., Benz, S., M¨ohler, O., Saathoff, H., Schnaiter, M., and Schurath, U.: Mid-infrared extinction spectra and optical con-stants of supercooled water droplets, J. Phys. Chem. A, 109, 7099–7112, 2005.
Wagner, R., Benz, S., M¨ohler, O., Saathoff, H., and Schurath, U.: Probing ice clouds by broadband mid-infrared extinction spec-troscopy: case studies from ice nucleation experiments in the AIDA aerosol and cloud chamber, Atmos. Chem. Phys. Discuss., 6, 5711–5771, 2006,
http://www.atmos-chem-phys-discuss.net/6/5711/2006/. Z¨oger, M., Afchine, A., Eicke, N., Gerhards, M.-T., Klein, E.,
McKenna, D., M¨orschel, U., Schmidt, U., Tan, V., Tuitjer, F., Woyke, T., and Schiller, C.: Fast in situ stratospheric hy-grometers: A new family of balloon-borne and airborne Lyman a photofragment fluorescence hygrometers, J. Geophys. Res., 104(D1), 1807–1816, 1999.
Zuberi, B., Bertram, A. K., Cassa, C. A., Molina, L. T., and Molina, M. J.: Heterogeneous nucleation of ice in (NH4)2SO4−H2O particles with mineral dust immersions, Geophys. Res. Lett., 29(10), 1504, doi:10.1029/2001GL014 289, 2002.