Publisher’s version / Version de l'éditeur:
ASCE Journal of the Engineering Mechanics Division, 86, 2, pp. 1-16, 1960-07-01
READ THESE TERMS AND CONDITIONS CAREFULLY BEFORE USING THIS WEBSITE. https://nrc-publications.canada.ca/eng/copyright
Vous avez des questions? Nous pouvons vous aider. Pour communiquer directement avec un auteur, consultez la
première page de la revue dans laquelle son article a été publié afin de trouver ses coordonnées. Si vous n’arrivez pas à les repérer, communiquez avec nous à [email protected].
Questions? Contact the NRC Publications Archive team at
[email protected]. If you wish to email the authors directly, please see the first page of the publication for their contact information.
NRC Publications Archive
Archives des publications du CNRC
This publication could be one of several versions: author’s original, accepted manuscript or the publisher’s version. / La version de cette publication peut être l’une des suivantes : la version prépublication de l’auteur, la version acceptée du manuscrit ou la version de l’éditeur.
Access and use of this website and the material on it are subject to the Terms and Conditions set forth at
White noise representation of earthquakes
Bycroft, G. N.
https://publications-cnrc.canada.ca/fra/droits
L’accès à ce site Web et l’utilisation de son contenu sont assujettis aux conditions présentées dans le site LISEZ CES CONDITIONS ATTENTIVEMENT AVANT D’UTILISER CE SITE WEB.
NRC Publications Record / Notice d'Archives des publications de CNRC:
https://nrc-publications.canada.ca/eng/view/object/?id=7ed2f1de-4e48-488b-9f88-148376d8d08b
https://publications-cnrc.canada.ca/fra/voir/objet/?id=7ed2f1de-4e48-488b-9f88-148376d8d08b
BLDG
DIVISION OF BUILDING RESEARCH
WHITE NOISE REPRESENTATION OF EARTHQUAKES
I
REPRINTED FROM
PROCEEDINGS O F T H E AMERICAN SOCIETY O F C I V I L ENGINEERS V O L 86. NO. EM 2. APRIL 1 9 6 0 . P. 1
-
16.RESEARCH PAPER NO. 104
OF THC
DIVISION O F BUILDING RESEARCH
OTTAWA JULY 1960
Ser
TH1
N21r2
no.
104
c.
2
NATIONAL
RESEARCH
COUNCIL
CANADA
t h e D i v i s i o n of Building Research of t h e National Research Council a s a c o n t r i b u t i o n towards b e t t e r b u i l d i n g i n Canada. I t should not be reproduced i n whole o r i n p a r t , w i t h o u t permission of t h e o r i - g i n a l p u b l i s h e r . The D i v i s i o n would be g l a d t o be of a s s i s t a n c e i n o b t a i n i n g such permission.
P u b l i c a t i o n s of t h e D i v i s i o n o i R u i l d i r g Research may be obtained by mailing t h e a p p r o p r i a t e r e n i t t a n c e , ( a Dank, L q r o s s , o r Post Office Money Order o r a cheque made payable a t p a r i n Ottawa, t o t h e Receiver General of Canada, c r e d i t National Research Council) t o +,he N a t i o r a l Research Council,
Ottawa. S t a m p a r e not a c c e p t a b l e .
A coupon system has been introduced t o
make payments f o r p u b l i c a t i o n s r e l a t i v e l y simple. Coupons a r e a v a i l a h l e i n denominations of 5, 25,
and 9 c e n t s , and may be obtained by making a r e -
m i t t a n c e a s i d i c a t e d above. These coupons mag be used f o r t h e purchase of a l l N a t i o n a l Research C c u n c i l p u b l i c a t i o n s i n c l u d i n g s p e c i f i c a t i o n s of t h e Canadian Cove-ent S p e c i f i c a t i o n s Board.
A N A L ' I Z E D
April, 1960 EM 2
Journal
of
the
ENGINEERING MECI-IANICS DIVISION
Proceedings of
the
American Society
of
Civil Engineers
WHITE NOISE REPRESENTATION O F EARTHQUAKES By G. N. ~ ~ c r o f t l
SYNOPSIS
This investigation is intended to show that white noise is a suitable r e p r e - sentation of earthquake motion. It appears t h a t a white-noise s o u r c e used in conjunction with an analog computer is a convenient method of analyzing s t r u c t u r e s subjected to complex ground motions and of assigning probabilities to the deformations arising. Until m o r e statistical information is available about earthquakes, i t is suggested that a "standard l a r g e earthquake" be represented by "white" ground accelerations having a flat s p e c t r a l density of 0.75 ft2/sec4/cps and a duration of 1/2 min.
INTRODUCTION
One of the major difficulties in determining suitable a s e i s m i c designs l i e s i n the lack of knowledge of destructive earthquakes. Accelograms of a few l a r g e earthquakes a r e available and these r e c o r d s show v e r y complex ground motions entirely different f r o m each other. They a r e different in energy con- tent o r "size" and different in duration and shape. Earthquakes of the f u t u r e
Note.-Discussion open unlil September 1 , 1960. To extend the closing date one month, a written request must be filed with the Executive Secretary, ASCE. This paper i s part of the copyrighted Journal of the Engineering Mechanics Division, Proceedings of the American Society of Civil Engineers, Vol. 86, No. EM 2, April, 1960.
Research Oificer, Bldg, Physics Sect., Div. of Bldg. Research, Natl. Research Coun- cil, Ottawa, Can.
will not n e c e s s a r i l y b e a r any relation t o those in the past and no prediction of the s e v e r i t y and character of future earthquakes can be made. Two e a r t h - quakes having the s a m e energy content will have different effects on any p a r - ticular s t r u c t u r e . Each individual earthquake, of course, h a s a specific character and a specific effect on a particular structure, but t h i s character is not predictable.
Many investigations of s t r u c t u r a l vibration due to ground motion have been made on a deterministic basis, using actual r e c o r d s of earthquakes and d e - termining the deformations that would o c c u r i n various types of structures. This approach would be satisfactory if a l a r g e enough number of records w e r e available and t h e r e s u l t s displayed on a probability basis. Until this is p o s - sible r e c o u r s e t o another mode of attack m u s t b e made.
Earthquakes originate a s ill-defined slip-faults followed b y innumerable reflections, refractions, and attenuations by t h e complex t e r r a i n through which i t travels. Intuitively, one f e e l s that the e s s e n t i a l c h a r a c t e r i s t i c of the e a r t h - quake is i t s irregularity. Many writers2,3,4 have suggested simulating e a r t h - quakes by a random assemblage of impulses. In o r d e r that white noise should simulate an earthquake i t must have the s a m e effect on the kinds of dynamic s y s t e m s that a r i s e in s t r u c t u r e s . A linearly-elastic and elasto-plastic s t r u c - t u r e a r e considered herein.
LINEAR ELASTIC STRUCTURE
The r e s p o n s e of a linear s t r u c t u r e of many degrees of freedom to ground motion may be written i n t e r m s of the s p e c t r u m of that ground motion. Let
(t) = the ground acceleration;
v (x, t ) = velocity of s o m e point of the structure; Tn = period of the nth harmonic;
~ ( x , T,) = harmonic 'weightingn factor and is a function of the s t r u c t u r e only;
P = number of d e g r e e s of freedom; and
A n = fraction of c r i t i c a l damping of t h e nth harmonic. then, -2 II An P t T n ( t - 7 ) v ( ~ , t ) =
z
K(X,TSJg
a ( 7 ] t? s i n - ( t - ~ ) d ~. -
(1) n = l TnEq. 1 s t a t e s that the r e s p o n s e of a multi-degree-of-freedom structure is
the s u m of the responses of the various modes o r harmonics. T h e earthquake excitation o c c u r s only i n the i n t e g r a l factor a n d consequently t h i s is the only factor we need consider.
2 "Response Spectrum Techniques in Engineering Seismology," by D. E. Hudson, P r o - ceedings, World Conf. on Earthquake Engrg., San F r a n c i s c o , Calif., June, 1956.
"Some Applications of Probability Theory in A s e i s m i c Design," by E. Rosenblueth, Proceedings, World Conf. on Earthquake Engrg., San Francisco, Calif., June, 1956.
"Response of Tall Buildings to Random Shakes," by A. Cemal Eringen, Tech. R e - port No. 12, Office Naval R e s e a r c h , Div. of Engrg. Sciences, Purdue Univ., December,
EM 2 EARTHQUAKE REPRESENTATION 3 The velocity s p e c t r u m of t h e ground motion is defined a s t h e maximum value of t h i s integral, that is,
t -2 a X
T ( t
-
1
2 aV(h,T) = Max
/O
u ( r ) e s i n -(t-
T ) d 7.
. .
.
T (2)
and is a function of period and damping only.
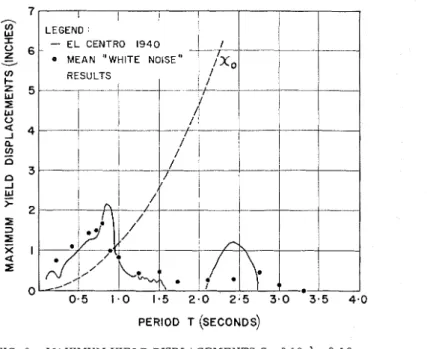
Spectra of s e v e r a l l a r g e earthquakes have been calculated and a r e well known.5 The s p e c t r a a r e a l l different i n detail but have the f e a t u r e in common that they fluctuate rapidly, with respect t o p e r i o d T, about a m e a n line which s t a r t s a t the origin and r i s e s asymptotically t o a constant value. G. W. Housner drew6 smooth mean c u r v e s through t h e s e oscillatory spectra and found that t h e s e smooth c u r v e s have almost the s a m e shape f o r different earthquakes. The actual s c a l e of the s p e c t r a v a r i e s according t o the s i z e of the earthquake. The full l i n e s i n Fig. 1 a r e taken f r o m Housner's work6 and show the shape of t h e s e common average spectra, and the particular scale of V shown is that of the l a r g e s t earthquake recorded, viz., El Centro, Calif.,
1940.
The w r i t e r used an analog computer t o construct mean s p e c t r a of b u r s t s of "white noise" f o r comparison with t h e mean spectra of Fig. 1. "White noise" is defined a s a random signal having a gaussian probability of ampli- tude distribution and a s p e c t r a l density which is constant for a l l frequencies. The s p e c t r a l density a t any particular frequency may b e regarded a s t h e average power passing when t h e signal is f i l t e r e d by a narrow band p a s s f i l - t e r centered a t the p a r t i c u l a r frequency. In practice, of course, one e n - counters "band-limited white noise," that is, the s p e c t r a l density is only constant up t o a certain frequency and is then rapidly cut off. A s long a s t h i s frequency is l a r g e compared with the frequencies of the s y s t e m being con- sidered, the response of t h e s y s t e m is unaffected by the value of the cut-off point. The computer used provides a band-limited white noise having a s p e c - t r a l density flat f r o m 0 to 3 5 cycles.
The equation of motion of the mechanical oscillator subjected to an a c - celeration u ( t ) is simply,
i n which
x
is t h e displacement of the m a s s relative to i t s z e r o position and LJ is the angular frequency of t h e oscillator. Variables i n t h e computer a r e represented by voltages having an allowable maximum of 100 volts. If x is t o have a n expected maximum of V f t p e r s e c t h e mechanical equation is scaled t o100
[El
+ 2I
[*
+[ ' o o " ~ ]
= -[(Yv
w (t)].
.
.
-
(4)where the t e r m s i n s q u a r e b r a c k e t s a r e the r e s p e c t i v e computer voltages.
5 "Spectra Analyses of Strong Motion Earthquakes," by J. C. Alford, G. W. Housner
and R. R. Martel, Earthquake Research Lab., Tech. Report to Office of Naval Research, Calif. Inst. of Tech., Pasadena, August, 1951.
VLimit Design of Structures to Resist Earthquakes," by G. W. Housner, Proceed-
EM 2 EARTHQUAKE REPRESENTATION 5 If W(t) is the actual voltage of the noise s o u r c e and X the computer vari- ble in volts corresponding to x, we may write the equation a s
. .
100 kW (t)
.
. . . .
.
.
.
. . . .
.
X + 2 h X + X = - (5
where the factor k will be chosen s o that k W(t) i n volts is numerically equal to some representative ground acceleration cr (t) in ft p e r sec2.
The actual velocity
k
i n feet p e r second is given by the computer volts X multiplied by ~ / 1 0 0 , the acceleration by X Vw / I 0 0 and the displacement by X v/100 w.
Ideally, a probability distribution should be given to the s i z e and duration of the earthquake a s well a s t o i t s configuration. However, with t h e available information, this cannot be done satisfactorily. T h e available r e c o r d s of large earthquakes show that t h e i r duration was generally of the o r d e r of 20 s e c to 30 sec. A duration of 25 s e c h a s been selected h e r e a s representative of large earthquakes.
For various values of period T and damping h, twenty s e p a r a t e bursts of white noise of 25 s e c duration w e r e fed into the circuit. The s y s t e m was r e - s e t t o z e r o a f t e r every burst. Each burst of noise gives a &fferent value of the maximum velocity acquired by the oscillator.
The maximum value of ir during each burst of noise is the required spec- t r u m f o r that particular b u r s t of noise. The mean of the maximum velocity of the twenty r u n s was taken i n e a c h case. This gives the variation of the mean maximum velocity f o r b u r s t s of white noise a s a function of p e r i o d and damp- ing. However, t h i s mean s t i l l contains the s c a l i n g factor k, a n d the value given to k will determine the s i z e of the earthquake being represented. This variation is shown by the c i r c l e s in Fig. 1. T h e factor k was chosen s o that the s c a l e s matched a t an a r b i t r a r y point viz., T = 3.0 and h = 0.20. With t h i s value of k the position of the o t h e r points was determined. It is seen that t h e variation of the mean s p e c t r a of the noise with both period and damping is very s i m i l a r to Housner's common average earthquake spectra. The s c a l e s could have been matched a t any other point but the value of k would not b e v e r y different.
F r o m this i t a p p e a r s that "white" ground accelerations a r e a suitable representation of earthquakes. Further, by choosing the s c a l e s so that t h e mean-noise r e s u l t s fit the averaged s p e c t r a of the l a r g e s t earthquake r e - corded, we a r r i v e at some kind of a definition of a standard l a r g e earthquake. Individual b u r s t s of noise will give r e s u l t s above o r below the average just a s the actual s p e c t r u m of E l Centro fluctuates above and below the smooth c u r v e s of Fig. 1.
The s p e c t r a l density of the noise source used was approximately 2.90volt2/ c p s and the factor k c a m e to 0.51. Thus a l a r g e earthquake may be r e p r e - sented by ground accelerations which a r e "white" i n c h a r a c t e r and have a s p e c t r a l density of 0.75 ft2/sec4/cps.
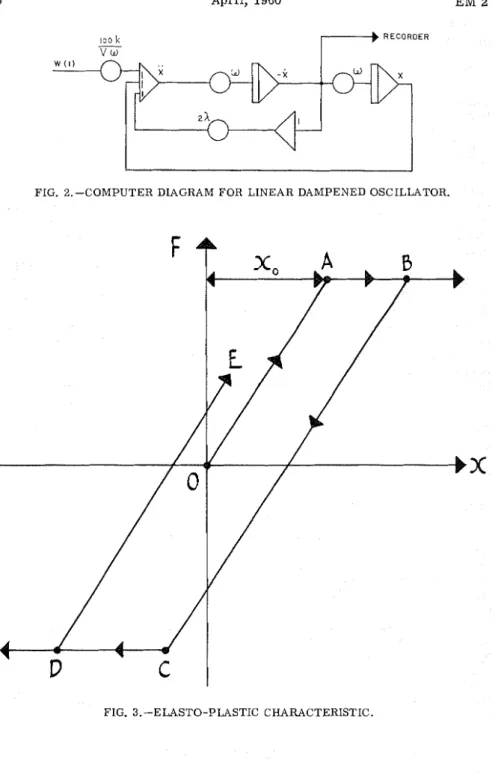
Fig. 2 shows a schematic d i a g r a m of t h e computer, where c i r c l e s a r e po- tentiometers, triangles a r e s u m m e r s , and double-based t r i a n g l e s a r e inte- grators.
E LAST0 -P LASTIC STRUCTURE
It is interesting to compare t h e effect of white noise and an actual e a r t h - quake on a non-linear system. The most important type of non-linearity that
April,
FIG. 2.-COMPUTER DIAGRAM FOR LINEAR DAMPENED OSCILLATOR.
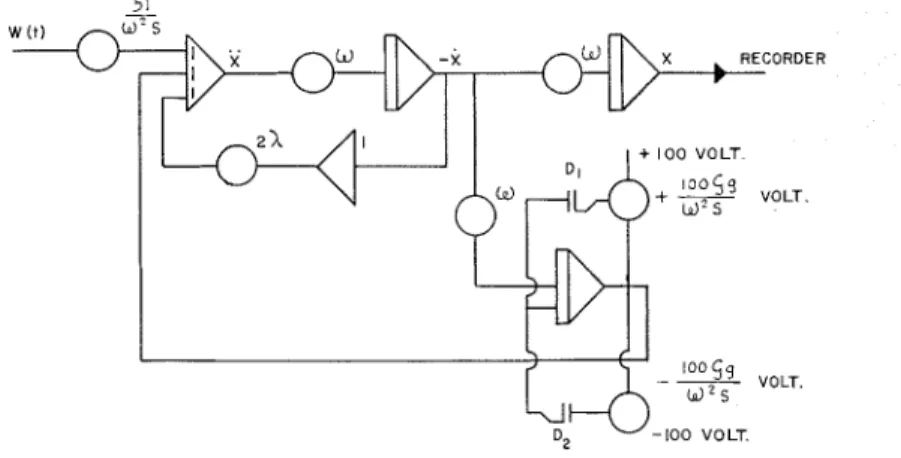
EM 2 EARTHQUAKE REPRESENTATION 7 will o c c u r in a s t r u c t u r e during s e v e r e ground motion will be p l a s t i c yielding. Fig. 3 shows the assumed r e l a t i o n between r e s t o r i n g f o r c e F and displace- ment x. Starting f r o m z e r o with positive velocity, the r e s t o r i n g force is p r o - portional to displacement until the yield point A corresponding t o a displace- ment xo is reached. The r e s t o r i n g f o r c e r e m a i n s constant a t t h i s value until a change in sign of the velocity o c c u r s a t s o m e point B. The displacement A B will be called a yield displacement. The f o r c e F now d e c r e a s e s along a line p a r a l l e l to the e l a s t i c p a r t of the c h a r a c t e r i s t i c and s t a y s o n this line un- t i l C o r perhaps B again is reached. If the velocity s t a y s negative the r e v e r s e yield point C is reached and t h e force s t a y s constant a t this opposite value until the velocity becomes positive again and t h e c h a r a c t e r i s t i c proceeds f r o m D to E. A r e a s enclosed by loops r e p r e s e n t h y s t e r e t i c energy l o s s .
In a r e c e n t paper7 the w r i t e r considers t h e yield d i s p l a c e m e n t s that o c c u r when a n oscillator with t h i s yielding stiffness c h a r a c t e r i s t i c is subject to t h e 1940 E l Centro earthquake. T h e s e yield displacements determined for t h i s specific earthquake a r e now compared with t h e yields a r i s i n g when the s a m e s y s t e m is subjected to b u r s t s of "white" ground a c c e l e r a t i o n of s p e c t r a l density 0.75 ft2/sec4/cps simulating the s t a n d a r d l a r g e earthquake.
The equations of motion may be derived from a consideration of t h e elasto-plastic c h a r a c t e r i s t i c shown in Fig. 3. T h e r e a r e s e p a r a t e equations depending on whether the motion is taking p l a c e i n the e l a s t i c o r the p l a s t i c p a r t of the characteristic. On t h e p l a s t i c p a r t of the c h a r a c t e r i s t i c the r e - tarding f o r c e is constant and h a s the sign of t h e velocity shown by sgn K. On t h e e l a s t i c p a r t of the c h a r a c t e r i s t i c the r e s t o r i n g force must be r e f e r r e d to the changing z e r o position caused by the yielding. The equations of motion are:
and
where p is the algebraic s u m of a l l previous yield d i s p l a c e m e n t s up to the time considered and the sign of the yield displacement taken as that of
k
a t the time. Thus, i n Fig. 3, when working on t h e linear portion D E, the value of p i s A B - C D .It will be m o r e convenient now if the yield point is specified in t e r m s of equivalent acceleration r a t h e r than the displacement xo. Let G b e the,equiva- lent fraction of gravity and then
w 2 x 0 = G g
. . .
(7) If S is t h e expected maximum value of x, and X is the s c a l e d computer v a r i a - ble corresponding to x, then t h e scaled equations become:7 'Earthclualie Yielcl Spectra," by G. N. Bycroft, M. J. Murphy and I<. E. Brown, Proceedings, ASCE, October, 1959.
April, 1960 E M 2
where the ground acceleration has been replaced by the representative noise voltage 0.51 W(t).
These equations were simulated on the computer by the circuit diagram shown in Fig. 4. The stiffness characteristic is provided by the diode-limited integrator. As
x
increases initially the output of the integrator is -X until limited by the diode. If X cpntinues positive the voltage output stays at this constant value. However, i f X changes sign, the integrator s t a r t s subtracting a linearly-increasing quantity and thus provides the t e r m (X-U) until limited in the opposite direction.The output to the recorder is the total displacement of the oscillator from its initial zero at any time. This displacement consists of the elastic dis- placement xo added to the algebraic sum of all previous yield displacements. The maximum value of the algebraic sum of the yield displacements will be called the maximum yield displacement and i s the maximum recorder output minus xo. For various values of linear period T, damping factor A, and yield
FIG. 4.-COMPUTER DIAGRAM FOR ELASTO-PLASTIC OSCILLATOR.
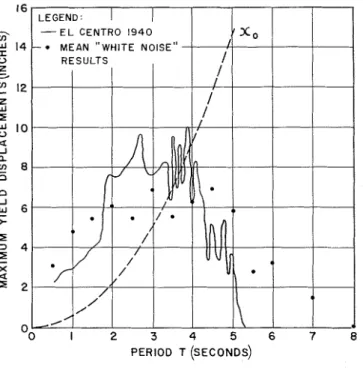
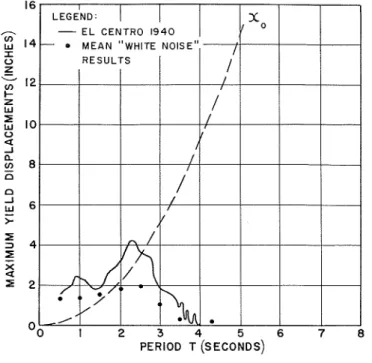
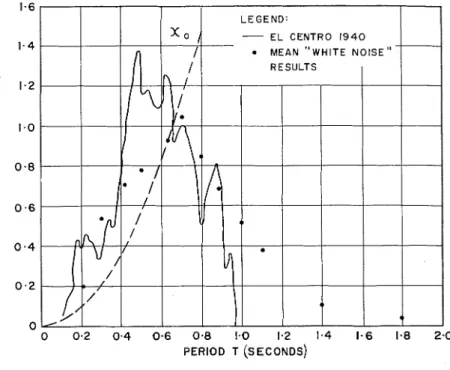
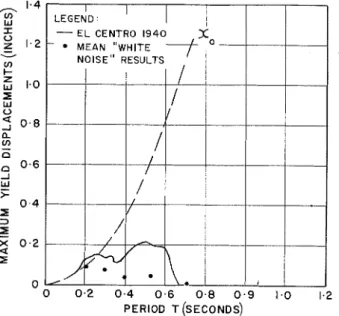
value G, the mean of the maximum yield displacements arising was deter- mined when the system was subjected to ten runs of 25 s e c duration. Fig. 5 to 13 show this mean maximum yield displacement together with the elastic dis-
placement xo. An addition of the two gives the mean maximum total displace- ment. The full lines a r e from the paper mentioned earlier and refer to the 1940 El Centro earthquake. The results from the white noise are shown a s circles.
These results show a remarkable similarity. It is to be remembered that the representative level of the noise was determined from the linear case, andusing this value, i t i s seen that the noise gives similar results as an actual earthquake in this non-linear system.
The double-peaked shape appearing in the cases shown in Figs. 8 and 9 i s also reproduced by the noise and thus must be an essential function of the s y s - tem and not merely of the particular character of the earthquake considered.
EARTHQUAKE REPRESENTATION
FIG. 5.-MAXIMUM YIELD DISPLACEMENTS G = 0.06, h = 0.03.
PERIOD T (SECONDS)
April, EM 2
FIG. 7.-MAXIMUM M E L D DISPLACEMENTS G = 0.06,A = 0.20.
PERIOD T (SECONDS)
EARTHQUAKE REPRESENTATION
PERIOD T (SECONDS)
FIG. 9.-hfAXIMUhl Y I E L D DISPLACEMENTS G = 0 . 1 2 , A = 0.10.
PERIOD T (SECONDS)
12 April, 1960
FIG. 11.-BlAXIMUM Y I E L D DISPLACEBZENTS G = 0.24,A = 0.03.
PERIOD T (SECONDS)
EM 2 EARTHQUAKE REPRESENTATION 13 T h e s e figures, of course, c o m p a r e the mean of the maxima of ten r u n s of noise with t h e maximum of one specific earthquake. Ideally, t h e comparison should be with the a v e r a g e of s e v e r a l earthquakes of equal s p e c t r a l density. Each b u r s t of noise is of the s a m e energy l e v e l but gives a different value of maximum yield lying above o r below the a v e r a g e d values shown. Presumably one individual b u r s t of noise could be found which would c o r r e s p o n d to this one particular earthquake considered.
The probability distribution of the maximum yield was determined in t h r e e c a s e s f r o m one hundred r u n s of noise. These a r e shown i n Figs. 14 to 16, a n d show reasonable probabilities of individual b u r s t s of noise giving values of up
FIG. 13.-hlAXIMUM YIELD DISPLACEMENTS G = 0 . 2 4 , h = 0.20.
to four t i m e s t h e average. This easily accommodates the differences shown between the a v e r a g e noise values and the one p a r t i c u l a r earthquake considered.
CONCLUSIONS
"White noise" a p p e a r s t o be a reasonable simulation of earthquake excita- tion f o r engineering design purposes. T h e technique of simulating a complex s t r u c t u r e on a n analog computer and feeding i t with b u r s t s of noise having a n energy level representative of a l a r g e earthquake is a straight forward method of analyzing a s t r u c t u r e and of assigning probabilities to the v a r i o u s d i s p l a c e - ments. Using t h i s technique i t will be possible t o simulate multi-story s t r u c - t u r e s deflecting i n bending and s h e a r and incorporating yield c h a r a c t e r i s t i c s .
The probability values given i n Figs. 14 t o 16 illustrate an important point. Each b u r s t 'of noise is of the s a m e energy l e v e l but the resulting displace- ments f o r individual s h o t s c a n differ by f a c t o r s of 10 and m o r e . Thus two earthquakes of the s a m e content energy o r magnitude but of different configu- rations may have vastly d i f f e r e n t effects on any p a r t i c u l a r s t r u c t u r e . Also,
E M 2 EARTHQUAKE REPRESENTATION 15
FIG. 15.-PROBABILITY DISTRIBUTION O F MAXIMUM YIELD DISPLACEhlENTS G =0.12, h 0.03, T=2.5.
VALUE
FIG. 16.-PROBABILITY DISTRIBUTION OF MAXIMUM
YIELD DISPLACEMENTS G = 0.21, A 0.10, T =0.20.
one p a r t i c u l a r earthquake may seriously affect a s t r u c t u r e with a certain s e t of p a r a m e t e r s but have little effect on another one. This m a y well be p a r t of the explanation of the inconsistencies noted i n seismic damage.
ACKNOWLEDGMENTS
The w r i t e r is indebted t o the Engineering Analysis and Computation Group of the Division of Mechanical Engineering, N.R.C., Ottawa, f o r the use of t h e i r P.A.C.E. analog computer and to J. B. Milsum for guidance in i t s application. This p a p e r is a contribution from the Division of Building Research, National R e s e a r c h Council of Canada and i s published with the approval of the D i r e c t o r of the Division.
A l i s t cf a l l p u b l i c a t i o n s o f t h e D i v i s i o n o f B u i l d i n & R e s e a r c h i s a v a i l a b l e a n d mey be o b t a i n e d f r o m t h a P u b l i c a t i o n s S e c t i o n , D i v i s i o n o f B u i l d i n g R e s e a r c h , N a t i o n a l R e s e a r c h C o u n c i l , Ottavia, Canada.