HAL Id: hal-02354983
https://hal.archives-ouvertes.fr/hal-02354983
Submitted on 15 Dec 2020HAL is a multi-disciplinary open access
archive for the deposit and dissemination of sci-entific research documents, whether they are pub-lished or not. The documents may come from teaching and research institutions in France or abroad, or from public or private research centers.
L’archive ouverte pluridisciplinaire HAL, est destinée au dépôt et à la diffusion de documents scientifiques de niveau recherche, publiés ou non, émanant des établissements d’enseignement et de recherche français ou étrangers, des laboratoires publics ou privés.
Light-driven synthesis of sub-nanometric metallic Ru
catalysts on TiO2
Joanna Wojciechowska, Elisa Gitzhofer, Jacek Grams, Agnieszka Ruppert,
Nicolas Keller
To cite this version:
Joanna Wojciechowska, Elisa Gitzhofer, Jacek Grams, Agnieszka Ruppert, Nicolas Keller. Light-driven synthesis of sub-nanometric metallic Ru catalysts on TiO2. Catalysis Today, Elsevier, 2019, 326, pp.8-14. �10.1016/j.cattod.2018.07.013�. �hal-02354983�
Light-driven synthesis of sub-nanometric metallic Ru catalysts on TiO
2Joanna Wojciechowska,a,b Elisa Gitzhofer,b Jacek Grams,a Agnieszka M. Ruppert,a and Nicolas Kellerb* a Institute of General and Ecological Chemistry, Faculty of Chemistry, Lodz University of Technology,
ul. Żeromskiego 116, 90-924, Łódź, Poland
b Institut de Chimie et Procédés pour l'Energie, l'Environnement et la Santé, CNRS/University of
Strasbourg, 25 rue Becquerel, 67087 Strasbourg, France
* Corresponding author: nkeller@unistra.fr
Keywords: photodeposition, Ru/TiO2 catalysts, sub-nanometric particle size distribution, reaction
mechanism
Abstract
A one-step room temperature photo-assisted synthesis has been implemented in liquid phase and under solar light for preparing highly dispersed TiO2 supported metallic Ru catalysts, with no need of
final thermal treatment, external hydrogen, or chemical reductant. Whether RuCl3 chloride or Ru(acac)3
acetylacetonate precursor salt was used, sub-nanometric metallic Ru nanoparticles were synthesized on TiO2 with a sharp size distribution, the high dispersion and the metallic nature of the nanoparticles being
evidenced by transmission electron microscopy and X-ray photoelectron spectroscopy. However, the use of the chloride salt was proposed to be more suitable for preparing Ru/TiO2 catalysts, due to the lower
photodeposition efficiency observed with acetylacetonate, that did not allow to synthesize Ru nanoparticles with a loading higher than 1 wt.%. Different reaction mechanisms have been proposed for explaining the behaviour of both TiO2-salt systems during the Ru nanoparticle synthesis, involving
respectively, both holes and electrons charge carriers in oxidation and reduction steps with acetylacetonate, and the sole photogenerated electrons with chloride.
1. Introduction
Heterogeneous catalysis plays a crucial role in many industrial processes and requires in most of the cases the design of tailored supported metal nanoparticles as catalysts [1-2]. Both the size and the morphology of the metallic nanoparticles have a strong influence on the catalytic activity [3], and the preparation of catalysts with suitable nanoparticle size and in turn increased dispersion is desired for implementing catalytic reactions with improved performances [4]. In this frame, the implementation of sustainable preparation methods with fine control in terms of size distribution is of high interest.
The most widely used methods for preparing supported metal catalysts combine the implementation of consecutive elemental operations, with first the introduction of the metal precursor onto the support, achieved usually via incipient wetness or wet impregnation, ion exchange, (co)-precipitation or deposition of a colloidal precursor, further a drying/calcination step, and finally an activation/reduction step to get the supported metallic nanoparticles [5]. The reduction treatment usually consists in a thermal treatment with external hydrogen, or in a chemical reduction in solution with reducing agents such as sodium borohydrate or hydrazine. Depending on the method, the supported catalysts can suffer from heterogeneous metal particle size distributions, from detrimental temperature-activated side-reactions between the metal precursor and the support and from limitations in terms of metal loadings.
The photodeposition synthesis method is an elegant and sustainable alternative to classical methods for preparing small size supported metal nanoparticles, provided that the support is a semi-conductor material. The underlying strategy uses the redox photoactivity of the host semi-conductor activated under suitable irradiation for promoting electrons to the conduction band of the semi-conductor, further able to reduce pre-adsorbed metal ions at the semi-conductor support surface. This can result in the synthesis of well-defined metal nanoparticles on the support material, offering a potential control over the supported nanoparticle size, their distribution and their oxidation state [6]. The method is usually implemented by irradiating a suspension of the semi-conductor support containing the metal precursor salt. This one-step and low-temperature photo-assisted synthesis does not require any final thermal treatment, any external hydrogen, or any chemical reductant. Photodeposition on non-semiconductive supports was also reported, either via direct photochemistry or by photosensitizing the support [7,8].
Early studies have reported on the influence of the synthesis parameters on the metallic nanoparticle morphology and the deposition rate [9]. However, the photodeposition method has been mainly used for synthesizing metallic nanoparticles on a semi-conductor photocatalyst with controlled metal/semi-conductor interface for improving the overall photocatalytic activity of the material in various gas- and liquid-phase reactions. The investigated metals mainly included Ag [10-12], Au [13,14], Pd [15], Pt [7,16] Cu [11,17] and Rh [18], using usually nitrates, chlorides, acetylacetonates and chloric acids as metal precursors, and TiO2 as semi-conductor support, although materials like GaN:ZnO
or BiVO4 were also used. The photodeposition method was used also for preparing thermal catalysts
with enhanced performances when compared to those prepared via classical impregnation or precipita-tion methods, e.g. in the case of mono- and bi-metallic catalysts (Pt, Pt-Ag) on ceria and titania [19-21]. We focused on the synthesis of Ru/TiO2 materials, that are promising heterogeneous catalysts in
many key-reactions involved in the catalytic of biomass towards biofuels, fuel additives or more generally biochemicals. Ru is a metal of choice especially in the hydrogenation of biomass-derived molecules [22], while catalysts supported on TiO2 were proved to be remarkably stable for biomass
conversion reactions. Applying a photodeposition method for synthesizing dispersed Ru nanoparticles on a support remained scarce till now [23-25]. Using TiO2, CeO2, CdS and CuInS2 quantum dots as host
semiconductors and (NH4)3RuCl6 or RuCl3 as Ru salts, most of the studies were targeting the
enhancement of the photocatalyst activity under UV-vis or visible light irradiation. To the best of our knowledge, one single study was focusing on the synthesis of the metallic Ru particles themselves rather than on the activity of the resulting metal/semiconductor photo-catalyst, and in which the hydrogen evolution from a methanol/water mixture was monitored during the photodeposition synthesis on TiO2
using RuCl3 as precursor salt [26]. The authors noticed enhanced hydrogen evolution despite an
inhomogeneous particle distribution was observed on the support.
Therefore, the aim of this paper is to report on the synthesis of sub-nanometric Ru nanoparticles on TiO2 with a sharp size distribution, using a one-step photo-assisted synthesis method under solar light.
Both Ru (III) acetylacetonate and Ru (III) chloride hydrate have been used as precursor salts, as they are the most common precursors used for preparing supported Ru catalysts on a wide variety of supports via the impregnation method with final reduction in temperature under hydrogen.
2. Experimental
2.1. Ru/TiO2 material preparation
Aeroxide© P25 TiO
2 (Evonik) has been used as TiO2 support for synthesizing the Ru/TiO2 catalysts
under solar light irradiation. Ruthenium (III) acetylacetonate (Ru(acac)3, 97%, Sigma-Aldrich) and
ruthenium (III) chloride hydrate (RuCl3•xH2O, min 40% Ru content, Sigma-Aldrich) were used as
ruthenium precursor salts. Dissolution of the Ru(acac)3 precursor was achieved in distilled water under
stirring at 50oC for 2 days, whereas the RuCl
3 precursor was dissolved under stirring in 10 ml of
methanol for 12 h, prior to the addition of 90 ml of distilled water to give a methanol:water ratio of 1:9 v/v. In each experiment, 100 mg of TiO2 support was dispersed under stirring in 100 mL of ruthenium
solution in a beaker-type glass reactor, with a salt concentration depending on the targeted Ru content to be achieved in the Ru/TiO2 material. Prior to irradiation, the suspension was stirred in the dark for 2 h to
ensure the establishment of the adsorption-desorption equilibrium. In the case of Ru(acac)3, pH value of
the suspension was adjusted with NaOH to pH=10. A typical photodeposition synthesis was performed at a TiO2 concentration of 1 g/L by exposing the suspension under stirring to a 500 W/m2 solar light
irradiation within an ATLAS Suntest XLS+ reaction chamber (Xenon arc lamp NXE 2201). The deposition was followed by UV-vis spectrophotometry using a Cary 100Scan Varian spectrophotometer monitoring the disappearance of the main absorption peak at l=272 nm and l=324 nm for Ru(acac)3
and RuCl3 salts, respectively. After completion of the process, the suspended catalysts were recovered
by filtration and dried at 100oC for 1 h.
2.2. Complementary tests for mechanistic study
Ca-modified TiO2 was synthesized according to a sol-gel method in basic conditions using titanium
tetraisopropoxide (TTIP, 97%, Sigma-Aldrich) and calcium nitrate (Ca(NO3)2·4H2O, 99%,
Sigma-Aldrich). First, TTIP was added to a 40 mL ethanolic solution of calcium nitrates, with a calcium content corresponding to 1 wt.% and 10 wt.% relatively to TiO2, before a similar volume of water was
added dropwise to solution. After rectification of the pH to 9 by adding ammonia, the solution was left under agitation at room temperature until dry paste was obtained. The resulting powder was further dried and finally calcined at 500°C in static air for 3 h with a heating rate of 5oC/min to form the Ca-TiO
2
supports.
The photocatalytic degradation of Diuron© (3-(3,4-dichlorophenyl)-1,1-dimethyl-urea) (C9H10Cl2N2O, 98%, Sigma-Aldrich) has been performed under simulated solar light irradiation. In each
experiment, 100 mg of the photocatalyst (TiO2 or Ca-modified TiO2) was dispersed under stirring in 100
mL Diuron aqueous solution at 10 mg/L and exposed to a 250 W/m2 solar light irradiation. Prior to
irradiation, the suspension was stirred in the dark for 1 h to ensure the establishment of the adsorption-desorption equilibrium. The Diuron concentration was monitored by UV-visible spectrophotometry via the disappearance of the absorption peak at l = 248 nm [27]. Methanol (99.8%) and potassium persulfate (K2O2S8, > 99%) were purchased from Sigma–Aldrich.
2.3. Characterisation
The ruthenium content in the catalysts was determined by inductively coupled plasma optical emission spectroscopy (ICP-OES).
The Ru nanoparticle size distribution of Ru/TiO2 samples was determined by transmission electron
microscopy (TEM) performed using a JEOL 2100F with a point resolution of 0.2 nm. The samples were sonically dispersed in an ethanol solution before a drop of the solution was deposited onto a copper grid covered by a holey carbon membrane for observation. The size distributions were calculated for each sample by averaging 300 particles from the TEM images using ImageJ software.
X-Ray Photoelectron Spectroscopy (XPS) characterization was performed on a ThermoVGMultilabESCA3000 spectrometer (Al Kα anode at hλ = 1486.6 eV). The energy shift due to electrostatic charging was subtracted using the adventious sp2 carbon C 1s band at 284.6 eV.
Contributions with Doniach–Sunjic shape [28] and a’ S-shaped’ Shirley type background [29] were used. Surface atomic ratios were derived using the appropriate experimental sensitivity factors [30].
3. Results and discussion
3.1. Photoassisted synthesis of Ru/TiO2 materials
A series of ruthenium catalysts has been prepared using both hydrated RuCl3 and Ru(acac)3 salts as
metallic precursors targeting a nominal Ru concentration from 0.5 wt.% to 2 wt.%. The disappearance with time of both Ru precursor salts using TiO2 P25 as semi-conductor support is shown in Figure 1.
First, whatever the precursor salt used, no significant degradation of the ruthenium salt has been observed under solar light in the absence of catalyst, indicating that the photolysis of the ruthenium precursor can be neglected in the experimental conditions. The evolution with time of the relative concentration demonstrated that the photocatalytic degradation of the Ru(acac)3 and RuCl3 species
occurred on the TiO2 material. It evidenced the influence of both the ruthenium concentration and the
ruthenium salt nature on the kinetics of the ruthenium salt degradation. At a given Ru content, a faster degradation was observed with the chloride salt when compared to the acetylacetonate salt, a reaction time of 100 min and over 200 min being necessary for achieving a full disappearance of the Ru precursor at a content of 0.5 wt.% using the chloride and acetylacetonate salts, respectively. As expected, the reaction time increased with increasing the Ru concentration, so that no complete Ru photodeposition was achieved with the acetylacetonate salt for a Ru content of 2 wt.%. Therefore the use of the chloride salt precursor is proposed to be more suitable than that of the acetylacetonate for preparing Ru/TiO2 catalysts with high ruthenium loadings.
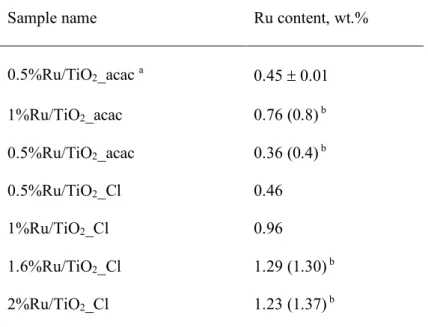
Table 1 shows the real metal content of the materials after the photoassisted deposition. By stopping some photodeposition experiments before the full disappearance of the UV-vis absorption signal corresponding to the Ru salt, a good agreement was obtained between the measured Ru content and the theoretical one derived from the evolution of the UV-vis absorption signal, with a relative difference being at the maximum of about 10%. So, the results obtained showed that the direct monitoring of the Ru salt disappearance by UV-Vis spectrophotometry was a suitable and fast method for determining the Ru content of the Ru/TiO2 materials prepared, with no need of implementing
3.2 Characterization of the Ru/TiO2 materials
Figure 2 shows TEM images with the corresponding histograms of the Ru nanoparticle size distribution for Ru/TiO2 catalysts prepared with both RuCl3 and Ru(acac)3 salts as metallic precursors
with a Ru concentration of 0.5 wt.% and 1 wt.%. First, similar mean particle sizes were obtained whether the acetylacetonate or the chloride form of the Ru salt was used, despite the difference in terms of chemical nature of the salt. In both cases, small ruthenium nanoparticles were synthesized on the TiO2
support with a sub-nanometric and sharp particle size distribution centered on 0.6-0.7 nm. The supported nanoparticles were homogeneously dispersed and no ruthenium nanoparticle aggregates were formed. Beside the mean particle size, the size distribution, characterized by the Full Width at Half Maximum (FWHM), is another important parameter characterizing the particle size distribution. Although the distribution remained in both cases very narrow, the supported Ru nanoparticles prepared with the acetylacetonate salt displayed a slightly broader particle size distribution when compared to that obtained with the chloride counterpart, with a FWHM of 0.35-0.4 vs. 0.25. However, it was remarkable that increasing the Ru content did not result neither in an increase in the mean particle size, nor in its broadening. Further, performing the TEM image analysis through different operators allowed us to rule out the critical operator influence in the establishment of reliable particle size distributions, similar mean particle size and FWHM being obtained whatever the operator for two acetylacetonate and chloride salt derived samples. The nanoparticle size distribution obtained differed strongly from that achieved on a Ru/TiO2 reference sample, prepared by classical incipient wet impregnation from Ru(acac)3 in methanol
solution and final thermal reduction in hydrogen, for which a considerably broader size distribution was achieved (FWHM of 1.0 nm) together with a larger mean particle size of 1.3 nm (Figure 3) [31]. This could open the possibility of preparing Ru/TiO2 catalysts with high metal loadings, eg. 5 wt.% of Ru,
while maintaining a high monodispersity at the support surface.
The metallic nature of the Ru nanoparticles synthesized on the TiO2 support was confirmed by
TEM analysis and XPS surface characterization (Figure 4). TEM image evidenced an interplane distance of 2.1 Å in the Ru nanoparticles, that corresponds to the interplane distance of (101) planes of metallic Ru [32]. Whatever the Ru precursor used, the Ru 3p1/2 orbital XPS spectra shown for the Ru(0.5
eV) and Ru4+ (488.7 eV) species at the surface [33]. Despite a more complex multi-contribution profile
due to the binding energy overlap between both C 1s and Ru 3d XPS spectra, the Ru 3d spectra confirmed the presence of two Ru species (280.2 eV for Ru0 and 281.9 eV for Ru4+), with the presence
of two Ru 3d5/2 - Ru 3d3/2 orbital doublet contributions with spin orbit splitting of 4.1 eV, in addition to
the contributions resulting from the contamination carbon [33]. By combining both Ru 3p and the Ru 3d spectra results, the ratio of atomic concentrations between Ru0 and Ru4+ has been estimated at 70/30 ± 7,
and it was observed that the oxidation state of ruthenium species at the TiO2 surface was not influenced
by the precursor salt used. Also, whatever the salt used, the Ru(0.5 wt.%)/TiO2 material had a Ru/Ti
surface atomic ratio of ca. 0.02 confirming that the Ru nanoparticle size distribution was not affected by the choice of the metallic salt. Given an average Ru particle size derived from TEM images of 0.6 nm and the interlayer distance between the atomic (101) planes of metallic Ru, we could in a first approximation consider that the ruthenium nanoparticles supported on TiO2 consisted in average in
about 3-4 atomic layers only. Taking into account the Ru0/Ru4+ ratio derived from XPS and the fact that
Ru undergoes oxidation very easily when exposed to the air, we suppose that the Ru4+ species evidenced
by XPS corresponded to the presence of one monolayer resulting from a natural surface oxidation. In addition, the Cl 2p XPS spectra did not reveal the presence of any residual chlorine species at the surface when the sample was prepared from the chloride precursor (not shown).
3.3. Mechanistic studies
The strong influence of the nature of the Ru precursor salt used on the degradation kinetic taking place during the metallic Ru photodeposition on the TiO2 support led to propose that different
photodeposition mechanisms could occur for both Ru precursors. Based on the study of Naya et al. on the preparation of Cu/BiVO4 photocatalysts from Cu acetylacetonate salt [34], the following mechanism
involving both photogenerated holes and electrons can be proposed for the synthesis of metallic Ru nanoparticles on the TiO2 support in the case of the Ru acetylacetonate precursor salt:
TiO2 + Ru(acac)3 ↔ Ru(acac)3ad ·―·TiO2 (1)
Ru(acac)3ad + 3h+ → Ru3+ + (acac)ox + H+ (3)
Ru3+ + 3e- → Ru0 (4)
According to this mechanism, the first step is the adsorption of the Ru acetylacetonate precursor at the titania surface. The adsorbed Ru acetylacetonate can be oxidized, either directly by the photogenerated holes from the valence band or indirectly by the OH° hydroxyl radicals resulting from the oxidation by the holes of adsorbed water or surface -OH groups. The adsorbed Ru3+ ions generated
by the ligand oxidation can be further reduced into metallic Ru by the photogenerated electrons from the conduction band. In the case of copper, the reduction of Cu2+ into metallic Cu was, reported to be easier
than the direct reduction of Cu(acac)2 [34].
By contrast to the mechanism proposed for the acetylacetonate that involves both holes and electrons charge carriers in oxidation and reduction steps, respectively, only electrons would be involved in the case of the RuCl3 precursor, since the RuCl3 salt is present in aqueous solution as a mixture of
various ruthenium chlorohydroxides [35].
In the attempt to support the above hypothesis, a series of complementary experiments was carried out, on one hand by voluntarily reducing the oxidative photoactivity of the TiO2 support by synthesizing
Ca-modified TiO2 photocatalysts, and on another hand by adding to the reaction media controlled
amounts of hole and electron scavengers, methanol and potassium persulfate, respectively [36]. In parallel to the synthesis of Ru nanoparticles, the well-known degradation of the Diuron herbicide has been used as test reaction of oxidation photocatalysis in aqueous phase [37].
Figure 5A and B shows respectively the influence of the addition of methanol on the Diuron degradation and on the Ru photodeposition from Ru(acac)3 using TiO2 P25. Adding methanol as hole
scavenger slowed down strongly the degradation of the Diuron molecule, as expected, the methanol scavenger reacting with holes or hydroxyl radicals at the TiO2 surface. A similar behaviour was
observed in the case of Ru(acac)3 degradation, with a slowdown of the Ru photodeposition. In both
cases, higher the concentration of methanol, more pronounced the effect. This confirmed that the photodeposition of Ru was controlled by oxidation reactions when acetylacetonate was used as reactant, and that photogenerated holes were involved in the photodeposition mechanism, either directly or
indirectly by generating oxidative hydroxyl radicals, in a similar way than for the photocatalytic degradation of carbon-containing pollutants in water. We further tested this hypothesis by performing both reactions on deactivated TiO2 photocatalysts, synthesized by modifying TiO2 with calcium ions.
First, Figure 5C evidenced that the oxidative degradation of the Diuron reactant was strongly reduced on Ca-modified TiO2 photocatalysts compared to the Ca-free TiO2 reference, with a decrease in the
apparent kinetic rate constant from 5.7 102 min-1 on TiO
2 P25 down to 1.7 10-3 min-1 on
Ca(10%)-modified TiO2 according to a pseudo first-order kinetics in a Langmuir-Hinshelwood model So, higher
the Ca content, weaker the oxidation ability of the photocatalyst, almost no degradation being observed on the photocatalyst containing 10% of calcium for 45 min of reaction. In the case of the photodeposition with Ru(acac)3, it has been observed that weaker the oxidation ability of the
photocatalyst, slower the Ru photodeposition process (Figure 5D). The similarity of behaviour observed for both reactants confirmed the involvement of photogenerated holes and more globally of oxidation reactions at the TiO2 support surface in the photodeposition mechanism when acetylacetonate was used
as reactant.
By contrast, Figure 5E shows that TiO2 photocatalysts with weak oxidation ability were still able to
perform the Ru photodeposition using chloride as reactant. Further, increasing the amount of calcium in the Ca-modified TiO2 photocatalyst resulted in a strongly accelerated Ru photodeposition, although it
reduced drastically the Diuron degradation. This behaviour was attributed to the extended lifetime of the photogenerated electron charge carrier that would lead to a better availability of electrons at the surface of the photocatalyst for reducing the Ru chloride precursor into metallic Ru. This enhanced lifetime would result from an extended consumption of the photogenerated holes by the deactivated Ca-TiO2
material it-self. Further, performing the Ru photodeposition with the chloride salt in the presence of potassium persulfate used as electron scavenger showed that increasing the concentration of K2S2O8
strongly slowed down the photodeposition process on TiO2 P25, evidencing the direct involvement of
the photogenerated electrons in the degradation of the RuCl3 precursor salt (Figure 5F).
TOC measurements have been implemented for confirming further the proposed mechanism in the case of the Ru(acac)3 precursor. A photodeposition experiment targeting the synthesis of Ru
the reactional media, has been stopped at a photodeposition efficiency of 80%. At this point, the aqueous reaction media contained 8 ppm of TOC, while a complete mineralization of the acetylacetonate ligands into CO2 would correspond to the residual presence of 3 ppm of TOC. This result means that both partial
oxidation of the acetylacetonate ligands and mineralization to CO2 occurred during the photodeposition
process. The TiO2 photocatalyst could consequently suffer from competitive adsorption between the Ru
acetyacetonate reactant and the partially oxidized ligands that could either block the TiO2 surface or
adsorb for being further photocatalytically degraded into CO2. This adsorption competition effect could
explain the strong slowing down of the photodeposition process observed when increasing the starting concentration of the Ru(acac)3 reactant.
The lower photodeposition rate in the case of the acetylacetonate vs. chloride precursor was then proposed to directly result from the different reaction mechanism taking place, with the establishment of competitive adsorption and oxidation phenomena between the Ru acetyacetonate reactant and the partially oxidized acetyacetonate ligands that are formed during the oxidative steps of the photodeposition process. This led to a partial deactivation of the TiO2 photocatalyst, and then to lower
photodeposition rates. Also the Ru acetylacetonate salt could suffer from a lower adsorption at the TiO2
surface, most probably due to its non-ionic character. By contrast, the Ru photodeposition from the RuCl3 precursor was taking advantage of the favored adsorption of the hydrolytic products of the RuCl3
salt in water, as visualized by the strong pre-adsorption taking place during the initial dark equilibrium period.
4. Conclusions
An elegant low-temperature one-step photo-assisted method has been developed as sustainable alternative to the classical wet impregnation of the support, for synthesizing highly dispersed metallic Ru nanoparticles on TiO2, using the redox photoactivity developed by the TiO2 support under solar light.
Whether the chloride or the acetylacetonate salt was used as Ru precursor, sub-nanometric metallic Ru nanoparticles were synthesized on the TiO2 support with a sharp size distribution. TEM and XPS
chloride salt was proposed to be more suitable than the acetylacetonate salt for preparing Ru/TiO2
catalysts, due to the lower photodeposition efficiency observed with acetylacetonate, that did not allow to synthesize Ru nanoparticles with a loading higher than 1 wt.% in contrary to the chloride salt.
It has been proposed that different reaction mechanisms take place at the TiO2 surface depending on
the Ru precursor salt used. In the case of the acetylacetonate precursor, the photo-assisted synthesis mechanism has been discussed to involve both holes and electrons in oxidation and reduction steps respectively, the first necessary step being the photocatalytic oxidation of the acetylacetonate ligand. By contrast, the sole photogenerated electrons would be involved in the case of the chloride salt.
Acknowledgments
The French Embassy in Poland is thanked for supporting the PhD work of J.W. via a French Government Grant. D. Ihiawakrim (IPCMS, Strasbourg) is acknowledged for performing TEM characterization. P. Garcia-Munoz (ICPEES) is thanked for performing TOC analysis.
References
[1] P.S. Nigam, A. Singh, Prog. Energy Combust. Sci. 37 (2011) 52-68.
[2] H. Kobayashi, T. Komanoya, S.K. Guhaa, K. Haraa, A. Fukuoka, Appl. Catal. A : Gen. 410 (2011) 13-20.
[3] V. V Pushkarev, N. Musselwhite, K. An, S. Alayoglu, G. Somorjai, Nano Lett. 12 (2012) 5196-5201.
[4] E. Auer, A. Freund, J. Pietsch, T. Tacke, Appl. Catal. A Gen. 173 (1998) 259-271. [5] F. Pinna, Catal. Today 41 (1998) 129-137.
[6] K. Wenderich, G. Mul, Chem. Rev. 116 (2016) 14587-14619.
[7] C. Crisafulli, S. Scirè, S. Giuffrida, G. Ventimiglia, R. Lo Nigro, Appl. Catal. A Gen. 306 (2006) 51-57.
11537-11546.
[9] C.J. Xi, Z.S. Chen, Q.L. Li, Z.S. Jin, J. Photochem. Photobiol. A-Chem. 87 (1995) 249-255. [10] A. Dobosz, A. Sobczyński, Water Res. 37 (2003) 1489-1496.
[11] G. Wu, N. Guan, L. Li, Catal. Sci. Technol. 1 (2011) 601.
[12] S. Parastar, S. Nasseri, S.H. Borji, M. Fazlzadeh, A.H. Mahvi, A.H. Javadi, M. Gholami, Desalin. Water Treat. 51 (2013) 7137-7144.
[13] A. Tanaka, S. Sakaguchi, K. Hashimoto, H. Kominami, Catal. Sci. Technol. 2 (2012) 3-5. [14] A. Tanaka, S. Sakaguchi, K. Hashimoto, H. Kominami, Catal. Sci. Technol. 4 (2014) 1931-1938. [15] R. Camposeco, S. Castillo, I. Mejia-Centeno, J. Navarrete, J. Marin, Mater. Charact. 95 (2014)
201-210.
[16] M. Maicu, M.C. Hidalgo, G. Colón, J.A. Navío, J. Photochem. Photobiol. A Chem. 217 (2011) 275-283.
[17] A.J.J. Lennox, P. Bartels, M.M. Pohl, H. Junge, M. Beller, J. Catal. 340 (2016) 177-183. [18] K. Maeda, D. Lu, K. Teramura, K. Domen, Energy Environ. Sci. 3 (2010) 471-478.
[19] Y. Han, J. Zhou, W. Wang, H. Wan, Z. Xu, S. Zheng, D. Zhu, Appl. Catal. B, Environ. 125 (2012) 172-179.
[20] S. Scirè, C. Crisafulli, S. Giuffrida, C. Mazza, P.M. Riccobene, A. Pistone, G. Ventimiglia, C. Bongiorno, C. Spinella, Appl. Catal. A Gen. 367 (2009) 138-145.
[21] S. Scirè, C. Crisafulli, S. Giuffrida, G. Ventimiglia, C. Bongiorno, C. Spinella, J. Mol. Catal. A Chem. 333 (2010) 100-108.
[22] A.M. Ruppert, K. Weinberg, R. Palkovits, Angew. Chemie 51 (2012) 2564-2601. [23] T.-L. Li, C.-D. Cai, T.-F. Yeh, H. Teng, J. Alloys Compd. 550 (2013) 326-330.
[24] E. Grabowska, M. Diak, T. Klimczuk, W. Lisowski, A. Zaleska-Medynska, Mol. Catal. 434 (2017) 154-166.
[25] S. Mississippi, Photochemistry 15 (1923) 1921-1923.
[26] A. Sobczynski, T. Jakubowska, S. Zielinski, Monatshefte Fur Chemie Chem. Mon. 120 (1989) 101-109.
24 (2017) 15622-15633.
[28] S. Doniach, M. Sunjic, J. Phys. C Solid State Phys. 3 (1970) 285-291. [29] D.A. Shirley, Phys. Rev. B. 5 (1972) 4709-4714.
[30] C.D. Wagner, L.E. Davis, M.V. Zeller, J.A. Taylor, R.M. Raymond, L.H. Gale, Surf. Interface Anal. 3 (1981) 211.
[31] A.M. Ruppert, J. Grams, M. Jędrzejczyk, J. Matras-Michalska, N. Keller, K. Ostojska, P. Sautet, ChemSusChem. 8 (2015) 1538-1547.
[32] B. Coşkuner Filiz, E.S. Gnanakumar, A. Martínez-Arias, R. Gengler, P. Rudolf, G. Rothenberg, N.R. Shiju, Catal. Letters. 147 (2017) 1744-1753.
[33] A.M. Ruppert, M. Jędrzejczyk, O. Sneka-Płatek, N. Keller, A.S. Dumon, C. Michel, P. Sautet, J. Grams, Green Chem. 18 (2016) 2014-2028.
[34] S.I. Naya, M. Tanaka, K. Kimura, H. Tada, Langmuir 27 (2011) 10334-10339.
[35] M.M. Taqui Khan, G. Ramachandralah, A. Prakash Rao, Inorg. Chem. 25(5) (1986) 665-670. [36] A. Syoufian, K. Nakashima, J. Colloid Interface Sci. 313 (2007) 213-218.
[37] S. Malato, J. Caceres, A.R. Fernandez-Alba, L. Piedra , M.D. Hernando, A. Aguera, J. Vial, Environ. Sci. Technol. 37 (2003) 2516-2524.
Table 1. Ru content in Ru/TiO2 materials analyzed by ICP-OES.
Sample name Ru content, wt.%
0.5%Ru/TiO2_acac a 0.45 ± 0.01 1%Ru/TiO2_acac 0.76 (0.8) b 0.5%Ru/TiO2_acac 0.36 (0.4) b 0.5%Ru/TiO2_Cl 0.46 1%Ru/TiO2_Cl 0.96 1.6%Ru/TiO2_Cl 1.29 (1.30) b 2%Ru/TiO2_Cl 1.23 (1.37) b
a accuracy determined by performing twice the photoassisted synthesis of the Ru/TiO
2 sample.
b theoretical Ru content deposited calculated from the conversion of the Ru acetylacetonate or chloride
salt derived from the UV-vis absorption spectra, when stopping the photodeposition experiment before the full disappearance of the UV-vis absorption signal corresponding to the Ru salt.
Figure 1
Fig.1. Disappearance of the Ru precursor in the presence of TiO2 as a function of the illumination time
for a) Ru(acac)3 and b) RuCl3 salts, with a Ru content of 0.5, 1 and 2 wt.%. Inset: Examples of UV-vis
absorbance spectra evolution as a function of the illumination time during the photo-assisted synthesis.
-60
0
60
120
180
0.0
0.2
0.4
0.6
0.8
1.0
200 300 400 500 600 0.0 0.2 0.4 0.6 0.8 1.0 1.2 1.4 0 min 10 min 50 min 100 min 150 min 200 min Abso rban ce , u .a. Wavelength, nm 272 nm0.5% Ru without TiO
22%Ru/P25
0.5%Ru/P25
C/C
0
t, min
1%Ru/P25
a)
dark
-60
0
60
120
180
0.0
0.2
0.4
0.6
0.8
1.0
dark
200 300 400 500 0.00 0.05 0.10 0.15 0.20 -60 min 0 min 30 min 60 min 80 min 120 min Abso rban ce , a .u . Wavelength, nm 324 nmb)
0.5%Ru/P25
1%Ru/P25
2%Ru/P25
0.5% Ru without TiO
2C/C
0
t, min
Figure 2
0.0 0.4 0.8 1.2 1.6 2.0 0 10 20 30 40 50 60 a) Frequency, % Particle diameter, nm d = 0.6 nm FWHM = 0.35 0.0 0.4 0.8 1.2 1.6 2.0 0 10 20 30 40 50 60 b) Frequency, % Particle diameter, nm d = 0.7 nm FWHM = 0.40 0.0 0.4 0.8 1.2 1.6 2.0 0 10 20 30 40 50 60 70 c) Frequency, % Particle diameter, nm d = 0.6 nm FWHM = 0.27 0.0 0.4 0.8 1.2 1.6 2.0 0 10 20 30 40 50 60 70 d = 0.6 nm Freque ncy, % Particle diameter, nm FWHM = 0.25 d) 0.0 0.4 0.8 1.2 1.6 2.0 0 10 20 30 40 50 60 70 e) FWHM = 0.23 d = 0.5(5) nm Frequency, % Particle diameter, nm 0.0 0.4 0.8 1.2 1.6 2.0 0 10 20 30 40 50 60 70 f) Frequency, % Particle diameter, nm d = 0.7 nm FWHM = 0.27Fig.2. TEM images and the corresponding histograms of the Ru nanoparticle size distribution for Ru/TiO2 catalysts: a) 0.5%Ru_acac, b) 1%Ru_acac, c) 0.5%Ru_Cl, d) 1%Ru_Cl, e) 1%Ru_Cl derived
from TEM image analysis by another operator, f) 1%Ru_acac derived from TEM image analysis by another operator.
Figure 3
Fig.3. TEM image and the corresponding Ru particle size distribution of 1%Ru/TiO2 prepared by
classical impregnation using Ru(acac)3 with final reduction in hydrogen at 200°C.
0.0 0.8 1.6 2.4 3.2 4.0 4.8 5.6 0 10 20 30 40 FWHM = 1.0 d = 1.3 nm Frequency, % Particle diameter, nm
Figure 4
Fig.4. (A) TEM image of Ru/TiO2 with the measured interplane distance of (101) planes of metallic Ru;
(B) Ru 3p and (C) Ru 3d + C 1s XPS profiles of the Ru(0.5 wt.%)/TiO2 catalysts.
494 492 490 488 486 484 482 480 (B) Ru4+ Ru0 0.5%Ru/TiO2_Cl Binding energy, eV 0.5%Ru/TiO2_acac Ru 3p1/2 278 280 282 284 286 288 290 (C) Ru 3d/C 1s 0.5%Ru/TiO2_Cl 0.5%Ru/TiO2_acac Binding energy, eV Ru0 Ru4+ (A)
Figure 5
Fig.5. Photodegradation kinetics for (a) Diuron and (b) Ru(acac)3, on TiO2 P25 as a function of the
MeOH concentration; (c) Diuron and (d) Ru(acac)3, on Ca-modified TiO2 photocatalysts ; (e)
Photo-degradation kinetics for hydrated RuCl3 salt on Ca-modified TiO2 photocatalysts ; (f) Influence of the
0 20 40 60 80 100 0.0 0.2 0.4 0.6 0.8 1.0 without MeOH 0.005vol% MeOH 0.025vol% MeOH C/C 0 t, min 1vol% MeOH a) 0 20 40 60 0.4 0.6 0.8 1.0 b) without MeOH 0.012vol% MeOH 1vol% MeOH C/C 0 t, min 0 20 40 0.0 0.2 0.4 0.6 0.8 1.0 TiO2(P25) 1%Ca-TiO2 C/C 0 t, min 10%Ca-TiO2 c) 0 20 40 60 80 100 0.0 0.2 0.4 0.6 0.8 1.0 10%Ca-TiO2 1%Ca-TiO2 TiO2(P25) C/C 0 t, min d) -60 -40 -20 0 20 40 60 80 0.0 0.2 0.4 0.6 0.8 1.0 e) C/C 0 t, min TiO2(P25) 1%Ca-TiO2 10%Ca-TiO2 dark -60 -40 -20 0 20 40 60 80 0.0 0.2 0.4 0.6 0.8 1.0 dark f) C/C 0 t, min K2O2S8/RuCl3= 1 K2O2S8/RuCl3 = 0.5 TiO2(P25) without K2O2S8
K2O2S8 concentration on the photodegradation kinetics for the hydrated RuCl3 salt on TiO2 P25. In the
case of RuCl3 (e-f), the photodeposition experiments were started after the adsorption/desorption dark
equilibrium was reached. No strong adsorption being observed using Diuron and Ru(acac)3, the dark