Critical Role of Histone Tail Entropy in Nucleosome Unwinding
ByThomas T. Parsons
B.S., Biochemistry University of Notre Dame, 2016
Submitted to the Department of Chemistry in Partial Fulfillment of the Requirements for the Degree of
MASTER OF SCIENCE IN CHEMISTRY
at the
Massachusetts Institute of Technology June 2018
@
2018 Massachusetts Institute of Technology. All rights reserved.Signature of Author: Certified by:
Signature redacted
Signature redacted
Department of Chemistry May 1, 2018 Accepted by: Bin Zhang Assistant Professor of Chemistry Thesis SupervisorSignature redacted
V
Robert FieldHaslam and Dewey Professor of Chemistry Chairman, Departmental Committee on Graduate Students MASSACHUSETTS INSTITUTE
OF TECHNOLOGY
JUN 2
0
2018
LIBRARIES
Critical Role of Histone Tail Entropy in Nucleosome Unwinding
ByThomas T. Parsons
Submitted to the Department of Chemistry on May 1, 2018 in Partial Fulfillment of the
Requirements for the Degree of Master of Science in Chemistry
Abstract
As the fundamental packaging unit for the genome, the nucleosome is of central importance for many essential biological processes and has been the focus of numerous research efforts. The dynamics of the nucleosome is of particular interest as it must be balanced to maintain long-lasting genome stability while keeping the DNA accessible to protein molecules. Using a transferable protein-DNA model and advanced sampling techniques, we investigated the stability and dynamics of the nucle-osome by determining the free energy cost of its DNA unwinding. Simulation results quantitatively reproduce thermodynamic parameters estimated from single-molecule force spectroscopy experi-ments, and capture the appearance of a large energetic barrier as the system transitions from the outer to the inner layer of DNA unwinding. Analysis of partially unwound nucleosome configura-tions at atomic resolution revealed that the transition barrier arises from a delayed loss of contacts between histone tails and the DNA. Surprisingly, there is a significant entropic contribution from the same set of disordered tails that largely offset the energetic barrier. Our study greatly improves the current understanding of nucleosome unwinding by providing detailed mechanistic insights into experimental observations.
Thesis Supervisor: Bin Zhang
Contents
1 Background2 Results and Discussion
2.1 Free energy landscape of nucleosome unwinding . . . . 2.2 Entropic contributions to nucleosome unwinding . . . . 2.3 Histone tails safeguard the inner layer . . . ... . . . . 2.4 Histone tails regulate asymmetric outer layer unwinding . . . . 3 Conclusions
4 Future Work
4.1 Molecular Determinants of Asymmetic vs Symmetric 4.2 Applications to Chromatin Fiber Modeling . . . . . 5 Methods
5.1 Coarse-Grained Protein-DNA Model . . . . 5.2 Simulation Details . . . . 5.3 Tailless nucleosome system . . . . 5.4 Thermodynamic calculations . . . . 5.5 Nucleosome coordinate system . . . .
Unwinding . . . . . . . . . . . . . . . . . . . . . . . . . . . . 6 Appendix: Supplemental Figures
7 References 4 5 5 7 10 13 15 16 16 17 18 18 19 20 21 21 23 33
1
Background
One important task that every cell faces is to organize its genome into a confined nucleus while keeping the genetic information accessible [1, 2]. Eukaryotes overcome this challenge by packaging the genome into chromatin, a dynamic structure that can adjust its compactness depending on the functional state of the underlying DNA [3, 4]. Chromatin, in turn, is composed of nucleosomes -147 base pairs of DNA wrapped 1.7 times around a histone octamer in a left-handed superhelix [5, 6]. As the fundamental organizational unit of the genome, the nucleosome plays a crucial role in all DNA templated processes, including transcription, replication, repair, etc. Using extensive computer simulations, we quantitatively investigate the nucleosome stability and provide high-resolution structural characterizations of the nucleosome disassembly pathway.
Formation of nucleosomes helps to fit the genome inside the nucleus, but also occludes the bind-ing of protein molecules to the DNA. Therefore, the first step in virtually all molecular processes that control the genome function involves the unwinding of nucleosomal DNA, a dynamical transi-tion that has been the focus of many experimental and theoretical studies [7-19]. Single-molecule experiments, in particular, have provided quantitative insight into the unwinding process by deter-mining its thermodynamic and kinetic parameters. A consensus picture that emerges from these studies is a three-stage model in which the outer layer of DNA unwinds reversibly at low forces, while unwinding of the inner layer occurs at much higher forces and is followed by the irreversible release of the histone proteins [7, 20]. Strikingly, a large energetic barrier has been estimated to separate the outer and inner layer unwinding, though the mechanistic origin for this barrier is still not fully understood.
The lack of structural resolution in single molecule experiments has made mechanistic interpre-tations of their results non-trivial. Often, the crystal structure for the fully wound nucleosome is invoked to highlight the importance of specific chemical interactions for nucleosome stability and the unwinding kinetics [6, 7]. However, it is unclear how well observations in this static snapshot generalize to partially unwound nucleosome configurations. Theoretical studies that model the nucleosome as a worm-like chain bound to a cylinder have in fact argued that the biochemistry of the nucleosome is not critical for the barrier that separates the outer and inner layer unwinding. Instead, the transition barrier arises from the underlying geometry and physics of the DNA spool
[10,
11]. Further first-principles studies are necessary to refine our understanding of nucleosome unwinding by resolving the poorly characterized nucleosome configurations at high resolution.We applied a coarse-grained protein-DNA model to determine the free energy profile for the entire nucleosome unwinding process as a function of the DNA end-to-end distance. Computer simulations not only quantitatively reproduce thermodynamic parameters determined in the single molecule experiments, but also capture conformational changes of the nucleosome at an atomic res-olution as the DNA unwinds. Comprehensive analysis of simulated nucleosome structures suggests that the transition barrier that separates outer and inner DNA unwinding has a strong chemical origin and mainly arises from a delayed loss of histone tails and DNA contacts. Strikingly, this loss of contact mobilizes the disordered tails and leads to a significant increase of entropy that favors nu-cleosome unwinding. Our study highlights the importance of entropic contributions to nunu-cleosome stability that arise from the conformational flexibility of intrinsically disordered proteins.
2
Results and Discussion
2.1 Free energy landscape of nucleosome unwinding
To provide mechanistic insights into the DNA unwinding process, we mapped out the free energy profile as a function of the end-to-end distance using a coarse-grained protein-DNA model. The end-to-end distance mimics the nucleosome extension manipulated in typical single-molecule force spectroscopy experiments [9, 21, 22] for direct comparisons. We chose the coarse-grained model for its chemical accuracy that has been extensively tested in prior studies [23-26] and for its computational efficiency which enables long timescale conformational sampling.
As shown in Figure 1, the free energy increases monotonically as the end-to-end distance stretches from 80 to 320
A,
a range that covers the unwinding of both outer and inner layer of nucleosomal DNA (see Figure 1 insets and Figure S1). Complete dissociation of histone core pro-teins at distances larger than 320A
can become irreversible and is not modeled in our simulation. Notably, features along the free energy profile support the three-stage model proposed by Wang and co-workers [7]. In particular, the minimum at 80A
corresponds to fully wound nucleosome conformations which closely resemble the one captured by the crystal structure [6]. The plateau region around 200A
corresponds to partially unwound nucleosome configurations with the DNA40 35 030 25 >15 a)
5
0
100 150 200 250 300End-to-end Distance
(A)
Figure 1. Free energy profile of nucleosome unwinding as a function of the DNA end-to-end distance. Error bars are smaller than symbols. Inset: example nucleosome configurations from end-to-end distances of roughly 80
A
(bottom left), 195A (bottom right), 230 A (center), and 290
A
(top). The DNA molecule in these structures is shown in golden surface, and the histone proteins are drawn in blue (H3), green (H4),orange (H2A), and red (H2B).
outer layer exposed. Finally, the inner layer nucleosomal DNA begins to unwind at distances larger than 250
A.
Further analyses suggest that the simulated free energy profile quantitatively reproduces en-ergetic barriers between different states as determined in single-molecule pulling experiments. It has been reported that the energetic cost of unwinding the outer layer of nucleosomal DNA is approximately 10 kcal/mol [7, 9], which is in excellent agreement with the free energy difference between 200
A
and 80A.
Importantly, we observe a sharp increase in free energy as the system transitions from outer to inner layer DNA unwinding in the region from 200A
to 250A,
resulting in a total barrier of approximately 20 kcal/mol. The rise of this barrier signals the transition to a high force region that has been detected in numerous single-molecule pulling experiments [7, 9], as can be seen in the gradient of the free energy profile shown in Figure S1. The magnitude of the barrier in this region is also in quantitative agreement with previous experimental and theoreticalstudies [9, 12, 27].
Close inspection of the simulated structural ensemble suggests that many qualitative observa-tions of the unwinding process are captured by the coarse-grained model as well. Consistent with single-molecule F6rster resonance energy transfer (FRET) [14, 15] and cryo-electron microscopy studies [28], we observed large-scale rearrangements of protein-protein interfaces in the histone octamer as the DNA unwinds (Figure S2). In fact, a significant fraction of the histone proteins disassembles into H3-H4 tetramer and two H2A-H2B dimers at end-to-end distances larger than 300
A
(Figure S2). It's worth noting that our protein model correctly captures the stability of the histone octamer at physiological and high salt concentrations (Figure S3). Finally, we confirm the presence of both symmetric and asymmetric unwinding pathways in which either equal amounts of DNA are released from the two ends, or the nucleosome preferentially unwinds one end [16, 23, 29] (see Figure S4). The excellent agreements between modeling and experiments thus justify a further analysis of simulation results to reveal the underlying molecular mechanism of nucleosome unwinding.2.2 Entropic contributions to nucleosome unwinding
We next set out to further characterize the transition region (from 200 to 250
A)
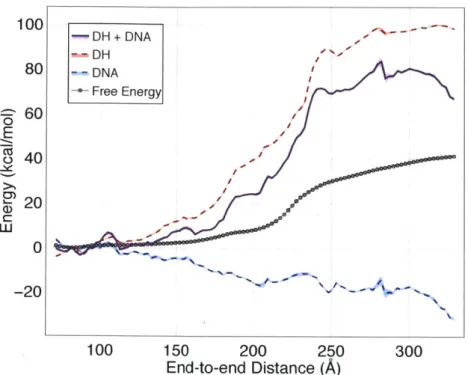
that separates the unwinding of the outer and inner layer of the DNA. The mechanistic origin for the emergence of a large energetic barrier remains controversial, and multiple explanations have been proposed which attribute the barrier to either chemical interactions among histone proteins and the DNA [7, 8] or mechanical deformation of the DNA [11].We first attempted to understand the shape of this free energy profile by considering the two most intuitive contributions to the energetics of the system - the unwinding of the DNA strand and the electrostatic interactions between the positively charged histone and the negatively charged phosphates of the DNA backbone. The length of the 147 base-pair DNA strand used in this study is on the same order as the persistence length [30]. Therefore, nucleosomal DNA is under substantial mechanical stress, and relaxation from the initially highly bent state will decrease the total energy. As this unwinding occurs, the DNA is pulled away from the histone, weakening the favorable electrostatic contacts between them. To test if these two energetic contributions are sufficient to reproduce the free energy profile shown in Figure 1), we calculated the average energy as a function
of end-to-end distance for each term as well as their sum; the result is shown in Figure 2. 100 -DH+ DNA DH 80 "-DNA Free Energy 60 Cz J 40 20 -20 100 150 200 250 300
End-to-end Distance
(A)
Figure 2. Comparison of calculated free energy profile with the sum of average electrostatic and DNA energies. Error bars are shown as shaded regions around each curve.
By summing the average energetic contributions from the DNA bending and electrostatics we roughly capture the general shape of the free energy barrier, but dramatically overestimate its magnitude. The barrier in the 200-250
A
region is approximately 40 kcal/mol, double the heightof the transition barrier in the free energy profile. Moreover, we fail to accurately capture the free energy change over end-to-end distances 135-200
A.
Consequently, there must be at least one additional aspect of the system that makes a favorable free energy contribution as we increase the end-to-end distance. Presumably, this contribution could be due to any of the other force-field terms that we have neglected to consider thus far, such as the protein energy, non-electrostatic protein-DNA interactions, etc. Accordingly, we repeat this analysis for all remaining force-field terms and project their average onto the end-to-end distance coordinate. Surprisingly, this does not yield an appreciable change in the energy - the DNA and electrostatic terms alone capture the majority of the total potential energy change (Figure S5). Consequently, we assume there must be a significant entropic contribution to the free energy of unwinding.Given that the simulations were performed using a temperature replica exchange scheme [31], we can compute the free energy profile at each replica temperature and estimate the relative en-tropic contribution at 300 K through the finite difference method [32]. As illustrated in Figure 3, there is indeed a significant entropic contribution to nucleosome unwinding - the relative en-tropic component of the free energy decreases by approximately 60 kcal/mol across the end-to-end distance spectrum.
0
-10 75-20-30
CD)-
4 0-50
-60
100
150
200
250
300
End-to-end Distance
(A)
Figure 3. Relative entropic contribution to free energy of unwinding. Entropy was calculated via the finite difference method for all pairs of free energy profiles collected from replicas at 280-320 K. Error calculated as standard deviation of the mean. Inset: free energy profiles calculated from temperatures of 260-370 K. High temperatures are indicated in red, low temperatures in blue.
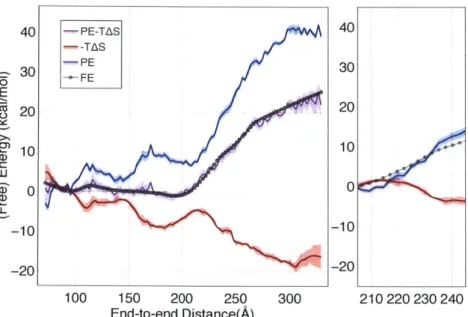
If we combine the energetic and entropic components we now recover the calculated free energy profile within error, as shown in Figure 4. Notably, the relative entropic contribution to free energy in the barrier region is approximately -20 kcal/mol, which significantly offsets the energetic penalty (see Figure 4, right panel).
We conclude that it is electrostatic interactions that give rise to the energetic barrier in the
40
20
0
0
100 -- PE-TAS 40 80 -TAS PE 30 60 -- FE o 60 E 020 S40 .2n 20 1 U) u -20 -10 -40 -60 100 150 200 250 300 210 220 230 240 End-to-end Distance(A)
Figure 4. Comparison of free energy profile with the sum of potential energy and entropy components. The sum of potential energy and entropy has been shifted to minimize differences with the free energy profiles as all quantities are only defined up to a constant. Right: an expanded view of the barrier region. All quantities have been shifted to zero at the beginning of the barrier region. The sum of the potential energy and the entropy has been removed for clarity.
transition region. This increase in electrostatic energy, however, is offset by a concomitant increase in entropy, resulting in an overall modest change in terms of free energy.
2.3 Histone tails safeguard the inner layer
To understand the origin of the surprisingly large entropic contribution to the transition region, we further characterized structural changes of the nucleosome as the DNA unwinds. We note that near the transition region, the length of the unwound DNA is approximately 70bp (see Figure S6), which is well below the persistence length. Furthermore, the histone core protein remains stable in conformations that closely resemble the crystal structure (see Figure S2). The contribution from these two components to the entropy is thus expected to be small, and we, therefore, focused our analysis on histone tails.
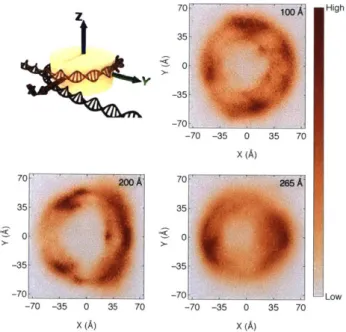
To directly investigate the mobility of histone tails, we defined a structure-specific coordinate system where the x-y plane coincides with the nucleosomal plane (Figure 5A). The x-axis points from the center of the nucleosome to the DNA intersection, which is defined as the location where
the two endpoints of the inner layer DNA meet (see Methods: Nucleosome coordinate system for details). In Figure 5B-5D, we plot the probability density distributions of the position for the last residue of histone tails onto the x-y plane at different end-to-end distances. At the beginning of transition region where the end-to-end distance is approximately 200
A,
histone tails strongly localize at the intersection region (x -25A)
as indicated by the high probability density. Nearthe end of the transition region, however, histone tails delocalize over the entire nucleosomal plane, and the probability distribution is more uniform. The significant variation in their conformational flexibility thus supports the role of histone tails in contributing to the entropy rise along the transition region. 70 1ooA High 35 0 -35 -70 __ -70 -35 0 35 70 X (A) 70 200A 70 265A 35- 35 0. 0 -35- -35 -70 -70 - Low -70 -35 0 35 70 -70 -35 0 35 70 X (A) X (A)
Figure 5. Histone tail position distributions relative to the DNA overlap region. Top left: schematic representation of the nucleosome coordinate system (see Methods section for additional details). Projections of the last alpha carbon in each histone tail onto the x-y plane for end-to-end distances 100
A
(top right), 200A
(bottom left), and 265A
(bottom right) are shown. Each window contains data from all trajectory frames with end-to-end distances within t5A
of the listed value.A substantial entropic contribution from histone tails would be consistent with the change of their interaction energy with the DNA as a function of the end-to-end distance. As shown in Figure S7, similar to the total electrostatic energy, the histone tail-DNA energy increases sharply in the transition region, and in fact, accounts for most of the changes observed in Figure 2. On the contrary, a more gradual change for the histone core-DNA energy is observed in the same region.
Further decomposing the tail-DNA energy into individual proteins suggests that the energy comes from interactions between H2A and H2B with the DNA, though considerable contributions from H3 and H4 are also observed (see Figure S7). Breaking the tail-DNA contacts will significantly mobilize histone tails, giving rise to a large increase in entropy in the transition region.
The above analysis indicates that it is the sudden loss of tail-DNA contacts that gives rise to the large jump in both energy and entropy observed in the transition region. Remarkably, histone tails manage to preserve their interaction with the DNA molecule until the two DNA ends reach a separation of 200
A.
This delay in tail contact loss is a result of large-scale rearrangements of histone tails that are most evident by comparing the probability density distributions at 100 and 200A.
Multiple peaks can be seen in the distribution at 100A
(Figure 5B), indicating the strong binding of histone tails with different regions of the nucleosomal DNA. On the other hand, most of the histone tails localize at the intersection region as the end-to-end distance reaches 200A.
The drive for this dynamical reallocation of histone tails is to search for nucleosomal regions with two strands of DNA to maximize favorable electrostatic interactions. This rearrangement helps to keep both the energy and entropy relatively constant until the transition point, the place at which the last region with two strands of DNA is lost. This rearrangement, of course, cannot perfectly preserve all contact energies, and the entropic increase before 100A
indeed arises from a partial loss of contact between histone H3 tails and the DNA (see Figure 5).Consistent with the above interpretation that emphasizes the central role of histone tails in safeguarding the inner layer from unwinding, we find that for a tailless nucleosome, thermodynamic features corresponding to the transition region become less prominent. The tailless nucleosome is designed by removing segments of histone tails to mimic the product of trypsin digestion [8]. We carried out independent simulations and analysis to characterize its free energy profile as a function of the end-to-end distance. As shown in Figure 6 and Figure S1, the variation in the slope of the free energy profile for end-to-end distances larger than 200
A
is significantly reduced relative to the intact system. Furthermore, the energetic cost from 200 to 250A
is about 15 kcal/mol, reduced considerably from the 40 kcal/mol seen in the intact system. Similarly, the relative entropy variation in this regime is barely noticeable.40 -PE-TAS 40 - -TAS 30 -PE 30 E F 20 20 0) 10 10 -10 -10 -20 -20 100 150 200 250 300 210220230240 End-to-end Distance(A)
Figure 6. Comparison of free energy profile with the sum of potential energy and entropy components for the tailless system. Right: an expanded view of the barrier region. All quantities have been shifted to zero at the beginning of the barrier region. The sum of the potential energy and the entropy has been removed for clarity.
2.4 Histone tails regulate asymmetric outer layer unwinding
In addition to their major contributions to the transition region, histone tails play a critical role in the unwinding behavior of the outer layer of the DNA. Specifically, consistent with previous experimental and computational studies [16, 23], we observed a predominantly asymmetric pathway for the unwinding of nucleosomal DNA. This asymmetry is most evident from the two-dimensional free energy profile provided in Figure S4. The two axes measure the change in the radius of gyration of the first (base pairs 1 to 73) and second (base pairs 74 to 147) half of the DNA molecule respectively. An increase in the radius of gyration is expected if the corresponding DNA segment unbinds from the histone core. Along asymmetric pathways, the two DNA segments are relatively uncoupled, allowing the nucleosome to preferentially expose one DNA end while keeping the other one fixed. This is in contrast to the symmetric pathway in which the motions are more concerted and both DNA ends are exposed at the same rate. Note that since the DNA sequence is palindromic, the two asymmetric pathways have identical thermodynamic weight, as can be seen from the symmetry of the free energy profile. Illustrative nucleosome configurations along different unwinding pathways are provided in Figure 7A.
A)
B)
I ii 40 - Symmetric - Full 35 Asymmetric 30 25 T 20K
J5
Symmetric 1 Unwinding progress 100 150 200 250 300End-to-end Distance (A)
Figure 7. Illustration and comparison of the asymmetric and symmetric path-ways for nucleosome unwinding. A) Schematic diagram of the two pathways
ob-served during unwinding. B) Comparison of the free energy profile shown previously with
the free energy of unwinding in an exclusively symmetric fashion.
Though both pathways are present, the DNA unwinds predominately in the asymmetric fashion for the intact system. To better understand the thermodynamic stability of different pathways, we
computed the free energy for unwinding exclusively in a symmetric fashion and compared this to the full free energy (see Figure 7B). Symmetric unwinding of an intact nucleosome resulted in a
free energy 1 to 2 kcal/mol greater than that of the full free energy profile, therefore explaining the strong preference for asymmetric unwinding. We defined symmetric unwinding as nucleosome configurations in which the difference between the radius of gyration for the two DNA halves is less than 10
A.
Strikingly, we find that the preference of asymmetric pathway is dependent on the presence of histone tails, and is essentially non-existent for the tailless system. As shown in Figure S8, the free energy difference between the symmetric and total free energy profiles to be significantly smaller (<0.5 kcal/mol) once histone tails are removed.We further decomposed the free energy difference shown in Figure 7B into energetic and entropic contributions for additional mechanistic insights (see Figure S9). The symmetric unwinding is energetically more unfavorable for almost all end-to-end distances, though the energetic penalty is partially offset by entropic contributions. Further analysis suggests that the increased energetic
cost arises mostly from the presence of more protein deformation along the symmetric pathway (see
rationalize the relative stability of the two asymmetric configurations [16, 29]. We argue here that for the preference of asymmetric configurations over symmetric ones, other factors in addition to DNA mechanics, such as octamer stability, play a role as well. In fact, as shown in Figure SlOB, the DNA energy is actually lower in symmetric configurations, even though the symmetric pathway is overall unfavorable.
3
Conclusions
We have shown that a coarse-grained protein-DNA model quantitatively reproduces the free energy profile of single nucleosome winding, validating it for a more detailed investigation of the unwinding mechanism. We find that considering only the energetic contributions from the DNA and electro-static interactions between the DNA and histone core qualitatively reproduce the shape of the free energy curve, but fails to correctly capture the magnitude of the barrier in the transition region that separates the unwinding of the inner and outer layer of the nucleosomal DNA. Comparing free energy profiles computed at different temperatures indicated there is a significant entropic contri-bution to the free energy, most notably within the transition region. The molecular origin of this entropy is the enhanced mobility of the flexible histone tails following their unbinding. The free energy cost of nucleosomal DNA unwinding, therefore, is primarily due to electrostatic interactions which are significantly offset by a concomitant increase in entropy generated by breaking these contacts. We validate this explanation through the introduction of an additional set of simulations in which the histone tails have been removed. Overall, both the energetic cost and entropic com-pensation for DNA unwinding are significantly reduced, leading to a milder free energy profile as the DNA end-to-end distance increase.
The importance of histone tail entropy highlighted in this study provides a fresh view on the role of histone modifications in regulating nucleosomal dynamics. Post-translational modifications of histone tails are widespread and are known to greatly impact the stability of nucleosome structure [8, 23, 33-36]. For example, acetylation can neutralize positive charges on these tails and weaken their interaction with the DNA molecule [37]. Methylation, on the other hand, has been shown to facilitate the binding of additional chromatin regulators that can drive conformational changes in the nucleosome by utilizing chemical energy [38]. In addition to these mechanisms, however,
histone modifications could regulate nucleosome stability by fine-tuning the entropic contributions of disordered tails to the free energy cost of DNA unwinding. Indeed, numerous studies have shown that post-translational modifications greatly affect the conformational flexibility of histone tails [39, 40]. Further quantitative investigations on how histone tail entropy is affected by these modifications will enhance our understanding of their role in regulating nucleosome structure and function.
4
Future Work
4.1 Molecular Determinants of Asymmetic vs Symmetric Unwinding
As described in the section Results: Histone tails regulate asymmetric outer layer unwinding, DNA mechanical properties are generally invoked to explain why nucleosomal DNA unwinds in an asym-metric fashion--the less flexible DNA arm will unwind first, followed by the more flexible one. Unwinding in this fashion ensures that the energetic penalty of bending the DNA strand is mini-mized. In the case that both DNA arms are equally flexible, which of the asymmetric pathways is followed is determined stochastically, with an equal chance for each arm to unwind first. When we compare asymmetric vs symmetric unwinding, however, this comparison becomes more difficult. Even though the DNA sequence is palindromic, different regions of each arm are bent as the un-winding process proceeds through the transition region. Importantly, it appears the protein itself must play a role, as there is a significant difference between the protein energies in the intact versus tailless systems (see Figure S10). Further investigation into the molecular underpinnings of the unwinding pathway symmetry is necessary to fully understand this behavior.
One potential explanation for the difference in pathway preference between the intact and tailless systems is the histone tails enforce different DNA configuations at the exit points during the transition from outer to inner layer unwinding, which gives rise to the free energy differences between the symmetric and asymmetric pathways. The high positive charge density of the histone tails would provide a strong energetic drive to prevent unbinding of the DNA and is likely to strongly tether the DNA to the histone surface, thereby enhancing the local bending of DNA. Moreover, increasing the end-to-end distance of the DNA while it remains pinned to the histone core would result in protein structural deformation which would further increase the energetic penalty. For
an asymmetric unwinding process only one DNA arm is extended as the nucleosome's outer layer unwraps, resulting in a smaller energetic penalty than a symmetric unwinding process in which structural distortions occur for both DNA arms simultaneouly (see Figure S10). Removing the histone tails likely reduces how strictly these configurations are enforced as the lack of tails greatly reduces the electrostatic drive to tether the DNA to the histone.
A simple first step to further investigate this phenomenon would be to reanalyze the existing trajectories and quantify the degree of local bending at the DNA exit points for both symmetric and asymmetric configurations. An increase in mechanical DNA distortion for symmetric configua-tions relative to asymmetric configuaconfigua-tions would provide support for this hypothesis. Additionally, another series of simulations in which the AMH-GO term of the protein potential is greatly in-creased could be performed to determine if flexibility of the histone core also plays a signficant role in determining the symmetry preference. Strengthening this term in the protein potential increases the energetic penalty of deviations from the crystal structure, effectively making the protein more rigid. If flexibility of the core also contributes unfavorably to the energetic difference between sym-metric and symsym-metric unwrapping a more pronounced preference for asymsym-metric unwinding would be expected for the intact nucleosome, while the tailless nucleosome would exhibit a significantly smaller change. Such an observation could also likely be tested experimentally by increasing the rigidity of the histone core through chemical crosslinking of the histone proteins.
4.2 Applications to Chromatin Fiber Modeling
While many theoretical and experimental studies have been conducted at the single nucleosome level, understanding higher levels of genomic organization is also a key research goal of modern biophysics. In particular, the three dimensional structure and organization of chromatin has been shown to be critically important in gene regulation. Chromatin consists of large numbers of nucleo-somes connected via linker DNA, forming a structure resembling beads on a string. Each individual nucleosome can be epigenetically modified in a variety of ways. Specific collections of epigenetic modifications, commonly referred to as "chromatin marks" or "chromatin states", can dramatically alter the local structure of a chromatin fiber, thereby regulating gene expression through differen-tial accessibility of the underlying DNA sequence. A number of enzymes maintain or alter these chromatin states in response to molecular signals, resulting in a highly dynamic, complex method
through which the cell can regulate its behavior.
While a great deal is known about the structure of individual chromatin fibers in vitro, a com-prehensive understanding of chromatin in vivo has yet to be developed. Specifically, a detailed understanding of how individual histone modifications contribute to the fiber's dynamics and tran-sitions between states is still lacking. Developing such an understanding would prove particularly valuable as it would aid in the development of targeted epigenetic therapies for conditions in which alterations to the epigenetic landscape lead to misregulation, namely cancer. Current therapies show promise, but our lack of understanding of the underlying physics hinder progress towards new, more effective treatments.
Our coarse-grained nucleosome model is uniquely qualifed to provide insight into this problem as it will allow for a bottom-up, first-principles parameterization of a chromatin model. Through a repeated series of dinucleosome simulations an effective pairwise interation potential could be calculated as a function of distance, orientation, and the epigenetic modifications present on each nucleosome. This potential could then be used to simulate a much larger-scale "beads-on-a-string" chromatin model where the potential dictates the interactions between each of the beads. Sub-sequent analysis of these trajectories would provide insight into the effects of common histone modification patterns on chromatin dynamics.
5
Methods
5.1 Coarse-Grained Protein-DNA Model
In this study we model the nucleosome through the combination of two coarse-grained models: the three sites per nucleotide (3SPN2.C) DNA model and the associative memory, water-mediated, structure and energy model (AWSEM) for proteins. The 3SPN2.C model is a three site per nucleotide coarse-grained model for DNA which was parameterized to replicate key mechanical properties such as persistence length, melting temperature, and geometrical properties at vary-ing ionic concentrations [41]. This particular version also accounts for the sequence dependence of these properties through the addition of sequence-dependent terms in the potential [42]. In a similar vein, the AWSEM protein model uses C0, C,, and 0 sites to represent each residue in a
bonds, angles, dihedrals, etc., as well as bioinformatics terms which bias short
(-9-10)
sequences of amino acids towards structural motifs commonly observed in other, similar proteins. This model has been successfully employed for structure prediction of monomeric proteins [24], prediction of protein-protein interfaces when monomer structures are known beforehand [43], and investigation of protein misfolding and aggregation [44].While each of these models contains highly optimized self-interactions, additional force-field terms must be introduced to describe DNA-protein interactions. We introduce non-specific electro-static interactions at the Debye-Hiickel level and Lennard-jones interactions to account for excluded volume effects. Although only a first-order approximation to the true electrostatic environment of the system, such an approach is justified due to the lack of base-specific interactions between the histones and DNA [45]. Detailed simulation parameters can be found in Ref. [23]. The only modification we made here is to increase the AMH-GO strength from 0.02 to 0.028 for the intact nucleosome, and from 0.022 to 0.031 for the tailless system. As shown in Figure S3, with this new set of parameters, the model correctly captures the stability shift for the histone octamer as the salt concentration increases.
5.2 Simulation Details
We use the end-to-end distance of the nucleosomal DNA as the reaction coordinate to study the thermodynamics of nucleosome unwinding. Formally, we define the ends of the DNA as the center of mass of the sugar sites in the first or last five base pairs and the end-to-end distance as the Euclidean distance between them. This choice of coordinate provides an intuitive metric for the unwinding process and allows for natural comparison with the nucleosome extension coordinate used in single-molecule pulling experiments.
To ensure sufficient exploration of configurational space, we employ umbrella sampling [46] and temperature replica exchange molecular dynamics [31]. Fifteen umbrella windows were used, 11 of these were equally spaced from 75
A
to 325A
in 25A
increments. Four additional windows were added at 190A,
240A,
265A,
and 310A
to facilitate sampling of specific regions of the reaction coordinate. The spring constant, k,, in kcal/mol - 2an end-to-end distance of d angstroms was chosen as follows: 0.016, d < 150 0.024, 175 < d < 200 kw =< 0.048, 225 < d < 250 0.032, d > 265
Twelve replicas were used within each umbrella window. Temperatures for these replicas ranged from 260 K to 370 K in 10 K increments. Exchanges between these replicas were attempted every 100 timesteps.
All simulations were performed under constant temperature and volume without periodic bound-ary conditions using the Large-Scale Atomic/Molecular Massively Parallel Simulator (LAMMPS) software package [47, 48]. A significant amount of computational effort was exerted to ensure sufficient sampling; each umbrella window was simulated for roughly 107 timesteps.
5.3 Tailless nucleosome system
An additional, independent series of simulations were performed for a tailless nucleosome. Histone tails were removed as described in the experimental study conducted by Brower-Toland et al [8]. As with the intact system, umbrella sampling and temperature replica exchange molecular dynamics were used to enhance sampling. For these simulations thirteen umbrella windows were used, 11 of them equally spaced from 75
A
to 325A
in 25A
increments. Additional windows were added at 110A
and 280A
to ensure the end-to-end distance coordinate was completely sampled. These spring constants, kw, in kcal/mol-A
2 were as follows:0.032, if d = 110 or 280
kw =
0.016,
otherwiseReplica temperatures and attempted exchange rate were identical to those in the intact simu-lations.
5.4
Thermodynamic calculations
Free energies and expectations were calculated using the pymbar package developed by the Chodera group [49]. Calculations were performed using simulation data from all temperatures subsampled to produce statistically independent samples. Statistical inefficiency was capped at 50 timesteps as high-temperature systems could exhibit long timescale processes such as histone disassembly which were not relevant to the unwinding process.
To calculate expectations as a function of the end-to-end distance, we chose one hundred distance values evenly spaced between 70 and 330
A
and defined a new thermodynamic state for each of them. Each state was assigned a harmonic potential centered at the given distance; the spring constant for this potential was set to an arbitrarily high value (>20 times that used for a typical simulation window potential). Computing expectations of each of these states, therefore, yield thermodynamic expectations at a specific end-to-end distance, thereby allowing us to map out the expected values across the distance spectrum. Potentials of mean force are calculated similarly. The expectation of an indicator function is determined for each bin along the reaction coordinate, and the resulting probability is then used to calculate the free energy. Uncertainties in estimating these quantities can be directly assessed through the calculation of an asymptotic covariance matrix, which is automated by the pymbar package [49].5.5 Nucleosome coordinate system
The coordinate system for studying histone tail distribution is defined as follows. First, we locate the DNA intersection point where the two endpoints of the inner layer DNA meet. To begin we determine which of the 147 base pairs are bound using a distance cutoff of o- = 55.0
A.
bj= 1 |Icom,j - rcomhistonell <
0-0,
otherwiseHere icom,j indicates the center of mass of the jth base pair and
Ycom,histone
is the center ofmass of the histone core. We then determine the 81-base pair window which contains the most bound base pairs. An 81-base pair region corresponds to approximately one full wrap around the nucleosome. Defining
1+80
k = max E bj
le[1,67] . j=4
k is, therefore, the index of the first base pair within this window, and k +80 is the index of the
last base pair. Note that in the case there are multiple windows with the same number of bound base pairs we chose the average index rounded to the nearest integer. We then define the position of the overlap region being the center of mass of these two base pairs.
-. _ 1
roverlap = k + k+80 (mk 'com,k + mk+80 -com,k+80)
where Mk denotes the mass of the kth base pair.
Next, we calculate the vertical direction of the nucleosome via the average cross product between sequential segments of the inner DNA layer.
16
Uvertical (k+10(i+ ) - Tk+loi) X (ik+10(i+2) ~ Fk+10(i+1)) i=0
Finally, we can define our coordinate system as follows
roverlap - Fcom,histone
IToverlap - Tcom,histone I
Uvertical X X
Iuverticai X X|| cxXy
6
Appendix: Supplemental Figures
2
- Intact
0< '
-
Tailless
E1.5
0. 4-40
>%0.5
w
U--0.5
100
150
200
250
300
End-to-end Distance
(A)
Figure S1. Gradient of the free energy profile as a function of end-to-end distance for the intact (blue) and taillesss (red) nucleosome. They were computed as the derivative of a cubic spline interpolation for the free energy profiles shown in Figure 1 and Figure Si of the main text with natural boundary conditions. Consistent with the presence of a transition region that separates the outer and inner layer of DNA unwinding, the gradient for the intact nucleosome exhibits a sharp peak at end-to-end distances from 200 to 250
A.
The corresponding change in the same region for the tailless nucleosome is less pronounced, supporting the important role of histone tails in the appearance of the transition barrier.A) 0.8 0.8 0.7 0.7 0.6 0.6 0.5 50.5 0.4 0.4 0.3 0.3 0.2 0.2 -(H3-H4),:(H3-H4), 0.1 0.1 - (H3-H4),:(H2A-H2B), (H3-H4)2:(H2A-H2B), 0 0 100 150 200 250 300 100 150 200 250 300
End-to-end Distance (A) End-to-end Distance (A)
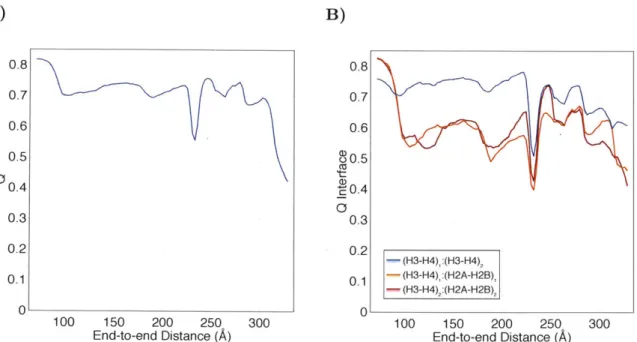
Figure S2. Average fraction of native contacts
Q
as a function of end-to-end distance for the entire histone core (A) and various protein-protein interfaces within it -(B). Error bars are on the order of the line width and are therefore not visible.Q
measures the similarity between a given nucleosome configuration and the fully wound structure as determined in the crystal structure, with larger values corresponding to higher similarity. See Ref. [23] for an exact definition ofQ.
The decrease ofQ
values at large end-to-end distances indicates the loss of protein interfaces, especially between heterodimers H3-H4 and H2A-H2B.7
-2M
6
-100
mM
5
75
E
4
3
W
0
0.3
0.4
0.5
0.6
0.7
0.8
Q
Figure
S3.
Free energy profiles as a function of the fraction of native contactsQ
for the assemblyof the histone core complex at different salt concentrations. Note that these simulations contained only the histone octamer, not the entire nucleosome. The same setup for umbrella sampling and parallel tempering as in Ref. [23] was used for these results, but using the new AMH-GO strength as detailed in the Methods Section of the main text. The model correctly predicts that under
physiological salt concentration
(100
mM), the histone octamer is unstable and disassembles intothe (H3-H4)2 tetramer and two H2A-H2B heterodimers. At increased salt concentration (2 M), however, the stability of the octamer increases, and the protein configuration captured in the crystal structure becomes the global minimum [50].
A) B) 70 70 65 65 06 0 20E CU UU >,55 a ,55 cj)20 U 45 45 45 50 55 60 65 70 45 50 55 60 65 70 Radius of gyration first (A) Radius of gyration first (A)
Figure S4. Free energy of unwinding as a function of the radii of gyration of the two halves of the DNA strand for an intact (A) and tailless (B) nucleosome. Configurations which lie between the
two dashed lines are classified as symmetric; all other configurations are classified as asymmetric. The first radius of gyration is calculated using the sugar sites of base pairs 1 to 73, the second using base pairs 74 to 147. From these free energy profiles, it is clear that the asymmetric pathway is significantly more stable with lower free energy cost for the intact nucleosome. This preference is less prominent for the tailless nucleosome, arguing for the importance of histone tails in regulating the stability of symmetric and asymmetric unwinding pathways.
A) B) 100 -FE 100 - U -DNA+ DH - DNA 80 - DNA 80 -DH -DH - Prot 760 E -PE 60 -PE E -Sum 40 Q 40 20 20 0 0 -20 -20 100 150 200 250 300 100 150 200 250 300
End-to-end Distance
(A)
End-to-end Distance(A)
Figure S5. Comparison of total potential energy with the sum of all individual forcefield com-ponents. As shown in (A), the DNA and Debye-Hiickel energies account for most of the change in total potential energy. Adding the remaining components in (B) recovers the remaining change in potential energy. These results highlight the difference between the potential (PE) and the free energy (FE), and indicate the significant contribution from entropy to the free energy cost of
140
120
00-CD
CO
60
40
100
150
200
250
300
End-to-end Distance (A)
Figure S6. Average number of base pairs bound to the histone core at a given end-to-end distance. A pair of bases is defined to be bound if their center of mass is less than 55.0
A
from the center of the histone core. As expected, the number of bound base pairs continuously decreases as we increase the DNA end-to-end distance.A)
100
- Full - H2B
-Tails only 20 - H2A
- C --Core only -H4 080 0l H E 15 -H3 60 CY6 OJ10 a) (D C C .240 .0 5 CU 0 0 _U 20t 0 -5 100 150 200 250 300 100 150 200 250 300
End-to-end Distance
(A)
End-to-end Distance(A)
Figure S7. A) Decomposition of electrostatic energy into contributions from histone tail-DNA contacts and histone core-DNA contacts. Error is shown as the transparent shaded region around each trace. These results suggest that the increase of protein-DNA electrostatic energy in the transition region arises mostly from the loss of contacts between histone tails and the DNA. B) Electrostatic energy between the DNA molecule and individual histone tails. Each trace is the sum of the two individual tails of that type. The histone H2A trace includes contributions from both the N-terminal and C-terminal tails. Error is shown as the transparent region around each trace. These results suggest that H2A and H2B contribute the majority of the increase of tail-DNA electrostatic energy in the transition region, as observed previously in Refs. [8] and [12].
25
Symmetric
-,Full
20
015
510
u_5
0
100
150
200
250
300
End-to-end Distance
(A)
Figure S8. Tailless nucleosome unwinding free energy profile (blue) and the free energy profile calculated for exclusively symmetric unwinding (red). Configurations in which the radii of gyration for the two halves of the DNA strand differed by fewer than 10
A
were defined to be in a symmetric configuration. Error bars are on the order of the line width and are therefore not visible. Comparing the results shown here with that in Figure 7 of the main text, it is clear that the preference for the asymmetric pathway virtually disappears for the tailless nucleosome.B) A) 100 7380 60 U 40 O 20 0 0 -10 0-20 1 -30 4) '-40 - Symmetric - Full 100 150 200 250 300
End-to-end Distance (A)
- Symmetric - Full
100 150 200 250 300
End-to-end Distance (A)
Figure S9. Comparison of potential energy (A) and entropic contribution to free energy (B) calculated from the full data (blue) and symmetric configurations only (red). Configurations in which the radii of gyration for the two halves of the DNA strand differed by fewer than 10
A
were defined to be in a symmetric configuration. Error is shown as the transparent shaded region around each trace. These results suggest that the increase of free energy cost along the symmetric unwinding pathway shown in Figure 7 of the main text mainly arises from energetic costs.
-50 -60
B) A) 5 0 - -5 -10 -15 -20 Z -25 -30 -35 5 0 -5 >,-10 0) <-15 z -20 -25 - Symmetric Full 100 150 200 250 300
End-to-end Distance (A)
D)
- Symmetric
-Full
100 150 200 250 300
End-to-end Distance (A)
0 -5 0-10 E-6-15 -20 w-25 -30 0 I-35 -40 -45 - Symmetric -Full 100 150 200 250 300
End-to-end Distance (A)
Figure S10. Comparison of DNA (top) and protein (bottom) energy for the intact (left) and tailless (right) systems. Energies calculated from the full data are shown in blue, while those calcu-lated from the symmetric configurations are shown in red. Error is shown as the transparent shaded region around each trace. These data suggest that protein stability playes a role in determining the asymmetric/symmetric pathway preference in addition to DNA conformational energy.
- Symmetric -Full
100 150 200 250 300
End-to-end Distance (A)
C) 30 7 20 E 0 10 0 C LU -10 0 -20 -30
7
References
1. Bonev, B. & Cavalli, G. Organization and function of the 3D genome. Nature Reviews Genetics 17, 661-678. ISSN: 14710064 (2016).
2. Zhang, B. & Wolynes, P. G. Genomic Energy Landscapes. Biophysical Journal 112, 427-433.
ISSN: 15420086 (2017).
3. Luger, K., Dechassa, M. L. & Tremethick, D. J. New insights into nucleosome and chromatin structure: An ordered state or a disordered affair? Nature Reviews Molecular Cell Biology 13,
436-447. ISSN: 14710072 (2012).
4. Ozer, G., Luque, A. & Schlick, T. The chromatin fiber: Multiscale problems and approaches.
Current Opinion in Structural Biology 31, 124-139. ISSN: 1879033X (2015).
5. Luger, K., Mdder, A. W., Richmond, R. K., Sargent, D. F. & Richmond, T. J. Crystal structure of the nucleosome core particle at 2.8
A
resolution. Nature 389, 251-260. ISSN: 00280836(1997).
6. Davey, C. A., Sargent, D. F., Luger, K., Maeder, A. W. & Richmond, T. J. Solvent mediated interactions in the structure of the nucleosome core particle at 1.9
A
resolution. Journal ofMolecular Biology 319, 1097-1113. ISSN: 00222836 (2002).
7. Brower-Toland, B. D. et al. Mechanical disruption of individual nucleosomes reveals a re-versible multistage release of DNA. Proceedings of the National Academy of Sciences 99,
1960-1965. ISSN: 0027-8424 (2002).
8. Brower-Toland, B. et al. Specific contributions of histone tails and their acetylation to the me-chanical stability of nucleosomes. Journal of Molecular Biology 346, 135-146. ISSN: 00222836
(2005).
9. Mihardja, S., Spakowitz, A. J., Zhang, Y. & Bustamante, C. Effect of force on mononucle-osomal dynamics. Proceedings of the National Academy of Sciences 103, 15871-15876. ISSN:
0027-8424 (2006).
10. Sudhanshu, B. et al. Tension-dependent structural deformation alters single-molecule transi-tion kinetics. Proceedings of the Natransi-tional Academy of Sciences of the United States of America
108, 1885-1890. ISSN: 0027-8424 (2011).
11. Kulid, I. M. & Schiessel, H. DNA spools under tension. Physical Review Letters 92, 4-7. ISSN: 00319007 (2004).
12. Lequieu, J., C6rdoba, A., Schwartz, D. C. & De Pablo, J. J. Tension-dependent free energies of nucleosome unwrapping. ACS Central Science 2, 660-666. ISSN: 23747951 (2016).
13. Wocjan, T., Klenin, K. & Langowski, J. Brownian dynamics simulation of DNA unrolling from the nucleosome. Journal of Physical Chemistry B 113, 2639-2646. ISSN: 15206106 (2009). 14. Bdhm, V. et al. Nucleosome accessibility governed by the dimer/tetramer interface. Nucleic
Acids Research 39, 3093-3102. ISSN: 03051048 (2011).
15. Kim, J., Wei, S., Lee, J., Yue, H. & Lee, T. H. Single-Molecule Observation Reveals Sponta-neous Protein Dynamics in the Nucleosome. Journal of Physical Chemistry B 120, 8925-8931.
ISSN: 15205207 (2016).
16. Ngo, T. T., Zhang,
Q.,
Zhou, R., Yodh, J. G. & Ha, T. Asymmetric unwrapping of nucleosomes under tension directed by DNA local flexibility. Cell 160, 1135-1144. ISSN: 10974172 (2015).17. Kenzaki, H. & Takada, S. Partial Unwrapping and Histone Tail Dynamics in Nucleosome Revealed by Coarse-Grained Molecular Simulations. PLoS Computational Biology 11, 1-20.
ISSN: 15537358 (2015).
18. Li, G. & Widom, J. Nucleosomes facilitate their own invasion. Nature Structural and Molecular
Biology 11, 763-769. ISSN: 15459993 (2004).
19. Dobrovolskaia, I. V. & Arya, G. Dynamics of forced nucleosome unraveling and role of nonuni-form histone-DNA interactions. Biophysical Journal 103, 989-998. ISSN: 00063495 (2012). 20. Killian, J. L., Li, M., Sheinin, M. Y. & Wang, M. D. Recent advances in single molecule studies
of nucleosomes. Current Opinion in Structural Biology 22, 80-87. ISSN: 0959440X (2012). 21. Hall, M. A. et al. High-resolution dynamic mapping of histone-DNA interactions in a
nucleo-some. Nature Structural and Molecular Biology 16, 124-129. ISSN: 15459993 (2009).
22. Cui, Y. & Bustamante, C. Pulling a single chromatin fiber reveals the forces that maintain its higher-order structure. Proceedings of the National Academy of Sciences 97, 127-132. ISSN:
0027-8424 (2000).
23. Zhang, B., Zheng, W., Papoian, G. A. & Wolynes, P. G. Exploring the Free Energy Landscape of Nucleosomes. Journal of the American Chemical Society 138, 8126-8133. ISSN: 15205126
(2016).
24. Davtyan, A. et al. AWSEM-MD: Protein structure prediction using coarse-grained physical potentials and bioinformatically based local structure biasing. Journal of Physical Chemistry
B 116, 8494-8503. ISSN: 15205207 (2012).
25. Potoyan, D. A., Zheng, W., Komives, E. A. & Wolynes, P. G. Molecular stripping in the iiZNF-KB/IKB/DNAi/iZ genetic regulatory network. Proceedings of the National Academy of
Sciences 113, 110-115. ISSN: 0027-8424 (2016).
26. Tsai, M. Y., Zhang, B., Zheng, W. & Wolynes, P. G. Molecular Mechanism of Facilitated Dissociation of Fis Protein from DNA. Journal of the American Chemical Society 138,
13497-13500. ISSN: 15205126 (2016).
27. MacK, A. H., Schlingman, D. J., Ilagan, R. P., Regan, L. & Mochrie, S. G. J. Kinetics and ther-modynamics of phenotype: Unwinding and rewinding the nucleosome. Journal of Molecular
Biology 423, 687-701. ISSN: 00222836 (2012).
28. Bilokapic, S., Strauss, M. & Halic, M. Histone octamer rearranges to adapt to DNA unwrap-ping. Nature Structural & Molecular Biology 25, 101-108. ISSN: 1545-9993 (2018).
29. De Bruin, L., Tompitak, M., Eslami-Mossallam, B. & Schiessel, H. Why do nucleosomes unwrap asymmetrically? Journal of Physical Chemistry B 120, 5855-5863. ISSN: 15205207
(2016).
30. Manning, G. S. The persistence length of DNA is reached from the persistence length of its null isomer through an internal electrostatic stretching force. Biophysical Journal 91,
3607-3616. ISSN: 00063495 (2006).
31. Sugita, Y. & Okamoto, Y. Replica-exchange molecular dynamics method for protein folding.
Chemical Physics Letters 314, 141-151. ISSN: 00092614 (1999).
32. Jo, S., Chipot, C. & Roux, B. Efficient determination of relative entropy using combined tem-perature and hamiltonian replica-exchange molecular dynamics. Journal of Chemical Theory