Publisher’s version / Version de l'éditeur:
Vous avez des questions? Nous pouvons vous aider. Pour communiquer directement avec un auteur, consultez la première page de la revue dans laquelle son article a été publié afin de trouver ses coordonnées. Si vous n’arrivez pas à les repérer, communiquez avec nous à [email protected].
Questions? Contact the NRC Publications Archive team at
[email protected]. If you wish to email the authors directly, please see the first page of the publication for their contact information.
https://publications-cnrc.canada.ca/fra/droits
L’accès à ce site Web et l’utilisation de son contenu sont assujettis aux conditions présentées dans le site LISEZ CES CONDITIONS ATTENTIVEMENT AVANT D’UTILISER CE SITE WEB.
Internal Report (National Research Council of Canada. Division of Building
Research), 1962-01-01
READ THESE TERMS AND CONDITIONS CAREFULLY BEFORE USING THIS WEBSITE. https://nrc-publications.canada.ca/eng/copyright
NRC Publications Archive Record / Notice des Archives des publications du CNRC : https://nrc-publications.canada.ca/eng/view/object/?id=f2e02837-8f87-46c3-bb34-5a494c0dfbaa https://publications-cnrc.canada.ca/fra/voir/objet/?id=f2e02837-8f87-46c3-bb34-5a494c0dfbaa
Archives des publications du CNRC
For the publisher’s version, please access the DOI link below./ Pour consulter la version de l’éditeur, utilisez le lien DOI ci-dessous.
https://doi.org/10.4224/20338172
Access and use of this website and the material on it are subject to the Terms and Conditions set forth at
Basement fallout shelter climate studies, 1961
CANADA
DIVISION OF BUILDING RESEARCH
BASEMENT FALLOUT SHELTER CLIMATE STUDIES, 1961
by
A. D. Kent and N. B. Hutcheon
Internal Report No. 243 of the
Division of Building Research
o.TTAWA January 1962
cation and distribution of the booklet "Blueprint for Survival No. lit containing a recommended design of bas ement fallout shelter. It was the opinion of the Shelter Panel of the Emergency Me a s u r e s Organization which was responsible for the design that trials should be carried out to provide further information on shelter heating and ventilation. Accordingly, the Division undertook to carry out such studies in an actual shelter during winter and summ.er periods of simulated shelter occupancy. A shelter was constructed for study in the basement of a house made available for the purpose by the Emergency Measures Organization through Central Mortgage and Housing Corporation. The results obtained during the first year of trials are now reported.
Me. Kent is a Research Officer in the Building Services Section of DBR/NRC and Dr. Hutcheon is the Assistant Director of the Division, representing the National Research Council on the E. M. O. Committee on Research.
Ottawa
January 1962
R. F. Legget Director
CLIMATE STUDIES, 1961 by
A. D. Kent and N. B. Hutcheon
The indoor climate in a shelter as in any building results basically from the balance of heat, air and moisture exchanges between the enclosed space and its surroundings. These factors are usually highly inter -related. The level of concentration of contaminants such as odours, carbon dioxide and carbon monoxide is closely dependent on the air exchange or ventilation rate, as
well as on the rate of production of these agents. Precise calculation of these exchanges is particularly difficult for a basement shelter-and estimation of conditions lTIUSt at present be based on approxi-mations and in lar ge measure on judgement.
Calculations were made in the course of the development of the design of a Canadian household basement fallout shelter in an effort to assess the indoor climate for extremes of winter and summer conditions. While recommendations regarding basement shelter s developed in the United States make no mention of heating, it was consider ed neces sary to e xarn in e the pos sibility that it would be desirable under the mor e extreme Canadian winter conditions. In any event, the ventilation arrangements to be recommended and the probable performance of them was considered to be of importance. It was concluded that heating was desirable and a decision was made by the Shelter Panel of the Emergency Measures Organization to recommend the storage and use of kerosene as an emergency fuel for cooking, lighting and heating. These recommendations were adopted and are now contained in the Government of Canada booklet Blueprint for Survival No. 1 "Your Basement Fallout Shelter. "
The uncertainties in the approximate calculation methods used made it desirable to verify by experiment some of the more important ,conclusions. In addition, the decision to recommend the use of fuel made it necessary to know with greater certainty the heating and ventilation characteristics of the recommended shelter design. Accordingly, plans were made to acquire a house in Ottawa and to construct in it for further study a shelter of the type being recommended.
Experiments using this shelter have been carried out by the Division of Building Research of the National Research Council,
during the past year. The heat and moistur e production typical of occupancy has been simulated in the two winter and two summer trial periods each of two weeks' duration during which normal
services were cut off as in an emergency. Further studies of
certain aspects of the ventilation and of the use of heating appliances are being carried out in a mock-up of the shelter in the DBR
laboratories. Although experiments are continuing, the results to date, which largely confirm the decisions which had to be made,
can now be described.
It is considered desirable to provide background information to assist in the assessment of the experiments carried out and the results obtained. The effects of occupancy upon shelter conditions are discussed in Appendix A. The justification for the use of emer gency fuel in a basement shelter is discussed in Appendix B.
2. Tolerable Conditions for Occupancy
Yaglou has concluded, in connection with a study of under-ground shelters (l), that the acceptable thermal limits for healthy people at rest and properly clothed are 50 degrees minimum and 85 degrees maximum effective temperature in emergencies for at least two weeks. Effective temperature is an empirical scale based on human, sensations. It combines temperature, humidity and air motion in terms of the temperature of saturated air with minimal air motion which provides the same thermal sensation. In shelters in which the air is almost saturated, effective temperatur e will be practically the same as the dry bulb temperature in degrees F. These limits may be regarded as acceptable for basement shelters, and it becomes a matter of experiment to determine with reasonable certainty whether they can be met with basement shelters under Canadian conditions. The limits for ventilation to control carbon dioxide concentrations both with and without the use of fuel burning appliances have been discussed in Appendix A.
3. The Research Residence and Shelter
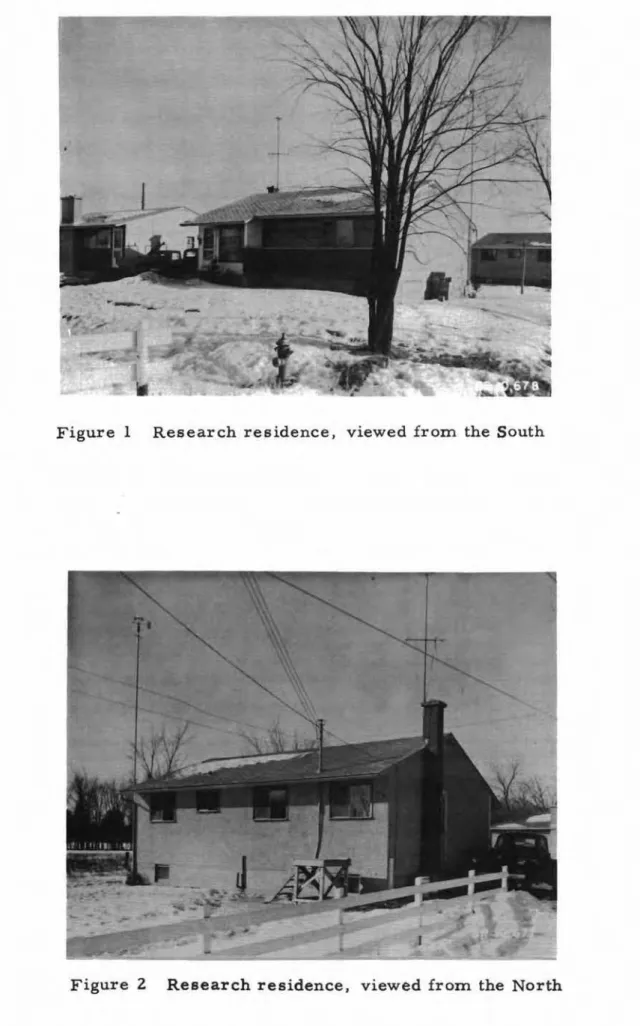
The hous e containing the shelter was a conventional 3-bedroom bungalow with full basement and with outside m,easurements approximately 26 by 36 ft (Figs. 1 and
?).
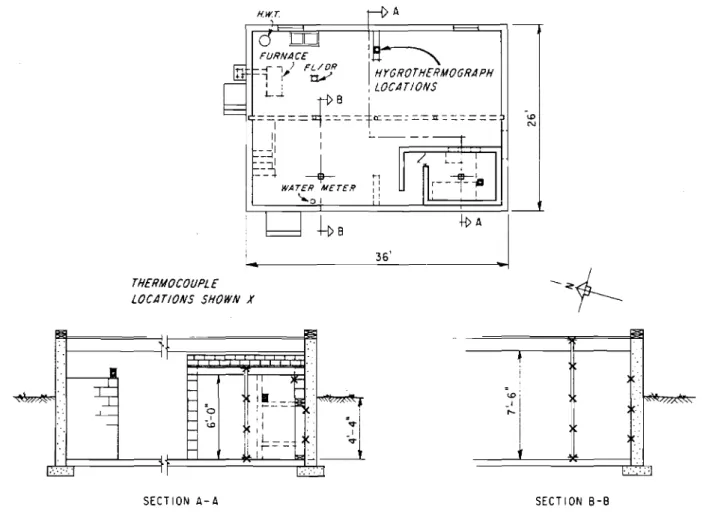
The basement (Fig. 3) consisted of a single space enclosed in concrete block walls with a concrete floor sloping towards. a floor drain. The maximum distance from floor to underside of joists was 7 ft 6 in. resulting in a volume including the shelter of some 5800 cu ft. Outside grade level wasabout 4 ft 4 in. above the basement floor. Basement entrance frorn the kitchen was at the north end and the furnace, domestic hot water heater and laundry tubs were located in the northeast corner. Ther ewer e two bas ement windows in the east wall and a double-size one in the south wall that was removed and blocked in for the shelter studies. Windows were fitted with storm sash for the winter.
The shelter, located in the southwest corner of the basement was constructed according to the directions given in the booklet
"Your Basement Fallout Shelter" with some rn o difi c ation s introduced for simplicity of construction (2). Designed for five occupants, the shelterIs inside dimensions were 9 It 4 1/4 in. by 6 ft 8 1/4 in. with
an entrance 2 ft 8 1/4 in. by 7 ft 4 1/4 in. Headroom in the shelter was a minimum of
6
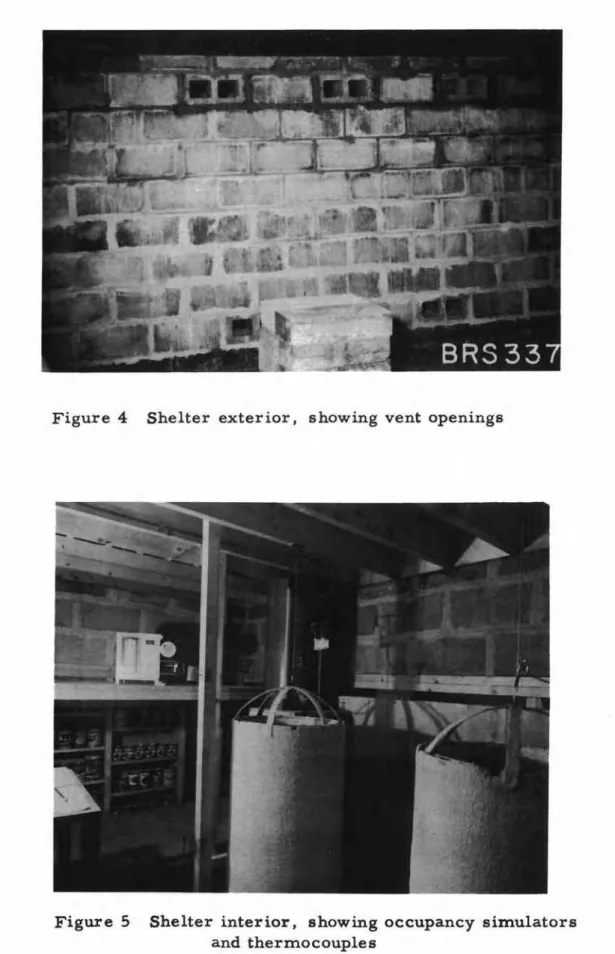
ft to the underside of the shelter roof joists,increasing to approximately 6 ft 2 in. at the lowest point of the sloping bas ement floor. The net air volume after allowing for the volume of bunks, occupancy simulators and other contents was roughly 400 cu ft. Upper and lower ventilation openings, consisting of hollow blocks turned on edge, wer e inserted as the walls were constructed; the lower vents were in the first course of blocks above the concrete foundation pad and the upper vents in the eighth cour s e which was the top course except for the final course of half-blocks (Fig. 4). Four upper vent blocks and two lower blocks were installed but only two upper vent blocks were used. As they were two-core hollow blocks, this resulted in four upper vent openings and four lower ones, each measuring approximately 4 by 5 in., separated by a vertical centre-to-centre distance of 56 in., and venting directly through the long wall of the shelter to the basement. A plywood door was constructed and fitted in the opening between the entrance way and the shelter; this door remained tightly closed for the winter tests only.
Services to the experimental shelter consisted of an electric power supply of 2000 -watt capacity with outlets for power to occupancy simulators, other space heaters and lights and a water supply system connected to the house water system through the domestic water
meter and terminating in the shelter with a faucet and connections for supplying moisture to occupancy simulators.
4. Occupancy Simulators
Units were designed and constructed to simulate the heat output and moisture production. of five occupants, on the basis of a
moisture evaporation of 60 grams per hr per person. Two open-ended vertical cylindrical units (Fig. 5) were used, each designed to supply approximately one-half of the total calculated heat and moisture outputs of 2000 Btu per hr and 300 grams or
o.
66 lb 0+ moisture per hr. The cylinder s, each formed of two copper sheets rolled into concentric cylinders, were 18 in. in diameter and 36 in. high and were set on . a thr ee -legged open stand 8 in. high. The electric heating element, consisting of 112 ft of 18 -gauge chromel A wire set between asbestos paper insulation between the copper sheets, was calculated to give 293 watts at 110 volts.A circular copper trough was fixed to each cylinder at the top for a water distribution reservoir. Six I-in. flat strips of copper forming an open dome above the cylinder were used as water distributors. Terry towelling was wrapped around the cylinders inside and out with the top edges dipping in the water trough, and additional strips of towelling covered the dome strips, extending into the trough and out again to contact the outside towelling of the cylinders. Water for moisture simulation was contained in a steel tank mounted above the level of the top of the cylinders which contained a float valve feed
system to assure constant water level. The water flowed by gravity through individual flow meters to drippers above each dome, flow control being obtained with screw clamps on the supply tubing. The drip system was later altered, replacing the flow meter s with indi-vidual float chambers mounted directly above each dome, using
capillary glass tubing to avoid the erratic control of the screw clamps, the height of the float chamber being adjusted to give the correct head for the calibrated flow of 150 grams per hr for each simulator.
5. Instrumentation
Hygrothermographs of the 7 -day cylindrical chart type were used to record dry bulb temperature and relative humditiy of the air (a) in the shelter, (b) in the basement and (c) in the living room of the house above. Locations were chosen for these three instruments which would result in approximate mean readings for the spaces concerned. The iri str urn ent s were regularly recalibrated in place using a wet and dry bulb psychrometer with battery-operated integral fan. A hygrothermograph installed in a Stevenson screen at the Division's weather station, about 3 miles distant from the Research Residence, was used to provide r e co r d s of outside air temperature and relative humidity.
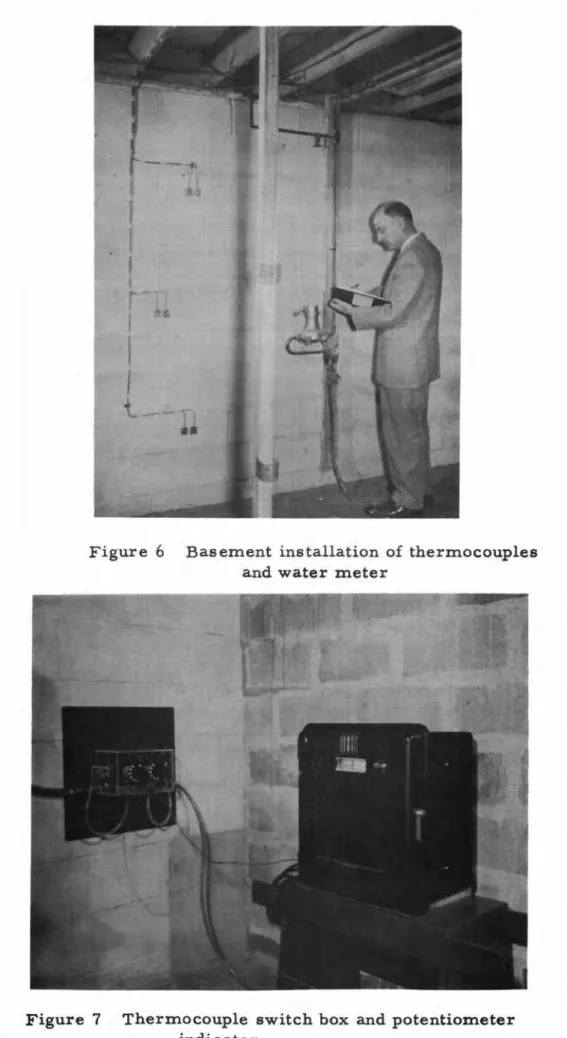
and the ba s ern ent , copper -constantan the r rno coupLes were located on wooden posts at the centre of the shelter space (Fig. 5) and in the ba s ern ent at a corresponding distance of 4 ft fr orn the b a s e rn errt wall (Fig. 6). T'h e.r rno coup Ie s wer e at the Z6 -in. and 5Z -in. levels above the floor in the shelter; those in the ba s ern ent area were at the Z6 -, 5Z - and 78 -in. levels above the floor. The top and b ott orn
ends of the wooden posts were fitted with brass plates, in which additional th e r rno c oup l e s were inserted, to read ceiling and floor surface ternp e r atu r es in both shelter and bas erri errt ,
Wall surface ternp e r atu r e s in both shelter and ba s erne nt were rn ea su.r e d at the centre of the third, sixth and ninth courses of block, at 17-, 41 1/4- and 66 liZ-in. levels above the floor (Fig. 6). Only the upp e r rno st of the shelter wall th e r rn o co up l e s (66 liZ-in. level) was affixed to the shelter wall itself, since the construction of the shelter was such that the walls below grade level were replaced with open shelving. The two lower th e r rno coup l e locations were therefore actually on the ba s erne nt wall surface. 'I'h e r rno coup Le locations are shown in Fig. 3. Originally two th e r rn o co up l e s were placed at each wall location, one i rnrn e di at e l y over a central web of the three-core hollow block and one over the adjacent hollow space.
Later, however, the th e r rno coup l e s over the hollow spaces were abandoned because the surface ternp er atu r e difference between the two adjacent th e r rno coup l e s was found to be negligible. An additional th e r mo coup l e , to record outside air ternp e r atu r e , was located outside the north wall of the building to e l irn in at e dir ect solar radiation
effects.
A switch box (Fig. 7) was fabricated to switch all therlllO-couple leads to an indicating p ot entioineter or as desired to a
16-point recording p ot ent i.orrie.t e r with a one -rrrin ut e print interval, by rn ean s of a rnu It ip l ec conn e ct.i on plug.
Kat.ha r orn et e r e qu iprn ent using h e l iurn as a tracer was used to m ea sur e ventilation rate in both shelter and ba s ern ent ; the description of apparatus and test procedure has been reported (3). Electric power con surnption of the occupancy sirriuIat o r s and additional electric heaters was rn e a s u r e d with a standard watt-hour rn et e r of the household type. Me a su r ern ent s of rnoistu r e content of the wooden joists of the shelter were rna.de using a portable moistu r e rn et e r of the electrical resistance type.
6. Winter Trials
supply to a community could well be cut off leaving the houses without electric power and therefore in most cases without heat. The winter tests therefore were conducted with the heating system of the house and the electric dome stic hot water heater shut off, requiring the plumbing system to be drained and the house vacated. A continuously flowing water supply to the shelter was d e ern e d neces-sary (for test purposes only) in view of possible below freezing
basement temperatures. In addition to the rn ea sur ern ent s of temper-ature and relative humidity in the shelter, basement and living room above, observations were made of the formation of condensation during the winter trials.
The winter tests c .n si ste d of two l4-day periods, the first from 9 to 23 January 1961 and the second from 15 February to 1 March 1961. Test periods began and ended at 12.00 noon for. all tests. During both tests heat and rn ois tu r e were supplied to
the shelter by rn e an s of the occupancy simulators. During test No.1, carried out in moderately cold weather with the last five days below zero, no additional heat was added to the shelter. During test
No. 2 under rn o d e r at e weather conditions supplementary electric heat was added to the shelter space at a constant rate designed to maintain a comfort te mp e r atu r e that would be typical of an occupied shelter with normal heating and cooking facilities. After a 7 -day period during test No.2, however, it was decided to increase the rate of additional heat input in order to study the effect of higher shelter-to-basement air temperature differences on the ventilation rate in the shelter. The electric heater ratings supplying supple-mentary heat in test No.2 were 750 watts (2550 Btu per hr) from 15 to 22 February, and 1200 watts (4100 Btu per hr) from 22 February to 1 March.
(a) Winter Air Temperatures
The air temperatures based on the 12.00 noon readings of the hygrothermographs in the shelter, basement and living room are shown in Fig. 8, with additional curves showing the corresponding variations in daily rn e an outside air temperature during the two test periods. With no supplementary heat, as in test No.1, the recorded temperature of the living room fell to 19 of during outside weather of approximately -8 OF whereas the corresponding hygrothermograph temperatures of the basement and shelter air were 32°F and 40°F
respectively. With supplementary ィ・。セL as in test No.2, the basement air temperature r ern a in e d at between 45 ° and 50 ° F and the living room
ternp er atur e m in irnurn was 38°F. Owing to the arbitrary locations
between the air ternperatures recorded by them and those recorded by th e r rn o c o up I e s at corresponding elevations.
Figure 9 shows the variations in air temperature of the shelter and basement at the levels at which the thermocouples were installed. It is seen fr orn the curves that all. the whole there was little vertical temperature gradient except in the case of the shelter while operating under test No.2 conditions. Here the difference between the 26 - and 52 -in. elevations was roughly 6 degrees and 11 degrees respectively for parts one and two of test No.2 indicating a pronounced air temperature gradient within the shelter with the particular form of supplementary heating employed.
(b) Winter Surface Temperatures
In Fig. 10 a r e plotted the floor and ceiling surface temperatures of the shelter and basement during the winter trials, which follow the same general pattern as the air temperatur es contained in Fig. 9.
Wall surface temperatures as indicated by the wall surface thermocouples in the shelter and basement are shown in Fig. 11. Of the basement wall temperatures the 66 1/2 -in. elevation, which was above grade level, showed generally the lowest ternperature, while the 17 -in. elevation was consistently the war rn e st ,
In the shelter, the 66 1/2 -in. elevation thermocouple was affixed to the shelter block wall wher eas at the two lower ele-vations the thermocouples were against the ba s ern ent wall. The extra wall thickness thus gave generally higher surface temperatures at the 66 liZ-in. level. The surface at the 41 1/4-in. level was the
coldest of the three points during test No. 1 but the s upp l ern errt a r y heat of test No. 2 raised its temperature above that of the 17 -in. level thermocouple.
All points on wall surfaces where thermocouples were installed both in the shelter and in the basement remained above the dew point during both tests 1 and 2, except for the 66 1/2 -in. level on the basement wall which fell below the dew point during the subzero weather at the end of test No.1.
(c) Winter Relative Humidity
The relative humidities in the shelter, basement and living room, based on the 12.00 noon readings of the hygrothermographs,
were as shown in Fig. 1 Z. These, combined with the air temper-atur es of Fig. 8 resulted in the calculated dew point and humidity ratios plotted in Fig. 13. The humidity ratio (or absolute humidity) is expressed in grains of moisture per pound of dry air. It is
apparent that, in spite of the greater interchange of basement and shelter air in test No. Z over that in test No.1, there is a marked increase in the hurnidity ratio difference between shelter air and bas ern e nt air when supplementary heat is added. Also noticeable from the curves is the variability of the outside air dew point from day to day and its influence upon the dew point of the living room air and even the basement air.
(d) Winter Condensation Observations
After about three days of operation of test No. 1 there were signs of free moisture in the shelter along the top course of block against the basement wall and on the ends of the joists supported thereon. This condition continued without apparently getting worse for the duration of test No.1.
In the basement toward the end of the test ther e was some frost accumulation on the upper courses of block along the walls and particularly at the basement corners. Frost was also evident on the wooden blocking pieces between joists above the b a s e rne nt wall. Basement windows were severely frosted on the inside of the inner pane and frost had accumulated on the furnace flue pipe from the furnace to the chimney.
In the house there was a small strip of wall which was frosted at the lower corner of the living room by the front door and slight frosting at the top outside corner of the hall cupboard. House windows showed slight frosting.
During test No. Z ther e was no visible condensation either in the shelter or in the basement, all wall surfaces apparently being above the dew point in view of the milder outside weather and the supplementary heating of the shelter.
(e) Winter Moisture Content of Joists
The accuracy of the readings of moisture content of the ceiling joists in the basement and shelter is questionable in view of the type of instrument used. It appeared, however, that during test No. 1 with no supplernentary heating the rno i st.ur e content remained
fairly steady between 8 and 10 per cent for both sets of joists. In test No.2, with added heat, the moisture content
remained in the same region, but with the increase in air temperatures during the second half of the test the percentage rose to approximately 18 per cent in the basement joists and 12 per cent in the shelter, as shown in Fig. 14. In this respect the joist moisture contents
appeared to follow the general pattern of the relative humidity curves shown in Fig. 12.
(f) Winter Ventilation Rates
During the winter trials measurements of ventilation rate were made in both shelter and basement by means of a
katharometer. It is evident from the results obtained by Tamura (3) (Fig. 15) that under the unheated shelter conditions of test No. 1 the shelter -to-basement ventilation rate was roughly 4 air changes per hr, while under heated shelter conditions of test No. 2 it was
roughly 8 air changes per hr.
Basement ventilation rate was of the or der of 1/4 to 1/2 air changes per hr, the variation depending upon the air terripe r atu r es of the upstairs and outdoors relative to that of the basement and upon wind velocity and direction.
7. Summer Trials
Test No. 3 was carried out from 12 to 27 July 1961.
The heat and moistur e of occupancy was simulated as for the winter trials. An electric kettle of 1500 watts was operated for two periods of 15 minutes each day to simulate a surnrn e r cooking load. A
moisture load of 1.85 lb per day was added in this way, in addition to the 0.66 lb per hour of the simulated occupancy. During the period from 15 to 18 July the power to the occupancy simulator s was inadvertently cut off, but the rn ois tu r e input was continued.
Test No. 4 was carried out fr orn 24 August to 7 September 1961. The occupancy simulator s were not used, but a kerosene heater was operated continuously, together with a srna l l kerosene lantern, to simulate the heat and carbon dioxide production
repre-sentative of occupancy. A flat-wick typ,e kerosene cooker was operated for two 15 -minute periods each day to sirnu.Iat e cooking. The fuel
consumed in all three appliances amounted to 2.96 lb, or O. 38 imp gal per day. This provided 57J 500 Btu per day or 2400 Btu per hr,
total. The lantern and the cooker were located under the hood when in operation. The heater, which was fed at a rate to produce about 2000 Btu per hr produced about 2.6 cu ft of carbon dioxide per hr compared to that estimated from five occupants of 3. 7 cu ft per hr.
Both s urnrn e r trials were conducted with the shelter door open but the basement door closed. During test No. 4 measurements were made of carbon dioxide concentration at two levels - - 6 in. below the ceiling and 6 in. above the floor in both shelter and basement using a rno di fi e d Or sat apparatus graduated to O. 1 per cent. Measurements of ba s e m ent ventilation were carried out at selected periods during both runs.
(a) Summer Air Temperatures
The summer air temperatures during tests 3 and 4 are presented, in the same form as for the winter trials, in
Figs. 16 and 17. Daily mean temperatures in the shelter averaged 70 of for the fir st week, and 7
r
F for the second week of test No.3, with a noon temperature of 79°F on three days of the second week. Basement temperatures rose to about 75°F at the 52-in. level.Shelter temperatures which showed an increase of 2 to 3 degrees from. the 26 - to 52 -in. levels ran from 3 to 5 degr ees above basement
temperatures, reaching a maximum of 80 of at the 52 -in. level toward the end of the second week.
During test No. 4 the out doo r te mp e r atur e s were less severe on the average, but variable, providing a mean for the first week of 69°F and for the second week of 71°F, the latter having one day on which the noon temperature reached 80°F and four days on which noon temperature was 7goF, or higher. Basement temper-atures rose to about 78°F at the 52-in. level. Operation of the heater in the shelter produced appreciable stratification leading to an increase of almost 7 degr ees from the 26 - to the 52 -in. level. The average of the 26- and 52-in. temperatures ran about 5 degrees above the corresponding basement temperatures, reaching a high in the
second week of 85 ° F at the 52 -in. level. (b) Summer Surface Temperatures
Figure 18 shows the floor and ceiling surface temperatur es of the shelter and basement during te st s 3 and 4; in Fig. 19 ar e
plotted the corresponding wall surface temperatures. The difference between floor and ceiling temperatur es in the ba s ernent was 3 to 4 degrees for both tests while in the shelter the difference was about
5 degrees in test No. 3 and about 7 degrees in test No.4. Ceiling and upper wall temperatures in the shelter rose to about 81°F in test No. 3 and to about 85°F in test No.4. Comparison of Figs. 18 and 19 shows that the shelter floor temperature was actually about 3 degrees higher than the temperature of low wall surface at 17 in. above the floor throughout both tests, whereas in the bas ement the floor and lower walls wer e at virtually the same
terrip erat.ur e .
(c) Summer Relative Humidity
Shelter, basement and living room relative humidities based on the noon readings of hygrotherrnographs are shown in Fig. 20 for tests 3 and 4. Corresponding dew point temperatures and humidity ratios (absolute humidities) are plotted in Fig. 21.
Relative humidities ran generally from 70 to 80 per cent in the bas ement and wer e somewhat lower in the shelter. The humidity ratio data of Fig. 21 indicate that outdoor moisture as well as that in the bas ement and shelter incr eas ed during both te sts. The added moistur e in test No. 4 was provided only by the water in the gases of combustion and from periodic boiling of a kettle and was, therefore, less than that to be expected from occupants.
(d) Summer Moisture Content of Joists
The moisture content of the basement and shelter ceiling joists was taken at intervals throughout test No. 3 only using the same instrument as in the winter trials. Readings varied from about 16 per cent moisture content at the beginning of the test to roughly 28 per cent toward the end of the two-week period.
Instrument readings were checked by comparison with the measured loss of weight of two sample chips removed from the joists and dried in an oven, with the result that the portable instrument was found to be reading about 1 per cent low ?t the 16 per cent
moistur e reading. (e) CO
2 and CO Measurements
Carbon dioxide concentration of the atmospher e of the shelter and the basement were measured during test No.4 only, using an Or sat apparatus fitted with a special burette having a range of 0 to S per cent CO
were rn a d e to eliminate errors due to partial moisture saturation of the air samples and to variations in the CO
2 dissolved in the water of the levelling bottle. The sample was saturated and the bottle water was conditioned to the CO
2 content of the sample, but in spite of these attempts, readings were not consistent. On anyone day the readings of samples near the ceiling wer e of the same magnitude as those near the floor. Ther e was little variation between shelter and basement but there was some day-to -day variation in the average value as shown in Fig. 22.
Carbon monoxide concentration was measured inside the shelter and in the basement usually once a day, by the colorimetric method using glass indicating tubes with a yellow-to -deep green colour band. Readings were essentially the same for basement and shelter air at anyone time and varied from 0.001 to 0.002 per cent generally with one day's readings as high as 0.004 per cent or 40 parts per million as shown in Fig. 22. The generally accepted threshold limit is 100 parts per million for a 5- or 6-day exposure on an 8 -hr per day basis.
(f) Summer Ventilation Rates
With the shelter door open during the surnrn e r trials no attempt was made to obtain shelter -to -basement ventilation rate since diffusion of the tracer gas through such alar ge opening would gi ve erroneous katharometer readings.
Basement ventilation tests were made during both test Nos. 3 and 4 which showed the ventilation rate to be from 1/10 to 1/3 air changes per hr, the higher rates corresponding to higher wind velocities.
8. Discussion of Winter Temperatures and Humidities
It will at once be evident from a comparison of temperatures from hygrothermographs and thermocouples that different temper-. ature readings were obtained by the two methodstemper-. This arose mainly
from differences in location and in some cases from differences
in elevation. The hygrotherr.oograph in the shelter was set on the edge of a bunk 52 in. above the floor, di s p la.c e d toward one end of the shelter from the centrally located thermocouple string. Air being cooled at the walls above bunk level no doubt was directed over the
tern.perature Ir orn this i.n st r urnerit in the first trial with no additional heat added. On the other hand, under the air ternp e r atur e gradient
conditions produced by the electric heater s the hy gr oth e r mo gr aph readings were slightly higher than those of the 52 -in. th e r rno coup l e in the centre of the shelter. The hygroth.e r mo gr aph in the ba s ern ent was at a height of 5 ft 8 in. Care mu st therefore be taken in
interpreting the te rnp e r a.tu r e readings obtained.
The ba s ern ent ternp e r atur e fell steadily during test No.1, showing little difference f r orn floor to ceiling. The effects of th er rna l storage are shown by the lag between ba s ern e nt ternp e r atur e and
outdoor terrrp e r a.tu r e for the final five days of the period when the outdoor ternp e r atur e r ern a.in e d quite steady at about - 7 of. Ba s errrent air terrip e r atur e reached a low of about 30°F with floor at 33°F,
ceiling at 2.7°F and upper wall surface at 2.2.°F.
It would appear that the b a s ern errt ternp er atur e had begun to level off by the end of the test. The temperature difference at that
tirn e between ba s ern errt and outside of 37 degrees is therefore of
special significance, and IT1ay be used as a rough guide, in the absence of any better evidence, in e st irnatin g probable ba s ern ent terrip e r atu r e s under other conditions. This figure should be used with caution, however, since bas e rn e nt window areas, b a s errie nt ventilation, height of expo sed ba s ernerit wall, ba s ern ent insulation if any, rn e an ground ternp er atur e s , soil type, prior th e r rna.l history of ba s ern ent and adjacent soil and severity of outdoor temperature, IT1ay cause it to differ for other
cases. The addition of heat to the shelter will raise ba s ern e nt ternp e r «
ature a little, all other factor s r erna in in g constant, and also b a s e.rn e nt> to -air ternp e r at.ur e difference IT1ay be expected to increase as air
te rnp e r a tu r es fall to extr eIT1e low values.
The rn e an out do o r air temperature of _7°F may be compared to the rn e an January ternp e r atu r e for Ottawa and Mont r ea.l of about
10°F and to the 10 per cent hourly frequency temperature for January of about _5°F. The air ternp e r a.tu.r e for the last five days of the
test period fell below the 10 per cent hourly frequency level and it IT1ay be e st i rnat e d roughly that, for a ba s ern ent s irni Iar to that used in the test, the chance of a bas ern errt ternp e r atu r e below freezing in Ottawa during an ern e r gency heating shutdown of 2. weeks in January is about 1 in 10. The rn e a n January temperature for Winnipeg, Saskatoon and Regina is O°F, while the 10 per cent hourly frequency value for January
is -2.5°F. Again, very roughly, it IT1ay, be e sti rn at e d that the chances of a b a s ern ent ternp e r at.ur e below freezing at these locations in January is about 1 in 2. and there is a chance of about 1 in 10 that the basement
terrrp e r'a.t u r e IT1ay fall to 15°F or lower. Account should be taken of such possibilities in the planning for an emergency shutdown, since pipes and tanks may be da.rna g e d unless drained and supplies of water
left in the basement may be frozen.
The shelter ternperature as measur ed by thermocouples was generally about 12 to 14 degrees above the basement temperature for test No. I, with no heat other than that from simulated occupants. The added heat in test No. 2 increased the temperature but also led to temperature gradients in the shelter, the differences between the 26 - and 52 -in. levels according to the thermocouples being about 6 and 11 degrees for the added heat inputs of 750 watts and 1200 watts respectively. This gradient is a function of the thermal characteristics of the heat source, as is well known to heating engineers, as well
as of the characteristics of the enclosur e , the ventilation rate and the way in which the ventilation air is introduced. Using the mean of the thermocouple readings at 26 and 52 in. as a reasonable index of the temperature determining comfort of the occupants it will be noted that the temperature of the shelter during the first week of
test No.2, with 750 watts (2550 Btu per hr) added was about 24 degrees above basement temperature, and during the second week (1200
watts, 4100 Btu per h r added) about 27 degrees. The hygrothermo-graphs showed a difference of 25 degrees and 32 degrees between
shelter and basement for the two periods, but these values are considered, for the reasons already given, to be somewhat too high.
The actual shelter temperatures, which rose to as high as 800
F at the 52 -in. level and to 70 of at the 26 -in. level corresponded to a basement temperature in excess of 45°F, the corresponding
mean outdoor air temperature (for the second week) being 29°F. It may be expected that for reduced outside air temperatures more nearly representative of January conditions in Ottawa, the shelter-tovbas ern ent temperature differences may be somewhat greater than that found in test No.2 for the same heat inputs. The input of 4100 Btu per, hr in addition to occupants would therefore be expected to produce a temperature rise in the shelter of 30 degrees or more, leading to a shelter temperature of at least 60 OF over the 26 - to 52 -in. levels, with a bas ement temperature of 30oF. Other shelter s
in other basements may behave differently. Ventilation rate, which will be di scu s s e d later, has an important effect since it can account for a substantial proportion of the heat loss from the shelter.
The humidities found during test No. 1 were not as great as had been anticipated. This was probably due to the low wall surface temperatures, especially in the basement, which may have provided some dehumidification by condensation. The shelter relative humidity remained fairly steady at about 58 per cent, while that in the basement
ros e to 63 per cent during test No.1. In test No. 2 with added heat, b a s ern errt relative hurni dity rose to 68 per cent while that in the shelter dropped to about 35 per cent. Since r elati ve hu rrri dit y is a function of absolute rnois tu r e content and teITIperatur.e it is instructive to observe the curves of absolute hurnidi.t y, given as hurnid ity ratio, in Fig. 13. FroITI these it will be seen that hurnidity
ratio decreased in both ba s ernent and shelter during test No.1, but increased during test No.2, the hurni dity ratio for the shelter being higher than that for the ba s ern errt in both bases. No particular hurn i di.ty p r ob l ern s are indicated and it ITIay be a s surn e d that
condensation on cool surfaces will in rno st cases provide control over any tendency for relative hurn i dity to rise to objectionable levels in ba s ern ent shelter s under Canadian winter conditions.
9.
Discussion of SUITIITIer TeITIperatures and HUITIiditiesNo unusual conditions of ternp e r atu r e and hurnidi.ty were shown for either of the SUITIITIer tests.
SUITIITIer shelter conditions will probably be distinctly un cornfo rtab l e. The rn e an July daily ternp e r atu r e for Ottawa and Montreal is about 67 OF and the 10 per cent hourly frequency ternp e r «
ature for July is 80°F. T'ernp er-atu.r e s above 85°F in the shelter are therefore to be expected in the Ottawa, Montreal and Toronto areas. Unfortunately, little can be done about this, and any extr e rn e conditions will have to be tolerated.
10. Discussion of Winter Ventilation Rates
The shelter ventilation rates calculated fr orn the h e l iurn tracer d et e r rrriri atiori s ar e shown in Fig. 15 plotted against shelter-to -ba s ern ent terrip e r a.tu r e difference. The ternp e r atur e s used were e stirn at e d fr orn the tb.e r rno coup l e readings for the rn e an height of the upper and lower ventilation openings, since it is the difference in density of air fr o m inside to outside over the height between upper and lower ventilation openings, which produces the flow of air. Calculations based on pressurization tests rn a d e on the shelter
with all ventilation openings blocked off indicated that leakage through the shelter ceiling was less than 10 per cent of that through the
ventilation openings. Consequently no corrections were considered to be necessary for leakage through the ceiling or around the door which was tightly closed during tests.
difficulties wer e encounter ed which ne od not be detailed in this paper. It is sufficient to note that the results given check suf-ficiently well with calculations based on the theory of flow through orifices to provide reasonable assurance that the real ventilation rates were at least as great as those given. During test No. 1 the ventilation rate was found to be about 4 air changes per hr, providing 1600 cu ft per hr total or 5. 3 cu ft per min for each of five occupants. This is more than adequate when only occupants of the shelter are involved.
Under the simulated heating conditions of test No. Z
with 4100 Btu per hr added, the ventilation rate was about 8 air changes per h r , providing 11 cu ft per min for each of five occupants or 55
cu ft per min total. This may be compared to the estimated requirement (see Appendix A) of 55 cu ft per min to care for the burning of
l/Z-lb of liquid fuel per hr with all gases discharged to the shelter. Such a fuel rate which represents the burning rate for many small stoves would provide 10,000 Btu per hr total, or 5000 Btu per hr if operated as a heater with a heat delivery of 50 per cent. Even if all gases were delivered first to the shelter the carbon dioxide concentration would be increased only by O. 5 per cent within the shelter. The use of a stove under a hood will result in the collection of a large portion of the gases before they mix with the shelter air; a closed stove will deliver all gases outside the shelter. All of the discussion thus far has assumed that the concentration of carbon dioxide in the basement air that is being delivered to the shelter for ventilation is negligible.
It is of inter est and of some importance to consider the heat losses associated with the measured ventilation rates. In test No. 1 the difference in temperature between incoming and leaving air is about 14°F. A ventilation rate of 1600 cu ft per hr results in a heat loss of 410 Btu per hr, or about one-third of the sensible heat given off by the occupants. In test No. Z the stratification of the air resulted in proportionately higher heat losses in ventilating, and the temperatur e differ ence between incoming and outgoing air is estimated to be about 35 F degrees. At an air change rate of 8 per hr, providing about 3Z00 cu ft per hr, the ventilation heat loss is about 2000 Btu per hr, which accounts for about 37 per cent of the sensible heat input by occupants and through added heat.
Temperatur e gradients in the shelter are undesirable since they result not only in excessive temper,atures at higher levels which
do not contribute to comfort, but they also add to the heat loss by ventilation.
depended largely on the cracks around two s m a Il windows in the east wall of the basement, and upon the lar ger opening below the door leading to the kitchen. Some air exchange no doubt took place between the basement and upstairs through the ducts of the warm air heating system, since registers were left open in both locations. There was some evidence also of air flow by way of the chimney
through the furnace and draft regulator opening particularly during the colder weather of test No. 1 in which a down draft of outside air was responsible for frost accumulation on the flue pipe.
Bas ement ventilation rates determined by the helium tracer technique during the winter trials are given in Table 1. They varied from a low of 0.24 air changes per hr at a time when the basement-to-outside temperature difference was 20 F degrees, with a 13 mph wind, to 0.69 when the temperature difference was 34 F degrees and there was a 15 mph wind. The buoyancy effect with basement air warmer than outside provides the motive force for basement air change in winter. This may be augmented by wind pressure. An air change rate of 0.25 in the basement of 5800 cu It produces 1450 cu ft per hr or
24 cu ft per min of fresh outside air for ventilation. This is insufficient to limit the carbon dioxide to 0.5 per cent in the basement when fuel is being burned at the higher rate of 1/2 lb per hr, since 55 cu ft per min are required. With the carbon dioxide uniformly mixed throughout the basement the air being drawn into the shelter will
already have a carbon dioxide concentration about double the desirable limit of O. 5 per cent, and this will be further increased within the shelter.
Basement ventilation has been shown to be critical, even in winter, when fuel is to be burned with gases delivered to the basement, if the desirable limit of O. 5 per cent on carbon dioxide is to be met. It may be that the gases of combustion which will always be hot will leak from the basement at upper levels, leaving the lower levels from which the shelter air is drawn at a reduced concentration. The basement in which the trials were run is relatively tight, and all tests were run with the door to the upstairs closed. Opening the
basement door would allow an exchange of air with the rooms upstairs, but would result in some loss of heat and thus in a reduction of basement temperature. Increased basement ventilation with outside air would result in a further decrease in basement temperature. Further study and perhaps further winter trials with direct measurement of carbon dioxide ar e indicated. Venting of heating appliances to a chimney or directly to outside may have to be recommended if it is confirmed
that the basement ventilation r at e s and thus the potential carbon dioxide concentrations are as indicated at present.
11. Discussion of SUIT1IT1er Ventilation Rates
During SUIT1IT1er operation shelter ventilation rates will be adequate. Cooking and therefore the production of additional
carbon dioxide will be at a IT1iniIT1UlTI; the occupants will be the principal source of carbon dioxide. In addition, the door to the shelter can be left wide open, to au gm ent the ventilation. The ba s ern ent ventilation rnu st , however, be carefully considered since, although there will be little carbon dioxide produced by stoves or heaters, b a s ern erit ventilation IT1ay also be expected to be substantially reduced over
winter conditions. In winter the b a serrrerit will be war rn e r than outside, producing a tendency for ba s ern ent air to escape; in SUIT1IT1er, for
part of the tirn e at least, the ba s ern ent air will be cooler than outside; and will therefore tend to r erna.in in the ba s ern ent ,
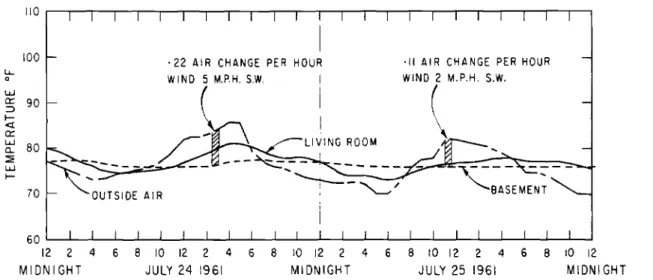
The te rnp e r atu r es pertinent to ba s em ent ventilation are shown in Fig. 23 for 24 and 25 July. During the rn i dd l e of the day the ba s em ent is cooler than outside. Me a su r ern ent s of air change using the h e I iurn tracer technique were rn ad e during this period as shown. The results of further m e a su.r ern ent s are shown in Table 1. Venti-lation rates varied fr o m O. 11 to a high of O. 32 air changes per h r , the latter appearing unusually high when c ornp a r e d to other results, being in excess of SOIT1e of the winter values.
The probable lTIiniIT1uIT1 ba s ern ent ventilation rate of O. 11 air changes per hr will provide 640 cu ft per hr or 11 cu ft per IT1in for ventilation in the ba s ernent vo.lurn e of 5800 cu ft. The IT1iniIT1uIT1 required to care for the carbon dioxide fr orn five occupants, with an increase of only 0.5 per cent is 2.4 x 5
=
12 cu ft per IT1in. The carbon dioxide in the b a s ern errt Ir o m occupants alone IT1ay therefore approach or exceed the desirable Ii m it of O. 5 per cent. Air entering the shelter will already contain 0.5 per cent carbon dioxide and this will be further increased within the shelter. The test house IT1ay have had abrio r rn a l ly low air leakage to the b a s ern errt since it is reasonably tight and there are two ba s ern ent windows, on one side only.Ba s ern ent ventilation rn e a su r ern ent s carried out during test No. 3 could not be repeated at frequent intervals because of their
cornpl exity and so it was not possible to follow closely any changes. As ult imat ely it is carbon dioxide concentration which is of direct concern, it was decided in test No. 4 to, s irnuIat e the heat and carbon dioxide of occupancy by rn e an s of stoves, and to att ernpt to m ea sur e carbon dioxide concentrations directly. The rno di.fi e d Orsat used was not sufficiently sensitive and accurate for the purpose but SOIT1e
measurements were obtained. In general the readings were not
sufficiently reliable to establish the differences if any, between shelter and basement and between upper and lower levels. Concentrations at all four locations were found to rise from the start of the test on 24 August to values of from 0.10 to 0.40 per cent hy 26 August. They then decreased, falling to the range 0 to O. 1 per cent on
30 and 31 August and then increased to the range 0.2 to 0.4 per cent by 4 September, with two readings at one location being as high as 0.6 and 0.7 per cent. Despite the lack of confidence in these readings they are compatible with the conditions indicated by the ventilation rate measurements, and indicate further that the ventilation rate may be variable with time.
12. Conclusions
1. Basement temperatures may fall below freezing during some part of a period of 2 weeks in January when heating systems are shut down as in an emergency in areas having mean January temperatures of 10°F or lower.
2. Shelter temperatures can be maintained in a basement fallout shelter of the type recommended at about 13°F above basement temperatur e with no added heat and ventilation at the rate of 5 cu ft per min per per son.
3. Shelter temperatur es may fall below 50oF without added heat in
areas having mean January temperatures of 10°F or lower. Shelter temperatures may approach freezing at times in areas having mean January temperatures of 0°F or lower.
4. The introduction of heat at 4000 to 5000 Btu per hr will maintain shelter temperatur es at abo ut 30 F degrees above basement temperature. 5. Relative humidities in the shelter in winter are unlikely to be
so high as to be a problem.
6.
The provision of heating in shelter s for winter climates similar to Ottawa is desirable, to prevent temperatures falling at times below50OF.
7. The provlSlOn of heating in shelter s, for winter climates similar to Saskatoon is essential, to prevent temperatures falling at times well below 500
8. Dry bulb ternperatures in the shelter in summer may exceed 85°F at ti rn e s in areas having surnrn e r weather similar to Ottawa, and relative humidities will be high, but 85° effective temperature is not likely to be reached or exceeded, if the heat and moisture from cooking and lighting ar e dispelled to the bas ernent by means of a hood and vent.
9.
The recommended shelter design will provide sufficientventilation to Iim it the increase in carbon dioxide concentration within the shelter to 0.5 per cent when all the gases from fuel burning at the rate of 1/2 Ib per hr are being delivered to the shelter, pr o vi d e d that 40 per cent or more of the heat released is made available to heat the air in the shelter.
10. Basement ventilation in winter in the experimental house is sufficient to maintain carbon dioxide concentrations in the basement and shelter at or below 0.5 per cent with occupants plus limited fuel burning for lighting and cooking when gases of combustion are released to the basement.
11. Bas ern ent ventilation in winter in the experimental hous e is not sufficient to maintain carbon dioxide concentrations at or below 0.5 per cent at all times when additional fuel for heating is used, with gases of combustion released to the basement.
12. Basement ventilation in summer in the experimental house is probably not sufficient to maintain carbon dioxide concentrations at or below O. 5 per cent at all times even when the occupants are the only source of carbon dioxide.
13. Ways and means of heating shelters and of reducing the concentration of carbon dioxide which may accumulate in basements require further study.
REFERENCES
(1) Yaglou, C. P. "Limits for Cold, Heat and Hurni di.ty in Underground Shelter s ", Archives of Environmental Health Vol.
2,
Feb.1961,
pp. 24/110 -29/115.
(2) Kent, A. D. "Construction of an Experimental Basement Fallout Shelter ", Internal Report No. 236, Division of Building Research, National Research Council of Canada,
1961.
(3) T'arriur a , G. T. "Ventilation Measurements in a Basement Fallout Shelter ". To be issued as an Internal Report of the Division of Building Research.
BIBLIOGRAPHY
Heating and Air Conditioning by Allen, J. R., Walker, J. H. , and James, J. W., McGraw Hill, London. Sixth Edition 1946. Guide of the American Society of Heating,Refrigerating and Air Conditioning Engineers, published annually by the Society, in New York.
Viessman, W., Air Conditioning for Protective Shelters, Heating, Piping and Air Conditioning, November 1954, p. 123 -127 and December 1954, p. 84-88.
Climatological Atlas of Canada, 1953. Published jointly by the Meteorological Division of Department of Transport and the Division of Building Research, National Research Council. NRC 3151.
TABLE I
BASEMENT VENTILATION RATES DURING WINTER AND SUM-MER TESTS
Date Basement Upstairs Outside Wind Ventilation
Air Temp, Air Temp. Air Temp. mph Rate. Air
of of of Change/Hr
(HTG) Test No. 1 (Winter)
15.1.61 43 37 20 4E .26
18.1.61 39 28 5 15 NW .69
19.1.61 34. 5 27 6 11 NW · 31
Test No. 2 (Winter)
23.2.61 49 46 29 13 E .24
28.2.61 51 49 35 12 W .37
Test No. 3 (Summer)
20.7.61 76 86 86 2 SE · 16 21.7.61 75 77 83 3 SW · 11 24.7.61 76 79 84 5 SW .22 25.7.61 76 77 82 2 SW
.11
25.7.61 76 75 70 1 W · 17 26.7.61 76 80 81 5 NW .21Test No. 4 (Summer)
29.8.61 74 75 75 5W .17
30.8.61 76 72 79 1 W · 12
1.9.61 77 83 85 3 S · 16
<D N
l
e, " ,I I ' -+-WATER METER"0 ,
L 'LOCATIONS __セ
__セ⦅b
__ioo---n--I---"4:::---t ---
---Ii _-'I-..< ⦅ZN⦅セ THERMOCOUPLE LOCATIONS SHOWN XMMセヲMMM
セ l5< -]1 ===f"" II C r-セ
"- ;I,-セNZ l -•
F'
:.
'0 It-::: -::::-Iii -
セ
- .'<D I',I ::'.[
セ </' セ I L--I .., L j I r .</, W.- j , . ;;;;;: <D .' I'-'...'SECTION A-A SECTION B-B
Figure 5 Shelter interior, showing occupancy simulators and thermocouples
I
I
t,
Figure 6 Basement installation of thermocouples and water meter
Figure 7 Thermocouple switch box and potentiometer indicator
100 NO ADDITIONAL HEAT ADDITIONAL HEAT ADDITIONAL HEAT750 WATTS
I
1200 WATTS -20' I ! ! I ! , ! , ! I ! ! ! ' I I I 10 12 14 16 18 20 22 24 JANUARY 1961 2 4 MARCHM\cBBBGZZZlセ
/"
-14 16 18 20 22 24 26 28 FEBRUARY 1961,/\
I
/
\ SHELTER \GセセXasement
<.セGM
',-- '----,
I
J'
..._--
.... LIVING-- : ROOM 8 o 80 u, 0 1.&.J 0:: セ 60 <I: 0:: 1.&.J 0-セ セ 40 0:: <i 20 FI GURE 820 I I I ! I I I I ! ! [ I I I I , 80 70 l.L. 0 l.LJ 0:: セ 60 セ <! 0:: l.LJ 0-:E セ 50 0:: <! 40 30 8 10 12 14 16 18 20 22 24 JANUARY 1961 750 WATTS
I
1200 WATTSADDITIONAL HEAT ADDITIONAL HEAT
14 16 18 20 22 24 26 28
FEBRUARY 1961
2 4
MARCH FIGURE 9
80 ;:- 70 z w
g;
60 I-<t Ck: W a. セ セ 50 w u セ Ck: :::> 40 (/) 30 20 TEST NO I NO ADDITIONAL HEAT 8 10 12 14 16 18 20 22 24 JANUARY 1961I',
I ...- ..."'-,1,
1. ',...
"
BASE MENTj,./ CEILING/ 750 WATTSI
1200 WATTSADDITIONALHEAT ADDITIONAL HEAT
14 16 18 20 22 24 26 28 2 4
FEBRUARY 1961 MARCH
FIGURE 10
FLOOR AND CEILING SURFACE TEMPERATURES AS RECORDED BY THERMOCOUPLES
2 4 MARCH 28 26 BASEMENT WALL 18 20 22 24 FEBRUARY 1961 16 750 WATTS
I
1200 WATTSADDITIONAL HEAT ADDITIONAL HEAT
14 I I I I 24 22 '-'" 20 16 18 1961 SHELTER WALL 661/2"ELEV 411/4"ELEV 17"ELEV 12 14 JANUARY 10 8 20 I I I I ! ! ! ! ! ! ! I I I I 30 u, o 70 z w 60 a:: => f0-e:[ a:: w セ 50 w fo-W '-'
c;:
40 a:: => U1 FIGURE IIWALL SURFACE TEMPERATURES AS RECORDED BY THERMOCOUPLES
20 I I i i ! I I ! I I ! i I ! ! I I I 80 I-セ 70 u a:: l.LJ a.. >-'"60 セ セ :E セ ::c 50 l.LJ
:::
I-<I ,:;j 40 a:: 30 8 NO ADDITIONAL HEATC
/"\,BASEMENT/---" 411' - - \.... - 'r-!=
MM\Gセセ
/ , __1 - - - セ SHELTER,
,
I I,
10 12 14 16 18 20 22 24 JANUARY 1961 14 750 WATTS I 1200 WATTSADDITIONAL HEAT ADDITIONAL HEAT
16 18 20 22 24 26 28
FEBRUARY 1961
2 4
MARCH
FIGURE 12
2 4 MARCH 14 16 18 20 22 24 26 28 FEBRUARY 1961 10 12 14 16 18 20 22 24 JANUARY 1961 8
o
w 60 NO ADDITIONAL 0:: I I =:l ! HEAT 50 I -lJ... V) I 750 WATTS I 0 0 ADDITIONAL HEATI Z セ 50-
0::/\
1---lJ... -w 0<1: 0:: =:l V) >-'\1
LSHEm
'
セ zO::is
40 <i 0 40 \ 0:: lJ... \ a. <.:;>0 \ セ Z O\"
w I - 35 _ z I -0 6 \ セhelter I z ;=a. セ 30 <I: 0:: ,'\BASEMENTャセOセZ[eMmZZtM
O::w a.-_...
"'"
3: 20 ...,
w ,,,,,,,,..., 0,
,
1 20"
""--,-_I I LIVING ROOM
....
-
........ 10I ... 10 0 -20 FIGURE 13DEW POINTS AND HUMIDITY RATIOS FROM HYGROTHERMOGRAPH READINGS OF TEMPERATURE AND RELATIVE HUMIDITY
IZ NOON JAN 9th TO IZ NOON JAN Z 3 rd IZ NOON FEB 15 TO IZNOONMAR l st セ z 20 I-en t-en o ..." lZ00 WATTS ADDITIONAL HEAT
,---,
,
,
,'--SHELTER,
750 WATTS ADDITIONAL HEAT SHELTER,\セ
M M M ⦅ |N M-
---.
BASEMENT w 10 I--0: :::> t-en o :::E ::; 15 l- t-Z LU t-Z o u 5 I--0 1 I I I , I I 1 , I J I I I I I I I 8 10 12 14 16 18 20 22 24 14 16 18 20 22 24 26 28 I JANUARY 1961 FEBRUARY 1961 FIGURE 14MOISTURE CONTENT OF CEILING JOISTS
8 0:: ::J o :I:
5
6 a. (J) LL.J (,:;l Z <t 4 ::I: U 0:: <to TEST No.1 (UNHEATED TRIALS) • TEST No.2 (HEATED TRIALS)
o f:P o
-:
•
2 4 8 12 16 20 24 28SHELTER - BASEMENT TEMPERATURE DIFFERENCE, of
SHELTER
セセ
セy
lSI MULATED OCCUPANCY - HEAT AND CO2;SIMULATED COOKING; LANTERN BURNING CONTINUOUSLY LIVING ROOM OUTSIDE OCCUPANT SIMULATION INCOMPLETE
SIMULATED OCCUPANCY- HEAT AND MOISTURE; SI MULATED COOKI NG
I
k
shelセI
.
a - .:
u, o 90 60 セ 80 ;:) t-<t 0:: W a. セ 70 t-o:: -er 50 10 12 14 16 18 20 22 24 26 28 JULY 1961 24 26 28 30 AUGUST 1961 2 4 6 8 SEPTEMBER FIGURE 16CO2;SIMULATED COOKING; LANTERN BURNING CONTINUOUSLY SHELTER AIR BASEMENT AIR 52" ELEV. MOISTURE;SIMULATED COOKING
I
SHELTER AIRセ
NM GB -,-"""-'V
I '"-セセWXBelevN
52" ELEV.I
I
26" ELEV. BASEMENT AI R I I OCCUPANT SIMULATION INCOM.PLETE 90 60 セ 80 :::J l-e:[ e::: w a.. ::;: w 70 l-e::: e:[ l.L. o 50 10 12 14 16 18 20 22 24 26 28 JULY 1961 24 26 28 30 AUGUST 1961 2 4 6 8 SEPTEMBER FI GURE 17/ / \', " , - - ; ' /'"
/""''--;:''-'V "..."",
イ
O セ O |Z Z ⦅ O O
/;H-;L TER ' ...., . FLOOR I BASEMENT FLOOR...
セ,
-,,
l
'
GZGGGGヲLGGセ
--//----',
,,,I' '><=":="SHELTER , / FLOOR I ,,'" . I / (" BASEMENT I I <: '-.... I I " FLOOR -1-' I I I OCCUPANT I SIMULATION INCOMPLETE u, 0 z 80 l.J.J a:: セ I -セ a:: セ 75 ::;; l.J.J I -l.J.J U セ u, 70 a:: セ (J) 65 SEPT 1961 10 12 14 16 18 20 22 24 26 28 JULY 1961 24 26 28 30 AUG 1961 3 5 7 FIGURE 18FLOOR AND CEILING SURFACE TEMPERATURES AS RECORDED BY THERMOCOUPLES
BASEMENT SHELTER BASEMENT OCCUPANTI simulatャoセ INCOMPLETE 65 W 0:: :;) f-<0: セ 75 c, :::l; w f-w u セ 70 0:: :;) V> u, o 80 z 10 12 /4 /6 18 20 22 24 26 28 JULY 1961 24 26 28 30 AUG 1961 3 5 7 SEPT 1961 FIGURE 19
WALL SURFACE TEMPERATURES AS RECORDED BY THERMOCOUPLES
2 4 6 8
SEPTEMBER BURNING CONT INUOUSLY
BASEMENT
セMMMセBLL⦅j
I
セMMMMセ " \ \... SHELTER 24 26 28 30 AUGUST 1961 I I I...,+. .+....__
BASEMENTjセセiセ」Zセ[セェサ
セ
. SHELTER OCCUPANT SIMULATION INCOMPLETE I\..., I. ""'jI·... LIVING ROOM
10 12 14 16 18 20 22 24 26 28 JULY 1961 50 90 セ z w U 0:: W c, 80 >-セ Cl セ ::J :l: 70 w > セ « .-J w 0:: 60 FIGURE 20
2 4 6 8
SEPTEMBER
C02iSIMULATED COOKING; LANTERNi
BURNING CONTINUOUSLY I I
shelteセO|
I 8ASEMENTJ
,--..,;1-, \
Iセ
/ 1"
...
セ ....\
\\ セ 1 " I.... /
II,
24 26 28 30 AUGUST 1961 MOISTUREiSIMULATED COOKINGM
OCCUPANT SHELTER SIMULATION INCOMPLETE LOセ⦅L セ ---A エOセ j . / " I \1 \1\.::
V ,0i>/
r;
BASE{S)'.
".'\:..._-1
outsideセ
II'
I 60 100 :;:) 140 I -CJ) 40 I I I I I I I ! I I I I [ I ! ! 10 12 14 16 18 20 22 24 26 28 JULY 1961 r I -o :::!: :;:) J: o :::!: 0:: La.. -o セ 120 CJ)r zO:: _ 0 セ o::lJ.. <.:>0 Z O _ z06
i=c. セ 0:: 80 O::w c. 45 55 50 セ 60 w o lJ.. 75 o w 0:: :;:) I-セf5
70 c. :::!: w l -I- 65 zo
c. FIGURE 21DEW POINTS AND HUMIDITY RATIOS FROM HYGROTHERMOGRAPH READINGS OF TEMPERATURE AND RELATIVE HUMIDity
:::!E wa:::z セ - 16 4 セ セセキU)a::: u Cl octw Z 12 TEMP DIFF
3 w 」ョqNNセ (scale at left) w ':;;w o, wwu.. r .... , ) U) cャャMセ 8 I ... , 2 Cl u; Cl I \ z I -4
/
'
セ セ / '"
... 0"
0 0 I -Z ·7 z 0",
W I -'1
<..> <l RANGE OFL
I a::: a::: '6 w I - CARBON セii
n, Zl- DIOX IDE • I Z Wz ·5 I ·005 Uw (scale at left) : \ I ZU"
Z85
I I 0 '4 CARBON MONOXIDEJ
IIt
·004l-on.
I I' oct I a::: U z ·3 • (scale at right) I"
'003 l-..\ w,
I ,t Z,,'
W <.!> MZセB U oct ·2 I '002 Z a:::,
0 w I <..> > -I ·00 I <l 0 U 0 0 24 26 28 30 AUGUST 1961 FIGURE 22CARBON MONOXIDE AND CARBON DIOXIDE CONCENTRATIONS AND THEIR RELATIONSHIP TO WIND SPEED AND TEMPERATURE DIFFERENCE
u, e w § 90 t-<l: 0:: セ 80 ::; W t-70
·22 AIR CHANGE PER HOUR WIND 5 M.P.H. S.W.
I
I
LIVING ROOM
·11 AIR CHANGE PER HOUR WIND 2 M.P.H. S.W.
(
\
B 10 12 MIDNIGHT 8 10 12 2 4 6 JULY 25 1961 6 6 8 10 12 2 4 MIDNIGHT 6 8 10 12 2 4 JULY 24 1961 60! I ! ! ! ! ! ! I I I ! I I I ! ! I I ! ! ! I I I 12 2 4 MIDNIGHTEFFECT OF OCCUPANCY UPON SHELTER CONDITIONS Occupants in a space may be likened to small, fuel-burning stearn power plants. They take on fuel in the form of food, along with air for "cOlnbustion" of the fuel, and water. A portion of the energy released by combustion may be converted into useful work. The re-mainder must be rejected more or less continuously. Unlike a power plant, however, the human body uses some of the fuel intake for growth and repair. Waste products are rejected in solid, liquid and gaseous or vapour form. Those of primary concern, so far as effect of occupants on shelter climate is concerned, are the water vapour and carbon dioxide, along with the heat rejected, some of which appears as latent heat in as sociation with the water vapour. The solid and liquid wastes, though a problem in shelter occupancy, require separate means of disposal and do not affect the shelter climate as do the others.
Again, like a power plant, the human body requires increas ed fuel as its activity or work load is increased, leading to proportionately increased rates of heat, moisture and carbon dioxide production and rejection. Typical values of heat and moisture production for normal adults are given in Table A I.
TABLE A I
Heat dis sipated, Btu/hour jperson
Seated at rest Standing at rest
Office worker, moderately active Walking 4 mph Sensible 225 225 225 Latent 159 206 265 Total 384 431 490 1400 The moisture gains to the space from these occupancies may be found with sufficient accuracy by dividing the latent heat values given by 1050, the approximate value of the latent heat of evaporation. These rates of moisture rejection may be substantially increased under sweating conditions when the body is attempting to rid itself of extra heat to main-tain uniform body temperature. Some of the perspiration may, however, remain as liquid if the conditions are not such as to cause it to be evaporated.
It may be noted that in the case of an underground shelter which is to be ventilated by a manually operated blower, the occupant working hard at the blower gives off increased heat, moisture and carbon dioxide to add to that which his efforts are directed to removing through forced ventilation. In the same way, increased activity of the occupants, even if
not directed to useful work, leads to increased rejection of heat, moisture and carbon dioxide to the shelter atmosphere.
The average person at rest inhales about 18 cu ft of air per hr. The inhaled air loses about 5 per cent oxygen and gains about 4 per cent carbon dioxide. Compositions of free atmosphere air and of expired air on a per cent by volume basis are given in Table A I I.
TABLE A II Oxygen Nitrogen Carbon dioxide Free Atmosphere 20.9 79. 1 0.03-0.04 Expired Air 15.4 79.2 4.04
The figures given for heat, moisture and carbon dioxide rejection from the body are more meaningful if related to the changes that they are capable of producing on the ventilation air supplied. The minimum venti-lation rate suggested for shelters is 3 cu ft per min per person, or 180 cu ft per hr. This is 10 times the inhalation rate of 18 cu ft per hour and will, therefore, produce an atmosphere deficient in oxygen by about O. 5 per cent from normal, and increased by about 0.4 per cent in carbon dioxide content. The O. 5 per cent deficiency in oxygen may be considered of little significance, corresponding to the reduction of partial pres sure of the oxygen caused by an increase in altitude of less than 1000 ft.
Contrary to popular belief, reduction in oxygen content will seldom become a limiting factor in occupancy with any normal type of enclosure which has not been especially designed to be airtight.
The limiting concentration of carbon dioxide permitted for 8 hr per day occupancy is O. 5 per cent, so that 3 cu ft per min per person of ventilating air produces acceptably low concentrations. Con-centrations up to 2 per cent or more are considered acceptable for short-time emergency conditions extending over a few hours, while concentrations of 4 per cent which are those found in expired air, are still not lethal,
though the y m ay cause the respiration rate to double and may begin to produce headaches and nausea in some individuals. Exposure to 25 per cent carbon dioxide does not result in immediate death.
The heat and moisture produced is sufficient to influence very considerably the temperature and humidity conditions of the air, if all of it is to be taken up by the minimum ventilation rate of 3 cu ft per min per person. This is not a normal condition, since heat and moisture
losses to the surroundings will usually occur as well, but it is instruc-tive to consider it. The leaving air conditions for three entering air conditions, a s s uming all heat and rnoisture must be taken up by the air, and for 3 cu ft per min per occupant releasing 225 Btu per hr of sensible heat and 206 Btu of latent heat are as given in Table A I I I.
TABLE A III Entering Air
Dry Bulb Relative Humidity
Leaving Air (room air)
Dry Bulb Relative Humidity Dew Point 50% 80 75 142°F 75 139 18%
90
21The last two entering air conditions listed are the outdoor average conditions for January and July in Ottawa. It will be seen that with greatly reduced ventilation quantities and with no other means of losing heat than by ventilation, body heat and moisture are capable of p r odu c in g a very marked warming and humidifying effect. While this condition could be accepted in win te r , it be corn e s intolerable in summer. The need to reduce ventilation rates in winter for heat conservation and to increase them in summer to keep temperatures within tolerable limits is thus demonstrated. There is at all times a tendency to high humidity, leading to the possibility of dampness and condensation on cooler sur-rounding surfaces.
It is often considerations of odour level that determine rn mrrnurn ventilation rates under normal living conditions. Ventilation rates of 7 to 27 cu ft per min with fresh outside air have been shown to be required to maintain odours at threshold level for persons entering a space. The higher rates are required when the space per person is small (100 cu ft) and the lower rates when the space per person is high (500 cu ft). In a shelter with reduced space per person (80 cu ft), minimum ventilation rate (3 cu ft per min per person), restricted bathing and possibly with additional odours from food, smoking and wastes, the odour level will undoubtedly be very high. There is little pos sibility in winter of providing the 30 cu ft per min or rn o r e per person to maintain odours at threshold level for
a person entering from outdoors because of the excessive heat requirement to warm ventilating air, and the odour level will be very high and will have to be to l.e r atI.d in most cases. Fortunately, the odours will not be particularly noticeable to those continuously exposed to them, and they are not no r m a.Llv considered toxic or harmful, though a high odour level may produce headache in some sensitive persons.
![Simulation numérique des écoulements à surface libre dans des canaux à géométrie variable en utilisant le schéma de Beam et Warming [ressource textuelle, sauf manuscrits]](data:image/gif;base64,R0lGODlhAQABAIAAAP///wAAACH5BAEAAAAALAAAAAABAAEAAAICRAEAOw==)