HAL Id: hal-00822434
https://hal.archives-ouvertes.fr/hal-00822434
Submitted on 14 Aug 2016HAL is a multi-disciplinary open access
archive for the deposit and dissemination of sci-entific research documents, whether they are pub-lished or not. The documents may come from teaching and research institutions in France or abroad, or from public or private research centers.
L’archive ouverte pluridisciplinaire HAL, est destinée au dépôt et à la diffusion de documents scientifiques de niveau recherche, publiés ou non, émanant des établissements d’enseignement et de recherche français ou étrangers, des laboratoires publics ou privés.
Total columns of H2O measured from the ground and
from space at Observatoire de Haute-Provence in France
(44° N)
Sulaf Alkasm, Alain Sarkissian, Philippe Keckhut, Andrea Pazmino, Florence
Goutail, Manuel Pinharanda, S. Noël
To cite this version:
Sulaf Alkasm, Alain Sarkissian, Philippe Keckhut, Andrea Pazmino, Florence Goutail, et al.. Total columns of H2O measured from the ground and from space at Observatoire de Haute-Provence in France (44° N). Atmospheric Measurement Techniques, European Geosciences Union, 2013, 6, pp.4249-4277. �10.5194/amtd-6-4249-2013�. �hal-00822434�
AMTD
6, 4249–4277, 2013Water vapour at OHP S. Alkasm et al. Title Page Abstract Introduction Conclusions References Tables Figures J I J I Back Close
Full Screen / Esc
Printer-friendly Version Interactive Discussion Discussion P a per | Dis cussion P a per | Discussion P a per | Discussio n P a per |
Atmos. Meas. Tech. Discuss., 6, 4249–4277, 2013 www.atmos-meas-tech-discuss.net/6/4249/2013/ doi:10.5194/amtd-6-4249-2013
© Author(s) 2013. CC Attribution 3.0 License.
EGU Journal Logos (RGB)
Advances in Geosciences
Open Access
Natural Hazards and Earth System Sciences Open Access Annales Geophysicae Open Access Nonlinear Processes in Geophysics Open Access Atmospheric Chemistry and Physics Open Access Atmospheric Chemistry and Physics Open Access Discussions Atmospheric Measurement Techniques Open Access Atmospheric Measurement Techniques Open Access Discussions Biogeosciences
Open Access Open Access
Biogeosciences Discussions
Climate of the Past
Open Access Open Access
Climate of the Past
Discussions
Earth System Dynamics
Open Access Open Access
Earth System Dynamics Discussions Geoscientific Instrumentation Methods and Data Systems
Open Access Geoscientific
Instrumentation Methods and Data Systems Open Access Discussions Geoscientific Model Development
Open Access Open Access
Geoscientific Model Development Discussions Hydrology and Earth System Sciences Open Access Hydrology and Earth System Sciences Open Access Discussions Ocean Science
Open Access Open Access
Ocean Science
Discussions
Solid Earth
Open Access Open Access
Solid Earth Discussions
The Cryosphere
Open Access Open Access
The Cryosphere
Natural Hazards and Earth System Sciences
Open Access
Discussions
This discussion paper is/has been under review for the journal Atmospheric Measurement Techniques (AMT). Please refer to the corresponding final paper in AMT if available.
Total columns of H
2
O measured from the
ground and from space at Observatoire
de Haute-Provence in France (44
◦
N)
S. Alkasm1, A. Sarkissian1, P. Keckhut1, A. Pazmino1, F. Goutail1, M. Pinharanda1, and S. No ¨el2
1
Laboratoire Atmosph `eres, Milieux, Observations Spatiales (LATMOS), UMR8190, LATMOS/UVSQ/CNRS, Guyancourt, France
2
Institute of Environmental Physics/Remote Sensing, University of Bremen, Germany Received: 19 February 2013 – Accepted: 29 April 2013 – Published: 14 May 2013 Correspondence to: A. Sarkissian ([email protected])
Published by Copernicus Publications on behalf of the European Geosciences Union.
AMTD
6, 4249–4277, 2013Water vapour at OHP S. Alkasm et al. Title Page Abstract Introduction Conclusions References Tables Figures J I J I Back Close
Full Screen / Esc
Printer-friendly Version Interactive Discussion Discussion P a per | Dis cussion P a per | Discussion P a per | Discussio n P a per | Abstract
In this work, we compare vertical column density of water vapour measured at Obser-vatoire de Haute-Provence, Southern France (5◦420E,+43◦550N). Data were obtained by three satellite sensors, GOME, GOME 2 and SCIAMACHY, and by two ground-based spectrometers, Elodie and SAOZ. These five instruments are able to measure
5
total column density of water vapour in the visible and have different principles of ob-servation. All these instruments reproduce the total column water vapour with good accuracy. The mean difference between the satellite measurements, ground-based measurements, and between both types, are quantified. The diurnal cycle of water vapour above the station and its variability with latitude have been investigated. The
10
differences between these data sets are due sometimes to the differences in the time of the measurements, or to the differences in the geometry of observations, or also due to both effects. The effect of land and sea and the effect of the season on the total column water vapour has been analysed. The global agreement between our data sets range from 10 % in summer to 25 % in winter, improved significantly when observations
15
are closer in time and location.
1 Introduction
Water vapour is an atmospheric constituent that has a determinant effect on the cli-mate and on the weather. It represents two-thirds of the greenhouse gases, and is mostly located in the troposphere. It is the key element of the hydrological cycle,
20
conditioned by exchanges between its three phases in the atmosphere, the ocean and the continents, and also directed by the transport of energy between the surface and the atmosphere, by evaporation and condensation (Ramanathan, 1988). However, because of its large temporal and spatial variability, the measure of this component is a demanding task. For this reason, many different well-known techniques, such
25
AMTD
6, 4249–4277, 2013Water vapour at OHP S. Alkasm et al. Title Page Abstract Introduction Conclusions References Tables Figures J I J I Back Close
Full Screen / Esc
Printer-friendly Version Interactive Discussion Discussion P a per | Dis cussion P a per | Discussion P a per | Discussio n P a per |
1991; Soden and Lanzante, 1996); lidars (Hoareau et al., 2009); microwave radiome-ters (Scheiben et al., 2010), as well as less-known techniques such as balloon-borne, near-infrared InGaAs laser diodes (Durry and Megie, 1999); UV-visible MAX-DOAS spectrometry (Wagner et al., 2013); and astronomical telescopes (Sarkissian and Slusser, 2009) from the ground, in-situ or from space as the ones presented in this work
5
have been developed to estimate water vapour in the atmosphere. Also, the accuracy of the measurements’ changes from one instrument to another as the mode of observa-tion, the period of observaobserva-tion, the condition of measurement, and the retrieval method are different between them. Note that these instruments were not initially dedicated to water vapour measurements and the extraction of H2O was not the principle objective.
10
This paper compares measurements of total vertical column density (VCD) of water vapour, i.e. the amount of water vapour in a vertical atmospheric column, obtained above Observatoire de Haute-Provence (OHP), Southern France (5◦420E,+43◦550N) from five different instruments. This work compares results from two ground-based and three satellite instruments: the SAOZ (syst `eme d’analyse par observation z ´enithale) an
15
automated UV-VIS spectrometer; Elodie, a cross-dispersed echelle spectrograph and its 1.92 m telescope; SCIAMACHY, a scanning imaging absorption spectrometer for atmospheric cartography; GOME, a nadir-scanning ultraviolet and visible spectrome-ter for global monitoring of atmospheric ozone; and GOME2, a second generation of GOME. The objective of this comparison was to build up continuous decadal series of
20
H2O data. This challenge was first tested using similar methods, showing that some dif-ferences need to be explored. Promising infrared techniques (e.g. MERIS, IASI) could be used in the future, however, the differences about techniques, characteristic, and algorithms will be a next step used beyond the scope of this study. This article is struc-tured as follows: Sect. 2 presents a description of these instruments; Sect. 3 describes
25
the method used to select the satellite measurements above OHP considered for com-parisons; Sect. 4 presents the results and the comparison between the different data sets, as well as a quantification of their differences; Sect. 5 outlines the interpretation of the differences followed by Sect. 6, the conclusion and final remarks.
AMTD
6, 4249–4277, 2013Water vapour at OHP S. Alkasm et al. Title Page Abstract Introduction Conclusions References Tables Figures J I J I Back Close
Full Screen / Esc
Printer-friendly Version Interactive Discussion Discussion P a per | Dis cussion P a per | Discussion P a per | Discussio n P a per | 2 Instruments 2.1 SAOZ
SAOZ (Pommereau and Goutail, 1988) is a ground-based zenith-sky UV-visible spec-trometer. Water vapour total columns are obtained from twilight measurements at 592 nm using the differential optical spectroscopy method, averaged over 30–40
indi-5
vidual measurements taken from 86◦SZA (Solar Zenith Angle) up to 91◦SZA. Line-of-sight values of individual observations are divided by the air-mass factor of the obser-vation, the coefficient needed to obtain vertical amounts. This technique is the same as the one used to measure stratospheric constituents like ozone and NO2but extended for tropospheric constituents like water vapour. Note that multi-scattering effects are
10
enhanced at twilight and cannot be easily evaluated, and therefore the AMF corrected accordingly. Because the SAOZ operates permanently and observations are possible even during bad weather conditions (rain, clouds, etc.) data are available twice daily, morning (here and after a.m. values) and evening (p.m.) averages, all year round, de-pending on technical problems. Note that H2O data presented here are preliminary
15
real-time data, as they were not validated before in peer-reviewed publication. One of the objectives of this publication is therefore to bring quality feedback from the commu-nity about this data set and therefore to change its status and fill up the corresponding SAOZ database.
2.2 Elodie 20
Total column water vapour were obtained using observations of astronomical objects made between July 1994 and December 2004 with the 193 cm telescope and Elodie high-resolution spectrometer (spectral domain: 385 nm to 680 nm, sampling: 0.005 nm, Resolution: 0.0065 nm). H2O is measured visibly at 592 nm on individual spectra ob-tained when the source is close to the meridian, i.e. at higher possible elevation from
25
AMTD
6, 4249–4277, 2013Water vapour at OHP S. Alkasm et al. Title Page Abstract Introduction Conclusions References Tables Figures J I J I Back Close
Full Screen / Esc
Printer-friendly Version Interactive Discussion Discussion P a per | Dis cussion P a per | Discussion P a per | Discussio n P a per |
at zenith and 2 when the source is 30◦ above the horizon. Vertical amounts of H2O are averaged over 20–40 individual measurements taken during the entire clear night (Sarkissian and Slusser, 2009). Monthly averages of Elodie data are available regu-larly, as it is rare to have heavy cloudy skies rending astronomical observations not possible all night, but spectrometric observations are still possible when cirrus clouds
5
are present for example. It is also rare to have more than 15 fully cloudy nights a month at OHP and this is the reason we used this limit for acceptable monthly averages. Note that sometimes for technical reasons the telescope is stopped during relatively long pe-riods for failures or maintenance. Elodie short-term observations have been compared and was used previously to validate using lidar data at OHP (Hoareau et al., 2009).
10
2.3 Sciamachy
SCIAMACHY (SCanning Imaging Absorption spectroMeter for Atmospheric Cartogra-pHY) is a passive remote-sensing spectrometer observing backscattered, reflected, transmitted or emitted radiation from the atmosphere and the earth’s surface, in the wavelength range between 240 and 2380 nm. The instrument flies on board ENVISAT,
15
which was launched on 1 March 2002.
The primary scientific objective of SCIAMACHY is the global measurement of various trace gases in the troposphere and stratosphere, which are retrieved from the solar irradiance and the earth’s radiance spectra. The large wavelength is also ideally suited for the determination of aerosols and clouds. Validation of SCIAMACHY is essential to
20
ensure the quality of these derived products.
SCIAMACHY measures total columns of H2O on nadir mode in the visible part of the spectrum using AMC-DOAS method (Noel et al., 2004).
2.4 GOME
GOME (Global Ozone Monitoring Experiment) is a nadir-scanning ultraviolet and
visi-25
AMTD
6, 4249–4277, 2013Water vapour at OHP S. Alkasm et al. Title Page Abstract Introduction Conclusions References Tables Figures J I J I Back Close
Full Screen / Esc
Printer-friendly Version Interactive Discussion Discussion P a per | Dis cussion P a per | Discussion P a per | Discussio n P a per |
is from 240 to 790 nm with a spectral resolution of 0.2 to 0.4 nm, and a spatial reso-lution of 40 km × 320 km, indicating a global cover within 3 days and 43 orbits. H2O is retrieved using the AMC DOAS method in the visible part of the spectrum. GOME 1 (GOME, hereafter) was launched on the ERS2 platform, and GOME 2 on the METOP platform in October 2006 with the same spectral resolution of GOME1, but the spatial
5
resolution is much better with a ground-pixel size of 80 km×40 km. Since summer 1996, ESA has been delivering users three-day GOME global observations of total ozone, ni-trogen dioxide, and related cloud information via CD-ROM and internet. A key feature of GOME is its ability to detect other chemically active atmospheric trace gases as well as aerosol distribution (Noel et al., 1999).
10
3 Selection method of satellites measurements at the OHP
Each satellite measurement corresponds to a location on the surface of the earth that can be determined by the four sides of a quadrangle bounded by latitudes and longi-tudes ranges. Collocated measurements corresponding to ground-based observation are selected for latitude and longitude ranges that contains the coordinates of OHP. The
15
optimal choice for these ranges corresponds to a compromise between the highest cor-relation between the satellite VCD and SAOZ am (measurements closest in time) and a sufficient number of observations for performing representative monthly means that are determined to be at least 100 measurements. Table 1 gives a selection of results of these correlations, varying the latitude and longitude ranges around OHP. Hereafter,
20
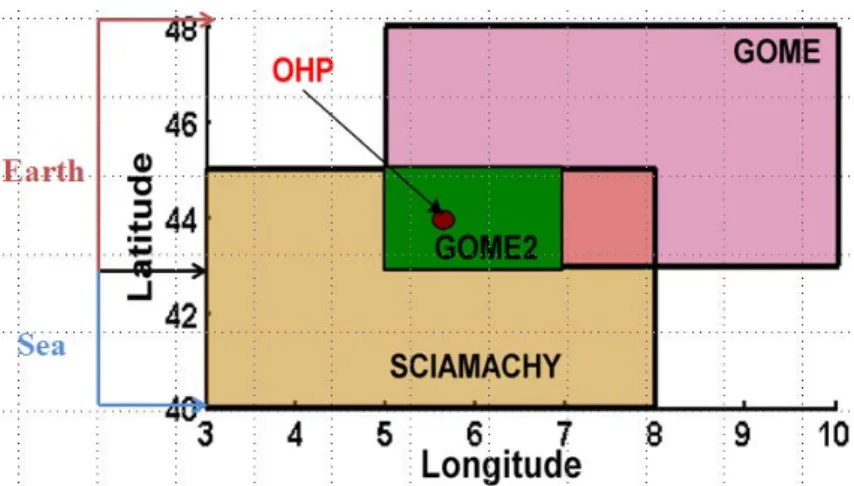
correlation coefficients were calculated using the Pearson method, ranging from −1 (opposite direction) to+1 (same direction), with an alpha coefficient of 0.05 (2-tailed). Then, the optimal quadrangle corresponding to the data selection area around OHP was founded different for each satellite, as illustrated in Fig. 1.
AMTD
6, 4249–4277, 2013Water vapour at OHP S. Alkasm et al. Title Page Abstract Introduction Conclusions References Tables Figures J I J I Back Close
Full Screen / Esc
Printer-friendly Version Interactive Discussion Discussion P a per | Dis cussion P a per | Discussion P a per | Discussio n P a per |
4 Results and discussion
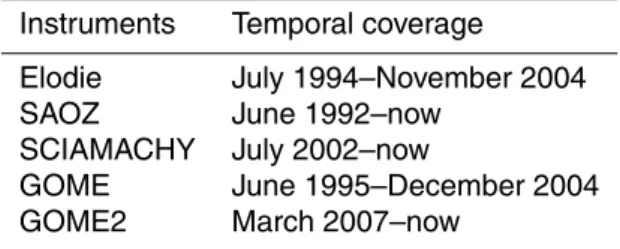
For this study we analysed and compared two VCD data sets of H2O above OHP. The satellites data sets are issued from SCIAMACHY, GOME and GOME2. The ground-based instruments are Elodie and SAOZ. Table 2 presents the temporal coverage for these data sets for each instrument.
5
We must indicate that data are available in various temporal and geographical sam-plings and for this study the comparison has been made in making monthly averages first, to maximise the number of coincidences that satisfy the temporal and spatial col-location criteria (as indicated for all instruments in Sect. 3) and then compare together the monthly means of each instrument.
10
4.1 Inter-comparison of ground-based measurements
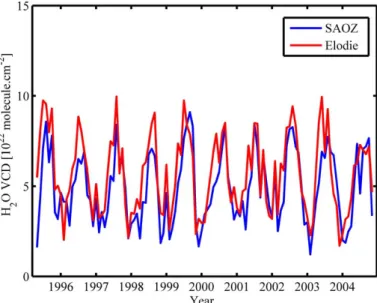
Monthly averages of the total column water vapour measured by SAOZ and Elodie, from 1995 to 2004 above OHP, both exhibit a clear annual variation (Fig. 2). SAOZ can measure H2O even in the presence of clouds, in contrast to Elodie which measures only by clear skies. SAOZ values are then expected to be slightly larger in comparison
15
with Elodie because of the higher occurrence of cloudy days (i.e. days with more H2O in the atmosphere) in the SAOZ series. For this reason, we have only selected the daily measurements of SAOZ that also exist in the Elodie data set (clear night conditions). In taking into account the coincident daily measurements, we have eliminated most of the cloudy days in the SAOZ data set.
20
The measurements of Elodie and SAOZ have trapped similar annual behaviours (Fig. 2), however, with small differences which appear sometimes during maximum or minimum values. The correlation coefficient is R = 0.8, and indicates a high correlation between the two types of measurements. We can see also note that for the year 2003 in the SAOZ dataset, the maximum of the seasonal cycle of this year is low relative
25
to other years, due to a change in the absorption cross section (convolution) and the spectrum of reference for this year (problem in the spectrometer slit).
AMTD
6, 4249–4277, 2013Water vapour at OHP S. Alkasm et al. Title Page Abstract Introduction Conclusions References Tables Figures J I J I Back Close
Full Screen / Esc
Printer-friendly Version Interactive Discussion Discussion P a per | Dis cussion P a per | Discussion P a per | Discussio n P a per |
4.2 Inter-comparison of satellite measurements above OHP
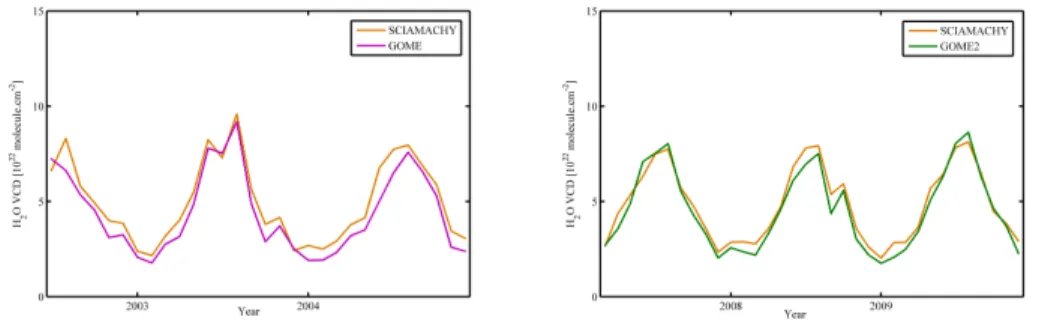
In this section, satellite products are inter-compared using SCIAMACHY measure-ments as reference because it covers the longest period covering the measurement periods of the two other instruments. The monthly mean of the VCD of H2O derived from the satellite SCIAMACHY, GOME for the years 2002–2004 and SCIAMACHY,
5
GOME2 for the years 2007–2009 above OHP (Fig. 3).
Despite the small difference observed, we can conclude that the measurements of the three satellites agree well over the OHP, with a correlation coefficient between GOME and SCIAMACHY of 0.97, and 0.98 between GOME2 and SCIAMACHY having been compared. This good agreement can be attributed to the fact that these three
10
instruments (SCIAMACHY, GOME, GOME2) have almost the same design, and use the same algorithm (AMC-DOAS) to achieve H2O, and also that the three instruments have low offset between their overpass times above OHP.
4.3 Comparison between ground-based and satellite measurements at OHP
In order to examine the representation of the satellite estimates of H2O above OHP
15
compared to the ground-based measurements, we compared the two types of data sets. As we mentioned above, the three satellites of this study utilise the AMC-DOAS algorithm to retrieve the VCD.
An air-mass correction factor in the algorithm effectively removes overly cloudy scenes, then the AMC-DOAS products are cloud-cleared Mieruch et al. (2008). To
20
make the comparison between the satellites and SAOZ measurements, we selected only the morning measurements of SAOZ that also existed in the satellites data sets, as it is the nearest period of their measurements.
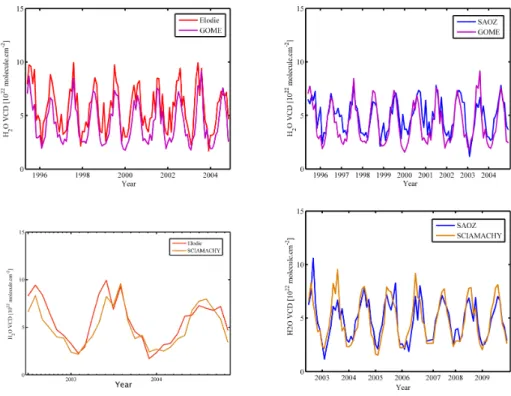
In Fig. 4, we compared the monthly averages of VCD obtained by Elodie, GOME from 1995 to 2004, Elodie, SCIAMACHY from 2002 to 2004, SAOZ, GOME from 1995
25
to 2004 and SAOZ, SCIAMACHY from 2002 to 2009. From these figures we can conclude that:
AMTD
6, 4249–4277, 2013Water vapour at OHP S. Alkasm et al. Title Page Abstract Introduction Conclusions References Tables Figures J I J I Back Close
Full Screen / Esc
Printer-friendly Version Interactive Discussion Discussion P a per | Dis cussion P a per | Discussion P a per | Discussio n P a per |
– The measurements of GOME and SAOZ are in good agreement with a correlation
of high-order (0.8) and a difference appears sometimes between their maximum values, as in the year 1998, or between their minimum values as in 2000.
– The measurements of SCIAMACHY and SAOZ are also in good agreement, with
a maximum in SCIAMACHY higher than SAOZ for most of the year and a
moder-5
ate correlation (0.77).
– The comparison between the measurements of Elodie and the satellites GOME
and SCIAMACHY shows that those of SCIAMACHY and Elodie (R= 0.91) are in similar agreement than those of GOME with Elodie (R= 0.90), with a slightly better agreement for SCIAMACHY.
10
4.4 Quantification of the differences between the measurements
According to the figures previously shown, which compare the monthly averages of H2O VCD provided by our instruments, it is obvious that the periods of minimum and maximum are in phase, but the amplitude of these minimum and maximum differ. For this reason we have used this difference as a criterion for the next study.
15
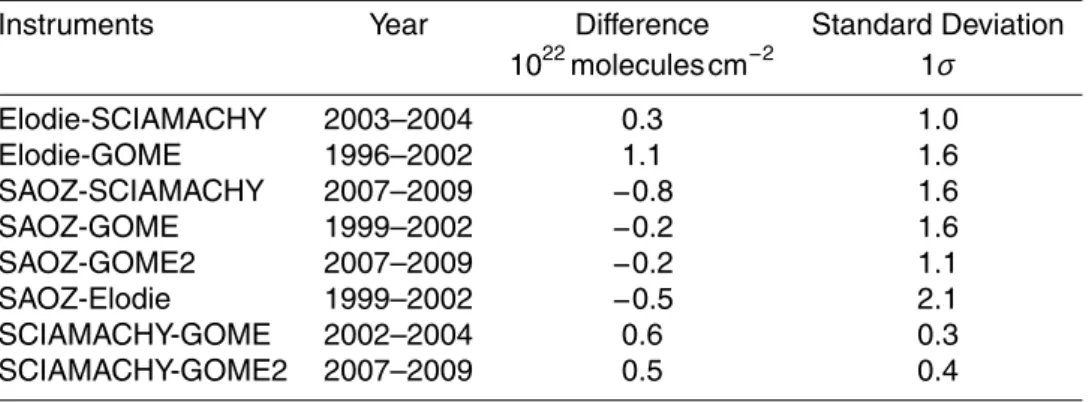
The following table shows an estimate of the mean difference that may exist between the various measures of our instruments at OHP. To compute the difference between the measurements from both instruments, data have been selected during periods that do not exhibit any technical or data processing issues.
The quantification in Table 3 shows that the differences between the
measure-20
ments of the three instruments oscillates between 0.45 × 10²²molecules cm−2 and 2.1 × 10²²molecules cm−2 where the difference between Elodie and SAOZ is the highest, the difference between GOME and Elodie is higher than those amongst SAOZ/GOME and SAOZ/GOME2. Note that 1 × 10²²molecules cm−2 corresponds to 20 % of the average value. However, the difference between SCIAMACHY and Elodie is
25
AMTD
6, 4249–4277, 2013Water vapour at OHP S. Alkasm et al. Title Page Abstract Introduction Conclusions References Tables Figures J I J I Back Close
Full Screen / Esc
Printer-friendly Version Interactive Discussion Discussion P a per | Dis cussion P a per | Discussion P a per | Discussio n P a per |
between satellite measurements themselves are not very large and less than those already shown.
5 Interpretation
5.1 Interpretation of the difference between the various measures of water vapour total column at the OHP
5
After quantifying the average difference between the measurements, the origin of these differences have been investigated. To reach this objective, we have analysed the effect of time of measurement and of the geometry of the observation.
5.2 Period of measurements
Table 4 presents the time of measurements for each instrument in summer and in
win-10
ter. According to this table we can see that there is a significant discrepancy between the time of measurements of ground-based instruments and the overpass times of the satellites above OHP, but also between the measurements of ground-based instru-ments themselves. The difference is negligible between satellites themselves.
How can these gaps in time contribute to the difference between their
measure-15
ments?
To answer this question, we looked at the diurnal cycle of H2O VCD above OHP provided by OPERA. The OPERA data are derived from operational analysis from 2002 to 2011 by the ECMWF (European Center for Medium Range Weather Forecast). These measurements were obtained every 6 h from January 2002 to April 2011.
20
Figure 5 shows the daily variations of H2O VCD above OHP by OPERA 1–6 January. According to the evolution of these variations, we cannot see any systematic diurnal periodicity, as the hour corresponding to the minimum or to the maximum varies from one day to another. For example, on 1 January the maximum is observed at 18 h and
AMTD
6, 4249–4277, 2013Water vapour at OHP S. Alkasm et al. Title Page Abstract Introduction Conclusions References Tables Figures J I J I Back Close
Full Screen / Esc
Printer-friendly Version Interactive Discussion Discussion P a per | Dis cussion P a per | Discussion P a per | Discussio n P a per |
the minimum at 12 h and on 6 January the maximum is observed at 00 and the mini-mum at 18 h.
However, the amplitude of these variations oscillates between 0.3 and 1.6 × 10²²molecules cm−2, and thus by averaging over several days, this difference can be of the order of 1 × 10²²molecules cm−2. The same study is done on the diurnal cycle
5
in summer, where we found the same amplitude for the difference. Also, the diurnal cycles of water vapour can be caused by the influence of large-scale synoptic flows. These flows have a strong impact on the content of moisture in the lower part of the troposphere after the examination of the effect of these flows on the diurnal cycle of total column water vapour over Marseille (a city in the south of France near to the OHP)
10
by looking at the vertical profiles of water vapour and winds measured over this city. Finally we can say, in the case of instruments which measure the total column vapour at OHP at different times differences in the value of water vapour can be obtained on average of the order of 1 approximately.
An alternative approach has been made during the recent DEMEVAP (Development
15
of Methodologies for Water Vapour Measurement, Octobre 2011 at OHP) inter com-parison campaign with lidars, GPS and radiosondes, showing a relatively good agree-ment between all instruagree-ments (for example 3 % between GPS and selected UV-visible spectrometers; Bock et al. (2013)). This approach was possible only because GPS in-struments measure every 5 min, i.e. with a much better temporal resolution than other
20
instruments.
5.3 Geometry of the observation
We know that the daily variation of the total column vapour is different from one region to another. For example, Bastin et al. (2007) examined in their article the diurnal cycle of total column water vapour over two GPS stations (one located in the centre of Marseille
25
at an altitude of 131 m, and one north of the latter at an altitude of 314 m during the period from 21 to 26 June 2001), where they found non-regular differences between them for this period. These differences are mainly due to the location of the two stations
AMTD
6, 4249–4277, 2013Water vapour at OHP S. Alkasm et al. Title Page Abstract Introduction Conclusions References Tables Figures J I J I Back Close
Full Screen / Esc
Printer-friendly Version Interactive Discussion Discussion P a per | Dis cussion P a per | Discussion P a per | Discussio n P a per |
where the topography is different. However in our case, our instruments do not measure the water vapour in the same location because their modes of viewing are different.
Figure 6 shows the different path of sight for the instruments of this study where we can see that Elodie and SAOZ do not observe the water vapour at the same location: Elodie observes above the OHP as the stars are often observed toward the south by
5
60◦of elevation, and the impact point of the line of sight is just located a few kilometres (less than 10 km) of the instrument.
For the SAOZ, however, which looks at the solar radiation scattered at the zenith at the sunset and sunrise, the line of sight across the troposphere is tangential to the surface of the earth and the impact point is located around 180 km for a 10
km-10
thick atmosphere, and at 50 km for a 2 km-thick atmosphere. H2O being a tropospheric constituent, its impact point for the SAOZ line-of-sight is in between these values.
For the satellites, Fig. 1 presents the location of the footprint of the measurement zones considered for each of the three satellites. We notice that the rectangles of GOME and GOME2 are located more on land, but the rectangle of SCIAMACHY is
15
divided between the land and the sea, with the greater part being over the sea. In Fig. 6 the red rectangle contains the combination of these three areas.
To highlight the effect of the different observation modes of our instruments on their measurements we propose the following method (see Fig. 6):
– determine the zone that contains all the locations of the measurements of our 20
instruments that are between 3–5◦in longitude and 40–48◦in latitude;
– divide this zone into 35 sub-zones, 19 zones above the OHP and 16 zones below
the OHP;
– we can see that most of the sub-zones above the OHP are located rather on the
land, but the ones below are rather on the sea;
25
– retrieve the measurements of the total column water vapour corresponding to
each of these zones of global measures of GOME, which are available over the period from 1995 to 2004;
AMTD
6, 4249–4277, 2013Water vapour at OHP S. Alkasm et al. Title Page Abstract Introduction Conclusions References Tables Figures J I J I Back Close
Full Screen / Esc
Printer-friendly Version Interactive Discussion Discussion P a per | Dis cussion P a per | Discussion P a per | Discussio n P a per |
– as the difference between the measurements of our instruments appears more
clearly between the summer or winter most of the time (maximum and minimum values respectively), we have selected only the measurements of total column water vapour corresponding to these two seasons for each sub-area;
– these selected measurements are averaged over ten years; 5
– calculate the distance in km of each OHP sub-zone;
– present the averages over the ten years calculated for the summer and the winter
of each sub-zone as a function of the distance of these sub-zones from OHP. The result of this method is presented in the Fig. 7, which shows the gradient in the total column amount of water vapour according to the latitude around OHP, as the
10
red points represent the summer measurements for each sub-area, and the blue ones those of winter.
This figure shows that the amount of total column water vapour decreases from south to north. The rate of the decline is stronger in summer than in winter, and the variability of the measurements between the sub-zones is more remarkable in summer than in
15
winter, but also over the zones of the north than those of the south of OHP.
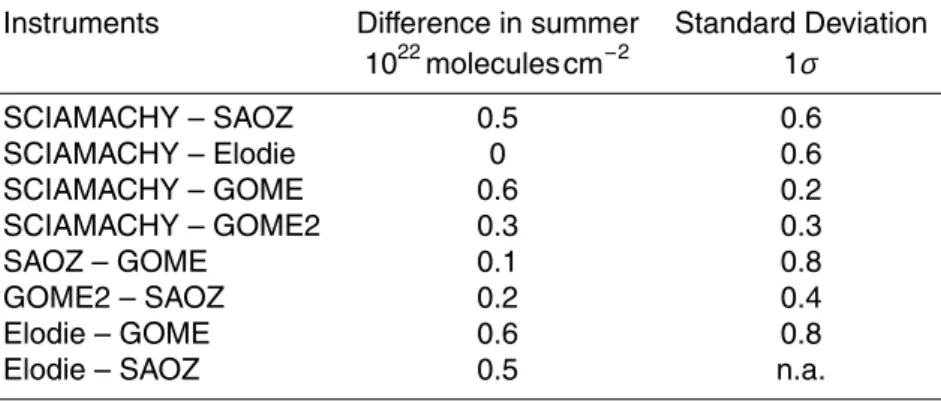
In another way, we can say that in summer the total column water vapour over the sea is systematically higher than over the land, where the difference between the southern and the northern boundaries presented in Fig. 7 is 1.8 × 10²²molecules cm−2. In con-trast, in winter the difference is less remarkable between the two boundaries and equal
20
to 0.3 × 10²²molecules cm−2.
In Fig. 7 we have also determined the position of the measurements for each in-strument used in this study, which allows us to determine the order of magnitude of the differences arising from the variation of mode of observation between these instru-ments. Results are presented in Table 5.
AMTD
6, 4249–4277, 2013Water vapour at OHP S. Alkasm et al. Title Page Abstract Introduction Conclusions References Tables Figures J I J I Back Close
Full Screen / Esc
Printer-friendly Version Interactive Discussion Discussion P a per | Dis cussion P a per | Discussion P a per | Discussio n P a per |
5.4 Interpretation and quantification
Based on the study performed in Sect. 5, the source of the bias can be explained (Table 4). The differences between the measurements between the different satellites correspond to the difference of the selected area of measurements chosen, as the overestimation of VCD measured by SCIAMACHY is due to geographical area covered
5
that often include a significant portion of the sea, while those for GOME and GOME2 cover mainly the land.
However, the difference between Elodie and SCIAMACHY is due only to the differ-ence in their measurement times. In contrast, the discordance in measurement times and in geometry of observation between GOME and Elodie contributes together to the
10
observed differences in the estimation of VCD. This is also the case for SAOZ/satellites and SAOZ/Elodie.
6 Conclusions
In this work we have analysed and compared H2O VCD above OHP obtained by various instruments including ground-based instruments and satellites ones. A good
15
agreement is found between all these measurements over OHP. However, differences in the estimation of the maximum and minimum values appear between these di ffer-ent data sets, where the magnitude of differences varies according to the both instru-ments, as the differences between the satellite data sets is smaller than those observed between the satellites and the ground-based measurements, as well as between the
20
ground-based measurements themselves. After the analyses of the diurnal variations of atmospheric water vapour over OHP and the variability of the VCD with latitude around OHP, we have shown that the differences observed between our instruments are due to the differences in their mode of observations and in their time of measure-ments. In another way, these instruments do not observe the water vapour in the same
25
AMTD
6, 4249–4277, 2013Water vapour at OHP S. Alkasm et al. Title Page Abstract Introduction Conclusions References Tables Figures J I J I Back Close
Full Screen / Esc
Printer-friendly Version Interactive Discussion Discussion P a per | Dis cussion P a per | Discussion P a per | Discussio n P a per |
We found that these two reasons contribute to the mean difference between SAOZ/Elodie, SAOZ/satellites and GOME/Elodie, but the difference detected between the measurements of the satellites are mainly due by the difference of their geographic domain chosen. Also, the mean difference between Elodie and SCIAMACHY measure-ments are caused by the differences in their measurement times.
5
This study allows us to draw several conclusions about the comparisons of the total column water vapour in the region of OHP:
– The diurnal variations of total column water vapour above OHP is not systematic
and varies from day to day and also from one season to another.
– In summer and in winter the amount of total column water vapour over the sea is 10
systematically higher than over the land, indicating that the level of difference is also higher in summer than in winter.
– Variations of the total column water vapour with latitude is more important in
sum-mer. In contrast, the amplitude of these variations is very low in winter.
– This data analysis shows that the values of the total column water vapour over 15
OHP, in summer and winter seems to exhibit a transition zone that separate the amount of water vapour in two levels: the first level south of OHP is characterised by higher values less variable with latitude, and the second level north of OHP is characterised by lower values more variable with latitude. The variations be-tween these two domains is stronger during summer. This difference can be due
20
to land/sea differences or can also be caused by air drying during the passage over the mountains as well as the effect of altitude in the presence of mountain (not low layer).
Future works will consist in studying climatological variability of atmospheric water vapour above Mediterranean locations with satellite thanks to this validation study using
25
AMTD
6, 4249–4277, 2013Water vapour at OHP S. Alkasm et al. Title Page Abstract Introduction Conclusions References Tables Figures J I J I Back Close
Full Screen / Esc
Printer-friendly Version Interactive Discussion Discussion P a per | Dis cussion P a per | Discussion P a per | Discussio n P a per |
Acknowledgements. Thanks to IPSL for funding this study. Special thanks to CNES, ESA, NASA, Observatoire de Haute Provence, and related laboratories for providing the data. Thanks to Bremen University for providing GOME and SCIAMACHY data.
The publication of this article is financed by CNRS-INSU. 5
References
Bastin, S., Champollion, C., Bock, O., Drobinski, P., and Masson, P.: Diurnal cycle of water vapor as documented by a dense gps network in a coastal area during escompte iop2, J. Appl. Meteorol. Clim., 46, 167–182, 2007. 4250, 4259
Bock, O., Bosser, P., Bourcy, T., David, L., Goutail, F., Hoareau, C., Keckhut, P., Legain, D., 10
Pazmino, A., Pelon, J., Pipis, K., Poujol, G., Sarkissian, A., Thom, C., Tournois, G., and Tzanos, D.: Accuracy assessment of water vapour measurements from in-situ and remote sensing techniques during the DEMEVAP 2011 campaign at OHP, Atmos. Meas. Tech. Dis-cuss., 6, 3439–3509, doi:10.5194/amtd-6-3439-2013, 2013. 4259
Durry, G. and Megie, G.: Atmospheric CH4 and H2O monitoring with near-infrared InGaAs 15
laser diodes by SDLA, a balloonborne spectrometer for tropospheric and stratospheric in situ measurements, Appl. Optics, 38, 7342–7354, 1999. 4251
Elliott, W. P. and Gaffen, D. J.: On the utility of radiosonde humidity archives for climate studies, B. Am. Meteorol. Soc., 72, 1507–1520, 1991. 4250
Hoareau, C., Keckhut, P., Sarkissian, A., Baray, J.-L., and Durry, G.: Methodology for water 20
monitoring in upper troposphere with Raman lidar at observatory of Haute-Provence, J. At-mos. Ocean. Tech., 26, 2149–2160, doi:10.1175/2009JTECHA1287.1, 2009. 4251, 4253 Mieruch, S., No ¨el, S., Bovensmann, H., and Burrows, J. P.: Analysis of global water vapour
trends from satellite measurements in the visible spectral range, Atmos. Chem. Phys., 8, 491–504, doi:10.5194/acp-8-491-2008, 2008. 4256
AMTD
6, 4249–4277, 2013Water vapour at OHP S. Alkasm et al. Title Page Abstract Introduction Conclusions References Tables Figures J I J I Back Close
Full Screen / Esc
Printer-friendly Version Interactive Discussion Discussion P a per | Dis cussion P a per | Discussion P a per | Discussio n P a per |
No ¨el, S., Buchwitz, M., Bovensmann, H., Hoogen, R., and Burrows, J. P.: Atmospheric water vapor amounts retrieved from GOME satellite data, Geophys. Res. Lett., 26, 1841–1844, 1999. 4254
No ¨el, S., Buchwitz, M., and Burrows, J. P.: First retrieval of global water vapour column amounts from SCIAMACHY measurements, Atmos. Chem. Phys., 4, 111–125, doi:10.5194/acp-4-5
111-2004, 2004. 4253
Pommereau, J.-P and Goutail, F.: O3and NO2 ground-based measurements by visible spec-trometry during Arctic winter and Spring 1988, Geophys. Res. Lett., 15, 891–894, 1988. 4252
Ramanathan, V.: The greenhouse theory of climate change: a test by an inadvertent global 10
experiment, Science, 299, 240–293, 1988. 4250
Sarkissian, A. and Slusser, J.: Water vapour total column measurements using the Elodie Archive at Observatoire de Haute Provence from 1994 to 2004, Atmos. Meas. Tech., 2, 319–326, doi:10.5194/amt-2-319-2009, 2009. 4251, 4253
Scheiben, D., Straub, C., Hocke, K., Forkman, P., and Kampfer, N.: Observations of middle 15
atmospheric H2O and O3during the 2010 major sudden stratospheric warming by a network of microwave radiometers, Atmos. Chem. Phys., 12, 7753–7765, doi:10.5194/acp-12-7753-2012, 2012. 4251
Soden, B. J. and Lanzante, J. R.: An assessment of satellite and radiosonde climatologies of upper-tropospheric water vapor, J. Climate, 9, 1235–1250, 1996. 4251
20
Wagner, T., Andreae, M. O., Beirle, S., D ¨orner, S., Mies, K., and Shaiganfar, R.: MAX-DOAS observations of the total atmospheric water vapour column and comparison with independent observation, Atmos. Meas. Tech., 6, 131–149, doi:10.5194/amt-6-131-2013, 2013. 4251 Yunck, T. P., Liu, C.-H., and Ware, R.: A history of gps sounding, Terr. Atmos. Ocean. Sci., 11,
1–20, 2000. 4250 25
AMTD
6, 4249–4277, 2013Water vapour at OHP S. Alkasm et al. Title Page Abstract Introduction Conclusions References Tables Figures J I J I Back Close
Full Screen / Esc
Printer-friendly Version Interactive Discussion Discussion P a per | Dis cussion P a per | Discussion P a per | Discussio n P a per |
Table 1. Selection of tests conducted for the size of the quadrangle around OHP.
Satellite Latitude Longitude Correlation Year
◦ N ◦E GOME2 42–44 5–7 0.92 2008 GOME2 42–44 5–10 0.91 2008 GOME2 43–44 5–6 0.91 2008 GOME2 43–45 5–7 0.93 2008 GOME2 43–46 5–8 0.92 2008 GOME2 43–47 5–9 0.77 2008 GOME 42–44 5–7 0.82 1996 GOME 42–44 5–10 0.83 1996 GOME 43–44 5–6 0.77 1996 GOME 43–45 5–7 0.83 1996 GOME 43–46 5–8 0.85 1996 GOME 43–47 5–9 0.85 1996 GOME 43–48 5–10 0.88 1996 SCIAMACHY 42–44 5–7 0.95 2007 SCIAMACHY 42–44 5–10 0.94 2007 SCIAMACHY 43–44 5–6 0.96 2007 SCIAMACHY 43–45 5–7 0.96 2007 SCIAMACHY 43–46 5–8 0.95 2007 SCIAMACHY 43–47 5–9 0.94 2007 SCIAMACHY 43–48 5–10 0.94 2007 SCIAMACHY 40–45 3–8 0.97 2007 SCIAMACHY 42–48 4–10 0.95 2007
AMTD
6, 4249–4277, 2013Water vapour at OHP S. Alkasm et al. Title Page Abstract Introduction Conclusions References Tables Figures J I J I Back Close
Full Screen / Esc
Printer-friendly Version Interactive Discussion Discussion P a per | Dis cussion P a per | Discussion P a per | Discussio n P a per |
Table 2. Temporal coverage of the datasets of water vapour measurements obtained by the instruments.
Instruments Temporal coverage
Elodie July 1994–November 2004
SAOZ June 1992–now
SCIAMACHY July 2002–now
GOME June 1995–December 2004
AMTD
6, 4249–4277, 2013Water vapour at OHP S. Alkasm et al. Title Page Abstract Introduction Conclusions References Tables Figures J I J I Back Close
Full Screen / Esc
Printer-friendly Version Interactive Discussion Discussion P a per | Dis cussion P a per | Discussion P a per | Discussio n P a per |
Table 3. Quantification of differences between water vapour measurements obtained by our instruments.
Instruments Year Difference Standard Deviation
1022molecules cm−2 1σ Elodie-SCIAMACHY 2003–2004 0.3 1.0 Elodie-GOME 1996–2002 1.1 1.6 SAOZ-SCIAMACHY 2007–2009 −0.8 1.6 SAOZ-GOME 1999–2002 −0.2 1.6 SAOZ-GOME2 2007–2009 −0.2 1.1 SAOZ-Elodie 1999–2002 −0.5 2.1 SCIAMACHY-GOME 2002–2004 0.6 0.3 SCIAMACHY-GOME2 2007–2009 0.5 0.4
AMTD
6, 4249–4277, 2013Water vapour at OHP S. Alkasm et al. Title Page Abstract Introduction Conclusions References Tables Figures J I J I Back Close
Full Screen / Esc
Printer-friendly Version Interactive Discussion Discussion P a per | Dis cussion P a per | Discussion P a per | Discussio n P a per |
Table 4. Observation time of our instruments.
Instrument Time of measurement Time of measurement
in winter at OHP in summer at OHP
SCIAMACHY between 10:30 and 11:50 between 11:30 and 12:50
GOME between 11:00 and 12:15 between 12:00 and 13:15
GOME2 between 09:45 and 11:40 between 10:45 and 12:40
SAOZ Morning: between 07:00 and 08:00 Morning: between 06:00 and 07:00
Evening: between 16:00 and 18:00 Evening: between 20:00 and 21:00
AMTD
6, 4249–4277, 2013Water vapour at OHP S. Alkasm et al. Title Page Abstract Introduction Conclusions References Tables Figures J I J I Back Close
Full Screen / Esc
Printer-friendly Version Interactive Discussion Discussion P a per | Dis cussion P a per | Discussion P a per | Discussio n P a per |
Table 5. Order of magnitude of differences arising from the variation of mode of observation between our instruments.
Instruments Difference in summer Standard Deviation
1022molecules cm−2 1σ SCIAMACHY – SAOZ 0.5 0.6 SCIAMACHY – Elodie 0 0.6 SCIAMACHY – GOME 0.6 0.2 SCIAMACHY – GOME2 0.3 0.3 SAOZ – GOME 0.1 0.8 GOME2 – SAOZ 0.2 0.4 Elodie – GOME 0.6 0.8
AMTD
6, 4249–4277, 2013Water vapour at OHP S. Alkasm et al. Title Page Abstract Introduction Conclusions References Tables Figures J I J I Back Close
Full Screen / Esc
Printer-friendly Version Interactive Discussion Discussion P a per | Dis cussion P a per | Discussion P a per | Discussio n P a per |
Fig. 1. The dimensions of the quadrangles used to extract measurements of the total column water vapour above OHP from the global measurements of our satellites.
AMTD
6, 4249–4277, 2013Water vapour at OHP S. Alkasm et al. Title Page Abstract Introduction Conclusions References Tables Figures J I J I Back Close
Full Screen / Esc
Printer-friendly Version Interactive Discussion Discussion P a per | Dis cussion P a per | Discussion P a per | Discussio n P a per |
Fig. 2. Comparison of monthly averages of H2O at OHP measured by Elodie and SAOZ from 1995 to 2004.
AMTD
6, 4249–4277, 2013Water vapour at OHP S. Alkasm et al. Title Page Abstract Introduction Conclusions References Tables Figures J I J I Back Close
Full Screen / Esc
Printer-friendly Version Interactive Discussion Discussion P a per | Dis cussion P a per | Discussion P a per | Discussio n P a per |
Fig. 3. Comparison of the monthly average of H2O obtained by SCIAMACHY, GOME and GOME2
above OHP.
21
Fig. 3. Comparison of the monthly average of H2O obtained by SCIAMACHY, GOME and
AMTD
6, 4249–4277, 2013Water vapour at OHP S. Alkasm et al. Title Page Abstract Introduction Conclusions References Tables Figures J I J I Back Close
Full Screen / Esc
Printer-friendly Version Interactive Discussion Discussion P a per | Dis cussion P a per | Discussion P a per | Discussio n P a per |
Fig. 4. Comparison of monthly average of H2O obtained by ground-based SAOZ, Elodie and satellites GOME, SCIAMACHY above OHP.
AMTD
6, 4249–4277, 2013Water vapour at OHP S. Alkasm et al. Title Page Abstract Introduction Conclusions References Tables Figures J I J I Back Close
Full Screen / Esc
Printer-friendly Version Interactive Discussion Discussion P a per | Dis cussion P a per | Discussion P a per | Discussio n P a per |
Fig. 5. Daily variations of the total column water vapour obtained over OHP from 1–6 January 2004 by OPERA.
AMTD
6, 4249–4277, 2013Water vapour at OHP S. Alkasm et al. Title Page Abstract Introduction Conclusions References Tables Figures J I J I Back Close
Full Screen / Esc
Printer-friendly Version Interactive Discussion Discussion P a per | Dis cussion P a per | Discussion P a per | Discussio n P a per |
Fig. 6. Direction of the impact point of the line-of-sight of the different instruments of this study. The numbers 1, 2, 3 and 4 present the line-of-sight of the SAOZ oriented toward the sun at sunrise or at sunset, which correspond to the azimuth 55, 123, 236, and 305◦, respectively. 1: morning, summer; 2: morning, winter; 3: evening, winter; 4: evening, summer. The little blue arrow oriented towards the south presents the direction of Elodie line-of-sight.
AMTD
6, 4249–4277, 2013Water vapour at OHP S. Alkasm et al. Title Page Abstract Introduction Conclusions References Tables Figures J I J I Back Close
Full Screen / Esc
Printer-friendly Version Interactive Discussion Discussion P a per | Dis cussion P a per | Discussion P a per | Discussio n P a per |