HAL Id: hal-00997874
https://hal.archives-ouvertes.fr/hal-00997874
Submitted on 10 Apr 2015
HAL is a multi-disciplinary open access
archive for the deposit and dissemination of
sci-entific research documents, whether they are
pub-lished or not. The documents may come from
teaching and research institutions in France or
abroad, or from public or private research centers.
L’archive ouverte pluridisciplinaire HAL, est
destinée au dépôt et à la diffusion de documents
scientifiques de niveau recherche, publiés ou non,
émanant des établissements d’enseignement et de
recherche français ou étrangers, des laboratoires
publics ou privés.
Mediterranean region using the thermal infrared
IASI/MetOp sounder and the WRF-Chem model
Sarah Safieddine, Anne Boynard, P.-F. Coheur, D. Hurtmans, G. Pfister,
Boris Quennehen, Jennie L. Thomas, Jean-Christophe Raut, Kathy S. Law, Z.
Klimont, et al.
To cite this version:
Sarah Safieddine, Anne Boynard, P.-F. Coheur, D. Hurtmans, G. Pfister, et al.. Summertime
tro-pospheric ozone assessment over the Mediterranean region using the thermal infrared IASI/MetOp
sounder and the WRF-Chem model. Atmospheric Chemistry and Physics, European Geosciences
Union, 2014, 14, pp.10119-10131. �10.5194/acp-14-10119-2014�. �hal-00997874�
www.atmos-chem-phys.net/14/10119/2014/ doi:10.5194/acp-14-10119-2014
© Author(s) 2014. CC Attribution 3.0 License.
Summertime tropospheric ozone assessment over the
Mediterranean region using the thermal infrared IASI/MetOp
sounder and the WRF-Chem model
S. Safieddine1, A. Boynard1, P.-F. Coheur2, D. Hurtmans2, G. Pfister3, B. Quennehen1, J. L. Thomas1, J.-C. Raut1, K. S. Law1, Z. Klimont4, J. Hadji-Lazaro1, M. George1, and C. Clerbaux1,2
1Sorbonne Universités, UPMC Univ. Paris 06; Université Versailles St-Quentin; CNRS/INSU, LATMOS-IPSL, Paris, France 2Spectroscopie de l’Atmosphère, Chimie Quantique et Photophysique, Université Libre de Bruxelles (U.L.B.),
Brussels, Belgium
3Atmospheric Chemistry Division, National Center for Atmospheric Research, Boulder, Colorado, USA 4International Institute for Applied Systems Analysis, Laxenburg 2361, Austria
Correspondence to: S. Safieddine ([email protected])
Received: 7 March 2014 – Published in Atmos. Chem. Phys. Discuss.: 14 May 2014 Revised: 7 August 2014 – Accepted: 23 August 2014 – Published: 23 September 2014
Abstract. Over the Mediterranean region, elevated
tropo-spheric ozone (O3) values are recorded, especially in
sum-mer. We use the thermal Infrared Atmospheric Sounding In-terferometer (IASI) and the Weather Research and Forecast-ing Model with Chemistry (WRF-Chem) to understand and interpret the factors and emission sources responsible for the high O3 concentrations observed in the Mediterranean
tro-posphere. Six years (2008–2013) of IASI data have been analyzed and results show consistent maxima during sum-mer, with an increase of up to 22 % in the [0–8] km O3
col-umn in the eastern part of the basin compared to the mid-dle of the basin. We focus on summer 2010 to investigate the processes that contribute to these summer maxima. Us-ing two modeled O3tracers (inflow to the model domain and
local anthropogenic emissions), we show that, between the surface and 2 km, O3is mostly formed from anthropogenic
emissions, while above 4 km it is mostly transported from outside the domain or from stratospheric origins. Evidence of stratosphere-to-troposphere exchange (STE) events in the eastern part of the basin is shown, and corresponds to a low water vapor mixing ratio and high potential vorticity.
1 Introduction
Tropospheric ozone (O3) is a greenhouse gas, air
pollu-tant, and a primary source of the hydroxyl radical (OH), the most important oxidant in the atmosphere (Chameides and Walker, 1973; Crutzen, 1973). Previous observations and studies have shown that tropospheric O3 over the
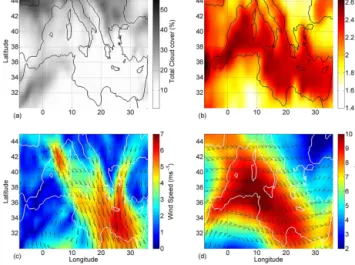
Mediter-ranean exhibits a significant increase during summertime, especially in the east of the basin (Kouvarakis et al., 2000; Im et al., 2011; Gerasopoulos et al., 2005, 2006a; Richards et al., 2013; Zanis et al., 2014). Meteorological conditions such as frequent clear-sky conditions (Fig. 1a) and high ex-posure to solar radiation (Fig. 1b) in summer enhance the formation of photochemical O3due to the availability of its
precursors. These precursors include carbon monoxide (CO), peroxyl radicals generated by the photochemical oxidation of volatile organic compounds (VOCs) and nitrogen oxides (NOx=NO + NO2). Locally, the eastern part of the basin
is surrounded by megacities such as Cairo, Istanbul, and Athens that are large sources of local anthropogenic emis-sions. The geographic location of the basin makes it a re-ceptor for anthropogenic pollution from Europe both in the boundary layer (Fig. 1c) and the mid-troposphere (Fig. 1d). The threshold O3value for air quality standards for the
Euro-pean Union (of daily maximum of running 8 h mean values of 60 ppbv) is exceeded on more than 25 days per year at a large number of stations across Europe, many of which are
located to the south of Europe in the Mediterranean Basin (EEA, 2012). The dynamical processes of the summer cir-culation over the Mediterranean were previously attributed to the Hadley cell considered as the driver of the major sub-tropical dry zones. Rodwell and Hoskins (1996) argued that, during the June–August period, the zonal mean Hadley cir-culation has very little motion and cannot explain the dry season of North Africa and the Mediterranean. Rodwell and Hoskins (1996, 2001) suggested, through numerical simula-tions, that the Asian monsoon heating induces an equatorially trapped Rossby wave to its west that interacts with the mid-latitude westerlies, producing a region of adiabatic descent and triggering subsidence. Long-term analysis of dP / dt (unit: Pa s−1, used to represent subsidence) indeed shows a positive enhancement over the Mediterranean region (Ziv et al., 2004), making the South Asian monsoon a fundamental driver of the summer circulation over the eastern Mediter-ranean (Tyrlis et al., 2013). High O3values in the
Mediter-ranean troposphere in the literature are attributed to differ-ent sources. Lelieveld et al. (2002) showed that, in the up-per troposphere, Asian pollution is transported from the east by the monsoon across the Mediterranean tropopause into the lower stratosphere. Liu et al. (2011) showed with long-term model analysis that the dominant sources of O3in the
Middle East (including the Mediterranean) are the transport from Asia and local production. On the other hand, Gera-sopoulos et al. (2005) have shown that the mechanism that controls surface O3seasonal variability in the eastern basin
during summer is mainly the transport from Europe. Using lidar measurements, Galani et al. (2003) detected an increase of 10 % of tropospheric O3 between 4.5 and 6.5 km due to
stratosphere-to-troposphere exchange (STE) events. Zbinden et al. (2013), using aircraft data from the MOZAIC (Mea-surements of OZone and water vapour by in-service AIr-bus airCraft) program over 15 years (1994–2009), showed that the tropospheric O3columns in the east of the
Mediter-ranean reached a maximum of 43.2 DU (Dobson units) dur-ing June–July. This recorded maximum exceeds the maxi-mum recorded for Beijing for the same period, for exam-ple. Model calculation using WRF-Chem (Weather Research and Forecasting model coupled with Chemistry) and EMEP (European Monitoring and Evaluation Programme) MSC-W (Meteorological Synthesizing Centre – West) models of the eastern Mediterranean during heat waves in 2007 showed that the daily maximum near-surface O3is mostly sensitive
to anthropogenic emissions of O3precursors (Hodnebrog et
al., 2012). Im et al. (2011) found that the near-surface ozone mixing ratios increase almost linearly with temperature by 1.0±0.1 ppb O3per kelvin. STE processes can affect the
tro-pospheric O3budget and impact air quality if transported to
the boundary layer (Fiore et al., 2002). Stratospheric intru-sions have been detected in the Mediterranean region, espe-cially on the eastern side (Galani et al., 2003; Zanis et al., 2014), because it lies to the south of the Northern Hemi-sphere polar jet flowing over midlatitudes (Stohl et al., 2000;
Figure 1. An example of the ECMWF (European Centre for
Medium-Range Weather Forecasts) Reanalysis (ERA-Interim) for the period June-July-August (JJA) 2010 for (a) total cloud coverage,
(b) 12:00 UTC solar radiation reaching the surface, (c) wind speed
and direction averaged from the surface to 750 hPa, and (d) wind speed and direction averaged from 750 to 400 hPa.
Gerasopoulos et al., 2001). Understanding the factors that contribute to the O3maxima is important for developing
con-trol measures and preventing pollution buildup. In this study we analyze O3 and its sources at different altitudes in the
Mediterranean troposphere. Section 2 introduces the model and observations data sets used in this study. In Sect. 3, we analyze 6 years (2008–2013) of Infrared Atmospheric Sounding Interferometer (IASI) tropospheric [0–8] km O3
column seasonal variation above the whole Mediterranean Basin as well as at 15 and 30◦E, representative of what we henceforth refer to as “middle of the basin” and “east of the basin” respectively. In Sect. 4 we focus on summer 2010, as an example year, and validate the WRF-Chem model simu-lation with surface O3and IASI data, and then use the
WRF-Chem model to assess the sources of O3in the troposphere.
In Sect. 5, we use IASI and WRF-Chem free-tropospheric O3data to investigate potential STE events. Discussion and
conclusions are given in Sect. 6.
2 Model and observational data 2.1 WRF-Chem model
In this study, we use the regional chemistry transport model WRF-Chem, version 3.2 (Grell et al., 2005), to assess the budget and spatiotemporal variability of O3over the
Mediter-ranean during summer 2010. The model domain shown in Fig. 2a is over Europe and the Mediterranean Basin, the latter being the focus of this study (Fig. 2b). The horizon-tal resolution is of 50 km × 50 km and the vertical reso-lution is of 28 levels between the surface and 10 hPa. The
Figure 2. (a) The enlarged WRF-Chem model run domain. (b) IASI
and WRF-Chem domain used in this study. White dots correspond to the location of the EMEP ground stations and the orange strips correspond to the longitudinal transects used in Figs. 5 and 10.
meteorological initial and boundary conditions are based on the National Centers for Environmental Prediction (NCEP) Final (FNL) analyses with analysis nudging for wind, tem-perature, and humidity applied. Fields are provided every 6 h with 1◦horizontal resolution and 27 vertical levels from the surface up to 10 hPa. The chemical initial and bound-ary conditions, spatially and temporally vbound-arying (6 h), are constrained by global chemical transport simulations from MOZART-4/GEOS-5 with 1.9◦×2.5◦horizontal resolution (Emmons et al., 2010a). The WRF-Chem gas-phase chemical mechanism is that from Model for Ozone and Related Chem-ical Tracers, version 4 (MOZART-4) (Emmons et al., 2010a), which is coupled to the aerosol scheme Goddard Chemistry Aerosol Radiation and Transport (GOCART) model (Chin et al., 2002). The model also includes anthropogenic and fire emissions that are calculated offline. The anthropogenic emissions used within the WRF-Chem model were devel-oped within the context of the ECLIPSE European project using the Greenhouse gas and Air pollution Interactions and Synergies (GAINS) model. In addition to the ECLIPSE V4.0 anthropogenic emissions, ship emissions from the RCP 6.0 scenario (Fujino et al., 2006; Hijioka et al., 2008) were used. Biomass burning emissions are obtained from the Fire In-ventory from NCAR (FINN V1) (Wiedinmyer et al., 2011). Biogenic emissions are calculated online from the Model of Emissions of Gases and Aerosols from Nature (MEGAN) (Guenther et al., 2006). The WRF-Chem simulation outputs are saved every 2 h from 1 June until 31 August 2010.
In this study, we use a tagging method for O3 (Emmons
et al., 2012), which has been applied in global models for diagnosing contributions for individual sources to O3 (e.g.,
Lamarque et al., 2005; Pfister et al., 2006, 2008; Emmons et al., 2010b; Wespes et al., 2012), as well as in other global and regional chemical transport models (Ma et al., 2002; Hess and Zbinden, 2013). Recently, this scheme was used for the
first time in the WRF-Chem model to quantify the contri-bution of transport on surface O3over California (Pfister et
al., 2013). Here, we apply this scheme to keep track of the contribution of O3 within the WRF-Chem domain. To
de-termine O3sources, tagged NOx is traced through the odd
nitrogen species (e.g., PAN, HNO3, organic nitrates) to
ac-count for NOxrecycling (Emmons et al., 2012). Two separate
tracer runs were conducted with the same emissions and ini-tial and boundary conditions. In the first one, the O3-ANTHRO
tracer accounts for the anthropogenic regional tagged NOx,
while the second one, the O3-INFLOW tracer, accounts for
tagged O3as well as all nitrogen species at the lateral
bound-aries of the regional model domain. The O3-INFLOW tracer
includes O3 and O3 precursors from all natural (including
lightning and stratospheric O3) and anthropogenic sources
outside the regional modeling domain. Within the regional modeling domain, O3-INFLOWundergoes transport and
chem-ical processes but is not produced from sources other than from reactions including the tagged species. Since the strato-spheric O3is controlled by the lateral boundaries in this
ver-sion of WRF-Chem, O3from stratospheric intrusions within
the regional domain would be labeled as O3-INFLOWas well.
More details about the tagging scheme are provided in Em-mons et al. (2012). Two more tracers are available to com-plete the O3budget: O3from biogenic sources and O3from
fires. Given that their contribution to the total budget in com-parison with the O3-INFLOWand O3-ANTHRO tracers is small
(< 10 %), they are analyzed together in this study as “resid-uals” to the total budget and their contribution is defined as 100 % − (O3-ANTHRO% + O3-INFLOW%). We focus our
anal-ysis on summer 2010, which corresponds to the year of the anthropogenic emission inventory used in the model. Dur-ing July–August 2010, a heat wave occurred in Russia that caused severe fires with high O3and O3precursor emissions
that were probably transported to the Mediterranean region; this will be further investigated in this study.
2.2 EMEP data
The EMEP (European Monitoring and Evaluation Pro-gramme) O3hourly data (http://ebas.nilu.no/) are used to
val-idate the WRF-Chem model at the surface. All ozone mea-surements within EMEP are done with UV monitors. In this study, measurements at eight ground rural background sites during the summer of 2010 are used. Details on the EMEP observation system can be found in Hjellbrekke et al. (2012). The geographic locations of the eight stations used for vali-dation are plotted in Fig. 2, and the corresponding details are listed in Table 1. Two more station data sets were available, GR01-Aliartos (38.37◦N, 23.11◦E) and IT01-Montelibretti (42.1◦N, 12.63◦E), for the same period. We disregarded the data from these stations because they show a strong diurnal variation of 80–90 ppbv amplitude and recurrent near-zero O3 concentrations throughout the period of the study, and
Table 1. List of geographic location of the EMEP O3monitoring ground stations used in this study, with the corresponding altitude above mean sea level.
Code Station name Latitude (◦N) Longitude (◦E) Altitude (m) CY02 Ayia Marina 35.04 33.06 532
ES06 Mahón 39.87 4.32 78
ES07 Víznar 37.30 −3.53 1265
ES10 Cabo de Creus 42.32 3.32 23
ES12 Zarra 39.08 −1.10 885
ES14 Els Torms 41.39 0.73 470
GR02 Finokalia 35.31 25.66 250
MK07 Lazaropole 41.32 20.42 1332
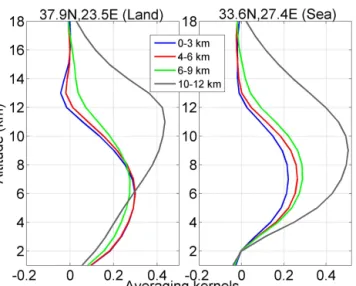
Figure 3. Random O3averaging kernels over the Mediterranean:
the functions are for the [surface–3], [4–6], [6–9], and [10–12] km partial columns characterizing a retrieval for an observation chosen randomly above land (Greece, left panel) and above the sea (right panel) during June 2010.
2.3 IASI satellite measurements
The MetOp satellites, launched in October 2006 and Septem-ber 2012, each carry an IASI instrument, which have been operationally sounding the atmosphere since June 2007 (IASI-1) and January 2013 (IASI-2). The IASI instruments are nadir-looking Fourier transform spectrometers that probe the Earth’s atmosphere in the thermal infrared spectral range between 645 and 2760 cm−1, with a spectral resolution
of 0.5 cm−1 (apodized) and 0.25 cm−1 spectral sampling.
Global distributions of O3 vertical profiles are retrieved in
near-real time using a dedicated radiative transfer and re-trieval software for the IASI O3 product, the Fast Optimal
Retrievals on Layers for IASI (FORLI-O3) (Hurtmans et
al., 2012). The IASI FORLI-O3 observations are selected
for scenes with cloud coverage below 13 % and with root mean square (rms) of the spectral fit residual lower than 3.5×10⁻⁸W cm−2sr cm−1. Details about the chemical
com-ponents that can be measured by IASI can be found in Clerbaux et al. (2009), Coheur et al. (2009), Turquety et al. (2009), and Clarisse et al. (2011). IASI has the highest O3sensitivity in the mid- to upper troposphere (Safieddine et
al., 2013). Figure 3 shows the partial column averaging ker-nel function for two specific observations above land and sea during June 2010. It can be seen that the sensitivity to the O3profile is maximal around 4–10 km for both observations.
IASI sensitivity near the surface is usually limited above the sea, as seen on the right panel of Fig. 3, and better over land, as seen in the left panel, and with corresponding better ther-mal contrast (7.8◦above land, and 1.2◦ above sea). IASI is able to detect several pollutants (e.g., carbon monoxide, am-monia, sulfur dioxide, and ammonium sulfate aerosols), es-pecially when a large thermal contrast is combined with sta-ble meteorological conditions, leading to the accumulation of pollutants near the surface (Boynard et al., 2014).
3 Tropospheric O3seasonal variation as seen by IASI
To investigate the seasonal behavior of tropospheric O3
above the Mediterranean, in Fig. 4 we plot the [0–8] km par-tial tropospheric O3column as seen by IASI during the
pe-riod of 2008 to 2013. The data were averaged seasonally, and daytime observations were used since the information con-tent of IASI O3 data is shown to be higher during the day
(Clerbaux et al., 2009). We observe a similar tropospheric O3seasonal behavior each year. The weakest values are
ob-served in winter (DJF) and autumn (SON), when solar activ-ity is minimal. Increasing values in spring (MAM) are due to the increase in O3production from photochemistry, buildup
of winter O3and its precursors, transport, and/or from O3of
stratospheric origin integrating into the troposphere. The [0– 8] km column reaches a maximum in summer (JJA) due to high photochemical O3production, horizontal transport into
the region, or STE, all of which will be investigated in de-tail in the following sections. Richards et al. (2013) detected a similar spatial distribution with the Global Ozone Moni-toring Experiment-2 (GOME-2) during the summers of 2007 and 2008, with values exceeding 32 DU at the east of the
Figure 4. Six-year seasonal variation of [0–8] km integrated IASI O3column over the Mediterranean region for winter, spring, summer, and
autumn. White pixels correspond to a filter applied to poor spectral fits because of emissivity issues in the FORLI radiative transfer above the Sahara.
Figure 5. Six-year monthly variation of the integrated [0–8] km
IASI O3column averaged over [30–45◦N] at 15◦E (in black) and
30◦E (in red). Higher summer values are observed to the east of the basin at 30◦E.
basin for the [0–6] km O3column. To further investigate the
higher values detected to the east of the basin, we analyze longitudinal transects of 1◦width along 15◦E (representing the middle of the basin) and 30◦E (representing the east of the basin), marked in orange in Fig. 2.
Figure 5 shows that, during the period of 2008 to 2013, the summers in the east of the basin, notably at 30◦E (plot-ted in red), are marked by eleva(plot-ted tropospheric [0–8] km O3
values. The difference between the two O3columns at the
2 different longitudes was highest (4.7 DU − 22 %) during June 2012. The highest recorded values were up to 30 DU in July 2010 at 30◦E. This period coincides with the 2010 Russian heat wave (Schubert et al., 2011), which caused se-vere fires with high O3precursors emissions (R’Honi et al.,
2013). Further discussion is provided in Sect. 4.2
4 O3budget from the WRF-Chem model during
summer 2010
From this section onwards, we focus our analysis on summer 2010, the year of the anthropogenic emission inventory used in the model. We evaluate the model then we discuss the O3
budget at different altitude levels in the Mediterranean tropo-sphere.
4.1 Model evaluation: comparison to EMEP and IASI
The model is evaluated by comparing O3concentrations with
ground O3data from the EMEP stations (Sect. 2.2) and then
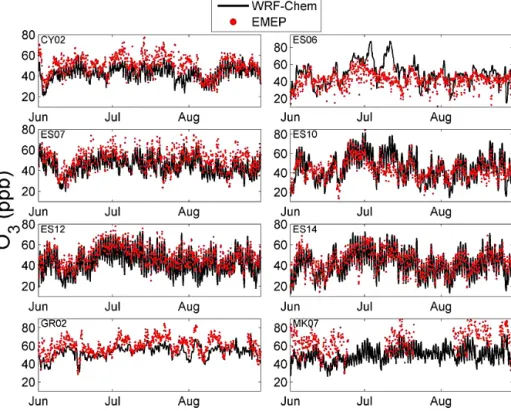
Figure 6. O3time series of EMEP and WRF-Chem data at the surface for the stations localized in Fig. 2 for the period JJA 2010.
4.1.1 Comparison to EMEP surface monitoring stations
Linear spatial interpolation was applied to WRF-Chem data in order to correlate the model outputs and the EMEP data that were averaged every 2 h to coincide with the model run output data. Figure 6 shows the individual time series of the data of the eight stations used for the validation. Table 2 shows the individual O3correlation and bias between
WRF-Chem and the EMEP for each of the stations used in this study during JJA 2010. The model simulates the surface O3
with a correlation ranging from 0.41 (ES06) to 0.80 (ES12) and a mean value of 0.52. Figure 6 and Table 2 show that the model reasonably well reproduces the average amplitude of the daily cycle seen in the observation. For all stations except ES06 and ES10, the model underestimates the ground obser-vation during the summer period with a mean relative error between −23.9 and −6.4 %. The biases reported may be due to the resolution of the model resulting in a grid of around 50 km around the EMEP rural sites that may include other surface O3contributions. Other possible reasons include
dif-ficulties in simulating local flow patterns due to topography and land–sea circulation, as well as uncertainties in emis-sions and NOxconcentrations (Pfister et al., 2013). Our
re-sults compare well with the study by Tuccella et al. (2012), which compared WRF-Chem to 75 EMEP stations over Eu-rope during 2007 and found that hourly O3exhibits a
correla-tion with observacorrela-tions ranging from 0.38 to 0.83. The largest discrepancy observed, with modeled O3 values larger than
Table 2. Pearson correlation coefficient, bias and the corresponding
mean relative error (MRE) of each EMEP and WRF-Chem ground station data localized in Fig. 2, for the period JJA 2010.
Station name Corr. coeff. with Bias MRE WRF-Chem (ppbv) (%) CY02 0.63 7.78 −14.2 ES06 0.41 +7.26 +20.9 ES07 0.77 −7.24 −13.4 ES10 0.72 +1.43 +3.6 ES12 0.80 −5.96 −12.7 ES14 0.78 −2.99 −6.4 GR02 0.62 −7.38 −11.3 MK07 0.57 −16.65 −23.9
80 ppbv, is for the station ES06-Mahon (39.87◦N, 4.32◦E), which might be due a particular uncertainty in the model emissions or dry deposition over this area.
4.1.2 Comparison to IASI observations
Averaged data for summer 2010 are used for the compari-son of WRF-Chem and IASI O3[4–10] km free-tropospheric
column. The modeled profile is first linearly interpolated to the time and location of the retrieval. Then, the averaging kernels associated with each IASI measurement and its a pri-ori profile are applied to the interpolated modeled profile (of around seven layers between 4 and 10 km). Figure 7 shows
Figure 7. Average [4–10] km O3column for JJA 2010 from IASI and WRF-Chem and their relative difference (%). White pixels correspond to a filter applied to poor spectral fits above the Sahara.
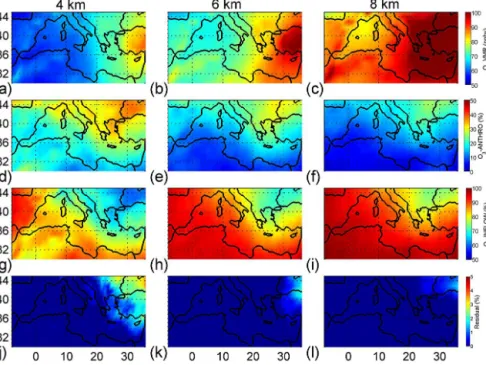
Figure 8. WRF-Chem spatial distributions of (a–c) O3mixing ratios (ppbv), (d–f) O3anthropogenic tracer relative contributions (%), (g–i)
O3inflow tracer relative contribution, and (j–l) the residual (100 % − (O3-ANTHRO% + O3-INFLOW%)) averaged over the period JJA 2010
at the surface and 1 and 2 km. Note that the color bar for the residual plots is different.
the spatial distribution of the [4–10] km integrated IASI and WRF-Chem model O3 column along with the relative
dif-ferences. We chose to analyze this part of the atmosphere in particular because IASI has a better sensitivity between 4 and 10 km over both land and water as shown in Fig. 3. The model reproduces the spatial patterns seen by IASI dur-ing summer (JJA) 2010 well, with a correlation coefficient of about 0.93 and a summertime mean bias of 6.1 DU (25 %) (not shown). The model underestimation of the [4–10] km O3column might due to the difficulties in resolving the high
O3concentrations observed in transported plumes over large
distances (Pfister et al., 2013). On the other hand, the high discrepancies seen over northern Africa might be due to poor spectral fits from IASI above surfaces with sharp emissiv-ity variations, particularly above the desert (Hurtmans et al.,
2012), leading to a possible overestimation of the real profile. We analyzed the IASI total retrieval error for the [4–10] km partial column (not shown here) and found that it is on av-erage around 7 % in the model domain, and between 7 and 12 % where the discrepancies between the model and IASI are the highest.
4.2 Origins of boundary layer O3over the
Mediterranean
Modeled O3 concentrations are illustrated in Fig. 8a–c at
the surface and 1 and 2 km during JJA 2010. At the surface, modeled O3exhibits the highest values downwind from the
European continent. At 1 and 2 km the whole eastern part of the basin is characterized by high O3 mixing ratios. In
Figure 9. Same as Fig. 8 but for 4, 6, and 8 km.
order to investigate possible sources of high O3, we run the
model with two different tracers of pollution, O3-ANTHROand
O3-INFLOW, as described in Sect. 2.1. O3-ANTHRO (Fig. 8d–
f) assesses the possible anthropogenic contribution of O3at
different altitudes, while O3-INFLOW(Fig. 8g–i) provides an
estimate of transport of O3, including the stratosphere. The
residual plots plotted in panels j–l show the completion of the O3budget, and represent the O3contribution from fires and
biogenic sources. These plots show that the residual contri-bution is between 0 and 10 %, inferring that O3-ANTHROand
O3-INFLOW combined are responsible for 90 to 100 % of the
total O3 budget over the model domain at the different
alti-tudes of Fig. 8. The surface shows a high contribution from the anthropogenic emission tracer (O3-ANTHRO> 85 %), with
almost zero contribution from the inflow tracer. This shows the importance of local emissions to the O3 surface
con-centration. At 1 km, the highest contribution is also for the anthropogenic tracer (up to 75–80 %), whereas the result is mixed at 2 km between the two tracers (around 50–60 % for O3-ANTHROand 40–50 % for O3-INFLOW), suggesting that up
to 50 % of the O3available at 2 km is being transported. The
rest of the O3plotted in the residual plots (panels j–l) and
decreasing with altitude is suggested to be from fire sources, as the extended domain (Fig. 2a) used in the study includes parts of the region hit by the Russian fires of summer 2010.
4.3 Origins of free-tropospheric O3over the
Mediterranean
O3 concentrations at 4, 6, and 8 km in Fig. 9a–c show that
the eastern part of the basin is subject to much higher O3
values, reaching up to 100 ppbv between 6 and 8 km (see fur-ther discussion in Sect. 5). The anthropogenic contribution decreases with altitude, whereas the O3 inflow contribution
increases. The northeastern corner of the modeled domain in panels d–f show anthropogenic contribution between 20 and 40 %. This might be due to important vertical transport and mixing in the free troposphere. These values can be cor-related with the O3residuals plotted in panels j–l. These
pan-els show an O3 signature in the north eastern corner of the
domain. This signature is probably related to the emitted O3
precursors from fires sources in the model domain (Fig. 2) and lifted to the upper troposphere due to convective move-ments during the Russian fires of summer 2010. We can also suppose that certain anthropogenic O3precursors, like NOx,
near the fire sources were also transported with the same con-vective movements to the same part of the domain and even-tually contributed to the production of anthropogenic O3in
that region. Panels g–i show that 70 to 100 % of the available O3 between 4 and 8 km does not come from local sources.
The high values are likely due to long-range transport of pol-lution from outside the study region or transport of air masses from the stratosphere, which we will discuss in the following section. The low values recorded in the residual plots in pan-els j–l show that the O3budget in the free troposphere over
this region is controlled almost exclusively by local anthro-pogenic sources and transport.
5 WRF-Chem and IASI detection of STE events
Figures 4 and 5 and Fig. 9a–c showed that the eastern part of the Mediterranean Basin in summer is subject to high O3
mixing ratios at 4, 6, and 8 km. In order to further investi-gate the sources and processes responsible for these enhance-ments, modeled and observed IASI O3vertical profiles in the
troposphere were examined, during summer 2010, to try to detect possible STE events.
Figure 10 shows the tropospheric O3 vertical
distribu-tions along 15◦E (mid-Mediterranean) and 30◦E (eastern Mediterranean) for IASI (panels a and b) and WRF-Chem, smoothed with the IASI averaging kernels (panels c and d) for JJA 2010. Between 4 and 8 km, panels b and d show higher values of O3in the eastern part of the basin (30◦E),
with concentrations ranging between 50 and 100 ppbv for IASI and 40 to 100 ppbv for WRF-Chem (WRF-Chem underestimates IASI as shown in Fig. 7).
Since stratospheric intrusions within the regional domain are included in the O3-INFLOW tracer, it is useful to use
other stratospheric tracers to distinguish the transport from the stratosphere. The potential vorticity (PV) and the wa-ter vapor mixing ratio (Qvap) measurements can be used
as markers of transport from the upper troposphere–lower stratosphere (UTLS) to the troposphere: elevated O3and PV,
as well as low Qvap values, would indicate that high
free-tropospheric values are due to downward transport from the UTLS (Holton et al., 1995). Here, we study PV and Qvapat
4, 6, 8, and 10 km calculated from the WRF-Chem model run parameters. Figure 11 shows that, starting at 4 km, higher PV and lower Qvapvalues start to develop to the east of the basin.
At 8 and 10 km, the highest PV values (1.5 to 2 potential vor-ticity units (pvu); 1 pvu = 10−6m2K kg−1s−1)and the
low-est Qvap values (0–0.10 g kg−1) are recorded to the east of
the basin, in comparison with low PV values in the middle of and to the west of the basin (0.5–1) with high Qvapvalues
(0.1–0.15). The high PV/low Qvap values to the east are in
accordance with Figs. 9 and 10, strongly suggesting that this part of the basin is subject to transport from the UTLS into the free troposphere. In fact, at 30◦E and around 37–39◦N (panels b and d of Fig. 10), both IASI and the model suggest a stratospheric intrusion. This intrusion corresponds to PV values between 1.4 and 2 pvu at 8 km and Qvapvalues around
0.05 g kg−1. In a recent study, Zanis et al. (2014), using a 12-year climatology (1998–2009) of the ERA-interim reanaly-sis, also detected frequent events of STE with PV ranging be-tween 0.4 and 1.4 pvu and specific humidity values bebe-tween 0.01 and 2 g kg−1between 700 and 250 hPa during July and
August to the east of the basin, in accordance with our results for summer 2010 at 4, 6, and 8 km.
Figure 10. Mean latitude–altitude cross sections of IASI O3(a– b) and modeled O3(c–d) averaged over JJA 2010 at 15◦E (left)
and 30◦E (right). The black line corresponds to the dynamical tropopause height.
6 Discussion and conclusions
Six years of tropospheric O3 observations provided by the
IASI mission above the Mediterranean are shown. Tropo-spheric [0–8] km O3columns show a consistent seasonal
be-havior over the period 2008–2013, with pronounced maxima in summer and with higher values to the east of the basin. A complementary study by Doche et al. (2014) using IASI data at 3 km height also showed 6-year recurrent O3summer
max-ima in July to the east of the basin. Since IASI has a lower sensitivity in the lower troposphere and above the sea, the an-thropogenic emission contribution to the boundary layer O3
is not well captured by the instrument. However, IASI is able to detect high tropospheric O3values in the free to upper
tro-posphere, where its sensitivity is the highest, to the east of the basin during the 6 years. Focusing on summer 2010, we use IASI and the regional chemical transport model WRF-Chem to interpret these maxima. A tagging scheme is used to keep track of O3from anthropogenic sources in the domain
(O3-ANTHRO)and O3from inflow at the domain boundaries
and stratosphere (O3-INFLOW). Our results show that
trans-port plays an essential role in the O3budget over the
Mediter-ranean troposphere and that summer O3maxima over the
re-gion are especially recorded in the eastern part of the basin. Even though high local anthropogenic emissions are respon-sible for 60–100 % of O3 in the boundary layer (surface–
2 km), as demonstrated by the anthropogenic O3 tracer of
the WRF-Chem model, O3is mainly transported above 2 km.
Kalabokas et al. (2007, 2013) showed that the highest ozone concentrations in the lower troposphere are associated with large-scale subsidence of ozone-rich air masses from the up-per troposphere. However, Zanis et al. (2014), using model simulations, reported that long-distance transport and local
Figure 11. WRF-Chem (a) potential vorticity (PV) at 4, 6, 8, and 10 km over the Mediterranean region for JJA 2010 and (b) the water vapor
mixing ratio (Qvap) for the same vertical levels and time period.
photochemical processes dominate at the low troposphere.In this study and in the free troposphere, WRF-Chem shows that vertical and lateral transport of O3 (represented by the
O3-INFLOWtracer) is responsible for 70–100 % of O3at 4, 6,
and 8 km. In the eastern Mediterranean, Roelofs et al. (2003) showed important contributions to elevated O3 in the
mid-dle troposphere by transport from the stratosphere. More re-cently, Hess and Zbinden (2013) showed that stratospheric interannual O3variability significantly drives the O3
variabil-ity in the middle troposphere between 30 and 90◦N, but not the overall trend, which is largely affected by transport pro-cesses. The increase in O3seen by the model and the IASI
in-strument in the eastern part of the Mediterranean Basin sug-gests that stratosphere-to-troposphere exchange (STE) events contribute to elevated ozone in the upper free troposphere. This is further shown in the WRF-Chem simulations that pre-dict elevated potential vorticity (PV) and water vapor mixing ratio (Qvap) over the same region. This result is in
agree-ment with many previous studies (e.g., Butkovic et al., 1990; Kalabokas and Bartzis, 1998; Kalabokas et al., 2000, 2007; Kouvarakis et al., 2000; Lelieveld et al., 2002; Sprenger and Wernli, 2003; Papayannis et al., 2005; Gerasopoulos et al., 2006b; Akritidis et al., 2010; Zanis et al., 2014; Doche et al., 2014) that have shown the occurrence of STE events in the eastern Mediterranean region in summer. Since O3
max-ima have the potential to strongly impact regional air qual-ity and climate (e.g., Hauglustaine and Brasseur, 2001), the present study further demonstrates the importance of quanti-fying and analyzing O3and its sources at different altitudes
in the atmosphere. Quantification of long-term trends and distinguishing between the different sources are crucial. This
should be possible with observations and model runs over longer timescales with additional tracers to identify all O3
sources.
Acknowledgements. IASI is a joint mission of EUMETSAT and
the Centre National d’Etudes Spatiales (CNES, France). The IASI L1 data are distributed in near-real time by EUMETSAT through the EumetCast distribution system. The authors ac-knowledge the French Ether atmospheric database administrators (www.pole-ether.fr) for providing the IASI L1C data and L2 temperature data. This work was undertaken under the auspices of the O3M-SAF project of the EUMETSAT and supported by the European Space Agency (ozone CCI project). The French scientists are grateful to CNES and Centre National de la Recherche Scien-tifique (CNRS) for financial support. The research in Belgium is funded by the Belgian State Federal Office for Scientific, Technical and Cultural Affairs and the European Space Agency (ESA Prodex arrangement). P. F. Coheur is a senior research associate with F.R.S-FNRS. Support is also acknowledged from the EU FP7 ECLIPSE (Evaluating the Climate and Air Quality Impacts of Short-Lived Pollutants) project (no. 282688).
References
Akritidis, D., Zanis, P., Pytharoulis, I., Mavrakis, A., and Kara-costas, T.: A deep stratospheric intrusion event down to the earth’s surface of the megacity of Athens, Meteorol. Atmos. Phys., 109, 9–18, doi:10.1007/s00703-010-0096-6, 2010. Boynard, A., Clerbaux, C., Clarisse, L., Safieddine, S., Pommier M.,
Van Damme, M., Bauduin, S., Oudot, C., Hadji-Lazaro, J., Hurt-mans, D., and Coheur, P.-F.: First simultaneous space measure-ments of atmospheric pollutants in the boundary layer from IASI: a case study in the North China Plain, Geophys. Res. Lett., 41, 645–651 doi:10.1002/2013GL058333, 2014.
Butkovic, V., Cvitas, T., and Klasinc, L.: Photochemical ozone in the Mediterranean, Sci. Total Environ., 99, 145–151, doi:10.1016/0048-9697(90)90219-k, 1990.
Chameides, W. and Walker, J. C. G.: A photochemical theory of tropospheric ozone, J. Geophys. Res., 78, 8751–8760, 1973. Chin, M., Ginoux, P., Kinne, S., Torres, O., Holben, B. N., Duncan,
B. N., Martin, R. V., Logan, J. A., Higurashi, A., and Nakajima, T.: Tropospheric aerosol optical thickness from the GOCART model and comparisons with satellite and Sun photometer mea-surements, J. Atmos. Sci., 59, 461–483, 2002.
Clarisse, L., R’Honi, Y., Coheur, P.-F., Hurtmans, D., and Clerbaux, C.: Thermal infrared nadir observations of 24 atmospheric gases, Geophys. Res. Lett., 38, L10802, doi:10.1029/2011GL047271, 2011.
Clerbaux, C., Boynard, A., Clarisse, L., George, M., Hadji-Lazaro, J., Herbin, H., Hurtmans, D., Pommier, M., Razavi, A., Turquety, S., Wespes, C., and Coheur, P.-F.: Monitoring of atmospheric composition using the thermal infrared IASI/MetOp sounder, At-mos. Chem. Phys., 9, 6041–6054, doi:10.5194/acp-9-6041-2009, 2009.
Coheur, P.-F., Clarisse, L., Turquety, S., Hurtmans, D., and Cler-baux, C.: IASI measurements of reactive trace species in biomass burning plumes, Atmos. Chem. Phys., 9, 5655–5667, doi:10.5194/acp-9-5655-2009, 2009.
Crutzen, P. J.: A discussion of the chemistry of some minor con-stituents in the stratosphere and troposphere, Pure Appl. Geo-phys., 106–108, 1385, 1973.
Doche, C., Dufour, G., Foret, G., Eremenko, M., Cuesta, J., Beekmann, M., and Kalabokas, P.: Summertime tropo-spheric ozone variability over the Mediterranean basin observed with IASI, Atmos. Chem. Phys. Discuss., 14, 13021–13058, doi:10.5194/acpd-14-13021-2014, 2014.
EEA: Air Quality in Europe – 2012 Report, European Environment Agency, ISBN:978-92-9213-328-3, Luxembourg, Office for Of-ficial Publications of the European Union, doi:10.2800/55823, 2012.
Emmons, L. K., Walters, S., Hess, P. G., Lamarque, J.-F., Pfister, G. G., Fillmore, D., Granier, C., Guenther, A., Kinnison, D., Laepple, T., Orlando, J., Tie, X., Tyndall, G., Wiedinmyer, C., Baughcum, S. L., and Kloster, S.: Description and evaluation of the Model for Ozone and Related chemical Tracers, version 4 (MOZART-4), Geosci. Model Dev., 3, 43–67, doi:10.5194/gmd-3-43-2010, 2010a.
Emmons, L. K., Apel, E. C., Lamarque, J.-F., Hess, P. G., Avery, M., Blake, D., Brune, W., Campos, T., Crawford, J., DeCarlo, P. F., Hall, S., Heikes, B., Holloway, J., Jimenez, J. L., Knapp, D. J., Kok, G., Mena-Carrasco, M., Olson, J., O’Sullivan, D., Sachse, G., Walega, J., Weibring, P., Weinheimer, A., and Wiedinmyer,
C.: Impact of Mexico City emissions on regional air quality from MOZART-4 simulations, Atmos. Chem. Phys., 10, 6195–6212, doi:10.5194/acp-10-6195-2010, 2010b.
Emmons, L. K., Hess, P. G., Lamarque, J.-F., and Pfister, G. G.: Tagged ozone mechanism for MOZART-4, CAM-chem and other chemical transport models, Geosci. Model Dev., 5, 1531– 1542, doi:10.5194/gmd-5-1531-2012, 2012.
Fiore, A. M., Jacob, D. J., Bey, I., Yantosca, R. M., Field, B. D., Fusco, A. C., and Wilkinson, J. G.: Background ozone over the United States in summer: Origin, trend, and con-tribution to pollution episodes, J. Geophys. Res., 107, 4275, doi:10.1029/2001JD000982, 2002.
Fujino, J., Nair, R., Kainuma, M., Masui, T., and Matsuoka, Y.: Multi-gas mitigation analysis on stabilization scenarios using AIM global model, multigas mitigation and climate policy, En-erg. J., 27, 343–353, 2006.
Galani, E., Balis, D., Zanis, P., Zerefos, C., Papayannis, A., Wernli, H., and Gerasopoulos, E.: Observations of stratosphere-troposphere transport events over the eastern Mediterranean using a ground-based lidar system, J. Geophys. Res., 108, D128527, doi:10.1029/2002JD002596, 2003.
Gerasopoulos, E., Zanis, P., Stohl, A., Zerefos, C. S., Papastefanou, C., Ringer,W., Tobler, L., Huebener, S., Kanter, H. J., Tositti, L., and Sandrini, S.: A climatology of 7Be at four high-altitude sta-tions at the Alps and the Northern Apennines, Atmos. Environ., 35, 6347–6360, 2001.
Gerasopoulos, E., Kouvarakis, G., Vrekoussis, M., Kanakidou, M., Mihalopoulos, N.: Ozone variability in the marine boundary layer of the Eastern Mediterranean based on 7-year observations, J. Geophys. Res., 110, D15309, doi:10.1029/2005JD005991, 2005.
Gerasopoulos, E., Kouvarakis, G., Vrekoussis, M., Donoussis, C., Mihalopoulos, N., and Kanakidou, M.: Photochemical ozone production in the Eastern Mediterranean, Atmos. Environ., 40, 3057–3069, 2006a.
Gerasopoulos, E., Zanis, P., Papastefanou, C., Zerefos, C. S., Ioan-nidou, A., and Wernli, H.: A complex case study of down to the surface intrusions of persistent stratospheric air over the Eastern Mediterranean, Atmos. Environ., 40, 4113–4125, 2006b. Grell, G. A., Peckham, S. E., Schmitz, R., McKeen, S. A., Frost, G.,
Skamarock, W. C., and Eder, B.: Fully coupled “online” chem-istry within the WRF model, Atmos. Environ., 39, 6957–6975, 2005.
Guenther, A., Karl, T., Harley, P., Wiedinmyer, C., Palmer, P. I., and Geron, C.: Estimates of global terrestrial isoprene emissions using MEGAN (Model of Emissions of Gases and Aerosols from Nature), Atmos. Chem. Phys., 6, 3181–3210, doi:10.5194/acp-6-3181-2006, 2006.
Hess, P. G. and Zbinden, R.: Stratospheric impact on tropospheric ozone variability and trends: 1990–2009, Atmos. Chem. Phys., 13, 649–674, doi:10.5194/acp-13-649-2013, 2013.
Hijioka, Y., Matsuoka, Y., Nishimoto, H., Matsui, M., and Kanuma, M.: Global GHG emissions scenarios under GHG concentration stabilization targets, Journal of Global Environmental Engineer-ing, 13, 97–108, 2008.
Hjellbrekke, A., Solberg, S., and Fjæraa, A. M.: Ozone mea-surements 2010 EMEP/CCC-Report 2/2012, available at: http: //www.nilu.no/projects/ccc/reports/cccr2-2012.pdf (last access: 13 May 2014), 2012.
Hodnebrog, Ø., Solberg, S., Stordal, F., Svendby, T. M., Simpson, D., Gauss, M., Hilboll, A., Pfister, G. G., Turquety, S., Richter, A., Burrows, J. P., and Denier van der Gon, H. A. C.: Impact of forest fires, biogenic emissions and high temperatures on the ele-vated Eastern Mediterranean ozone levels during the hot summer of 2007, Atmos. Chem. Phys., 12, 8727–8750, doi:10.5194/acp-12-8727-2012, 2012.
Hauglustaine, D. A. and Brasseur, G. P.: Evolution of tropospheric ozone under anthropogenic activities and associated radiative forcing of climate, J. Geophys. Res.-Atmos., 106, 32337–32360, doi:10.1029/2001jd900175, 2001.
Holton, J. R., Haynes, P. H., McIntyre, E. M., Douglass, A. R., Rood, R. B., and Pfister, L.: Stratosphere-troposphere exchange, Rev. Geophys., 33, 403–439, 1995.
Hurtmans, D., Coheur, P.-F., Wespes, C., Clarisse, L., Scharf, O., Clerbaux, C., Hadji-Lazaro, J., George, M., and Turquety, S.: FORLI radiative transfer and retrieval code for IASI, J. Quant. Spectrosc. Ra., 113, 1391–1408, 2012.
Im, U., Markakis, K., Poupkou, A., Melas, D., Unal, A., Gerasopou-los, E., Daskalakis, N., Kindap, T., and Kanakidou, M.: The im-pact of temperature changes on summer time ozone and its pre-cursors in the Eastern Mediterranean, Atmos. Chem. Phys., 11, 3847–3864, doi:10.5194/acp-11-3847-2011, 2011.
Kalabokas, P. D. and Bartzis, J. G.: Photochemical air pollution characteristics at the station of the NCSR-Demokritos, during the MEDCAPHOT-TRACE campaign in Athens, Greece (20 Au-gust to 20 September 1994), Atmos. Environ., 32, 2123–2139, doi:10.1016/s1352-2310(97)00423-8, 1998.
Kalabokas, P. D., Viras, L. G., Bartzis, J. G., and Repapis, C. C.: Mediterranean rural ozone characteristics around the urban area of Athens, Atmos. Environ., 34, 5199–5208, doi:10.1016/s1352-2310(00)00298-3, 2000.
Kalabokas, P. D., Volz-Thomas, A., Brioude, J., Thouret, V., Cam-mas, J.-P., and Repapis, C. C.: Vertical ozone measurements in the troposphere over the Eastern Mediterranean and compari-son with Central Europe, Atmos. Chem. Phys., 7, 3783–3790, doi:10.5194/acp-7-3783-2007, 2007.
Kalabokas, P. D., Cammas, J.-P., Thouret, V., Volz-Thomas, A., Boulanger, D., and Repapis, C. C.: Examination of the atmo-spheric conditions associated with high and low summer ozone levels in the lower troposphere over the eastern Mediterranean, Atmos. Chem. Phys., 13, 10339–10352, doi:10.5194/acp-13-10339-2013, 2013.
Kouvarakis, G., Tsigaridis, K., Kanakidou, M., and Mihalopoulos, N.: Temporal variations of surface regional background ozone over Crete Island in the southeast Mediterranean, J. Geophys. Res., 105, 4399–4407, 2000.
Lamarque, J.-F., Hess, P. G., Emmons, L., Buja, L., Wash-ington, W., and Granier, C.: Tropospheric ozone evolution between 1890 and 1990, J. Geophys. Res., 110, D08304, doi:10.1029/2004JD005537, 2005.
Lelieveld, J., Berresheim, H., Borrmann, S., Crutzen, P. J., Den-tener, F. J., Fischer, H., Feichter, J., Flatau, P. J., Heland, J., Holzinger, R., Korrmann, R., Lawrence, M. G., Levin, Z., Markowicz, K. M., Mihalopoulos, N., Minikin, A., Ramanathan, V., de Reus, M., Roelofs, G. J., Scheeren, H. A., Sciare, J., Schlager, H., Schultz, M., Siegmund, P., Steil, B., Stephanou, E. G., Stier, P., Traub, M.,Warneke, C.,Williams, J., and Ziereis, H.:
Global air pollution crossroads over the mediterranean, Science, 298, 794–799, doi:10.1126/science.1075457, 2002.
Liu, J., Jones, D. B. A., Zhang, S., and Kar, J.: Influence of in-terannual variations in transport on summertime abundances of ozone over the Middle East, J. Geophys. Res., 116, D20310, doi:10.1029/2011JD016188, 2011.
Ma, J., Zhou, X., and Hauglustaine, D.: Summertime tropospheric ozone over China simulated with a regional chemical transport model, Part 2. Source contribution and budget, J. Geophys. Res., 107, 4612, doi:10.1029/2001JD001355, 2002.
Papayannis, A., Balis, D., Zanis, P., Galani, E., Wernli, H., Zere-fos, C., Stohl, A., Eckhardt, S., and Amiridis, V.: Sampling of an STT event over the Eastern Mediterranean region by li-dar and electrochemical sonde, Ann. Geophys., 23, 2039–2050, doi:10.5194/angeo-23-2039-2005, 2005.
Pfister, G., Emmons, L. K., Hess, P. G., Honrath, R., Lamar-que, J.-F., Val Martin, M., Owen, R. C., Avery, M., Browell, E. V., Holloway, J. S., Nedelec, P., Purvis, R., Rywerson, T. B., Sachse, G. W., and Schlager, H.: Ozone production from the 2004 North American boreal fires, J. Geophys. Res., 111, D24S07, doi:10.1029/2006JD007695, 2006.
Pfister, G. G., Emmons, L. K., Hess, P. G., Lamarque, J.-F., Thompson, A. M., and Yorks, J. E.: Analysis of the sum-mer 2004 ozone budget over the United States using Inter-continental Transport Experiment Ozonesonde Network Study (IONS) observations and Model of Ozone and Related Trac-ers (MOZART-4) simulations, J. Geophys. Res., 113, D23306, doi:10.1029/2008JD010190, 2008.
Pfister, G. G., Walters, S., Emmons, L. K., Edwards, D. P., and Avise, J.: Quantifying the contribution of inflow on surface ozone over California during summer 2008, J. Geophys. Res. Atmos., 118, 12282–12299, doi:10.1002/2013JD020336, 2013.
R’Honi, Y., Clarisse, L., Clerbaux, C., Hurtmans, D., Duflot, V., Turquety, S., Ngadi, Y., and Coheur, P.-F.: Exceptional emis-sions of NH3and HCOOH in the 2010 Russian wildfires, At-mos. Chem. Phys., 13, 4171–4181, doi:10.5194/acp-13-4171-2013, 2013.
Richards, N. A. D., Arnold, S. R., Chipperfield, M. P., Miles, G., Rap, A., Siddans, R., Monks, S. A., and Hollaway, M. J.: The Mediterranean summertime ozone maximum: global emis-sion sensitivities and radiative impacts, Atmos. Chem. Phys., 13, 2331–2345, doi:10.5194/acp-13-2331-2013, 2013.
Rodwell, M. J. and Hoskins, B. J.: Monsoons and the dy-namics of deserts, Q. J. R. Meteorol. Soc., 122, 1385–1404, doi:10.1002/qj.49712253408, 1996.
Rodwell, M. J. and Hoskins, B. J.: Subtropical anticyclones and summer monsoons, J. Climate, 14, 3192–3211, 2001
Roelofs, G. J., Scheeren, H. A., Heland, J., Ziereis, H., and Lelieveld, J.: A model study of ozone in the eastern Mediter-ranean free troposphere during MINOS (August 2001), At-mos. Chem. Phys., 3, 1199–1210, doi:10.5194/acp-3-1199-2003, 2003.
Safieddine, S., Clerbaux, C., George, M., Hadji-Lazaro, J., Hurt-mans, D., Coheur, P.-F., Wespes, C., Loyola, D., Valks, P., and Hao, N.: Tropospheric ozone and nitrogen dioxide measurements in urban and rural regions as seen by IASI and GOME-2, J. Geo-phys. Res.-Atmos., 118, 10555–10566, 2013.
Schubert, S., Wang, H., and Suarez, M.: Warm season sub-seasonal variability and climate extremes in the Northern Hemisphere: the role of stationary Rossby waves, J. Climate, 24, 4773–4792, 2011.
Sprenger, M. and Wernli, H.: A northern hemispheric climatology of cross-tropopause exchange for the ERA15 time period (1979– 1993), J. Geophys. Res., 108, 8521, doi:10.1029/2002JD002636, 2003.
Stohl, A., Spichtinger-Rakowsky, N., Bonasoni, P., Feldmann, H., Memmesheimer, M., Scheel, H. E., Trickl, T., Hubener, S. H., Ringer, W., and Mandl, M.: The influence of stratospheric in-trusions on alpine ozone concentrations, Atmos. Environ., 34, 1323–1354, 2000.
Tuccella, P., Curci, G., Visconti, G., Bessagnet, B., Menut, L., and Park, R. J.: Modeling of gas and aerosol with WRF/Chem over Europe: Evaluation and sensitivity study, J. Geophys. Res., 117, D03303, doi:10.1029/2011JD016302, 2012.
Turquety, S., Hurtmans, D., Hadji-Lazaro, J., Coheur, P.-F., Cler-baux, C., Josset, D., and Tsamalis, C.: Tracking the emission and transport of pollution from wildfires using the IASI CO re-trievals: analysis of the summer 2007 Greek fires, Atmos. Chem. Phys., 9, 4897–4913, doi:10.5194/acp-9-4897-2009, 2009. Tyrlis, E., Lelieveld, J., and Steil, B.: The summer circulation
in the eastern Mediterranean and the Middle East: influence of the South Asian Monsoon, Clim. Dynam., 40, 1103–1123, doi:10.1007/s00382-012-1528-4, 2013.
Wespes, C., Emmons, L., Edwards, D. P., Hannigan, J., Hurtmans, D., Saunois, M., Coheur, P.-F., Clerbaux, C., Coffey, M. T., Batchelor, R. L., Lindenmaier, R., Strong, K., Weinheimer, A. J., Nowak, J. B., Ryerson, T. B., Crounse, J. D., and Wennberg, P. O.: Analysis of ozone and nitric acid in spring and summer Arc-tic pollution using aircraft, ground-based, satellite observations and MOZART-4 model: source attribution and partitioning, At-mos. Chem. Phys., 12, 237–259, doi:10.5194/acp-12-237-2012, 2012.
Wiedinmyer, C., Akagi, S. K., Yokelson, R. J., Emmons, L. K., Al-Saadi, J. A., Orlando, J. J., and Soja, A. J.: The Fire INventory from NCAR (FINN): a high resolution global model to estimate the emissions from open burning, Geosci. Model Dev., 4, 625– 641, doi:10.5194/gmd-4-625-2011, 2011.
Zanis, P., Hadjinicolaou, P., Pozzer, A., Tyrlis, E., Dafka, S., Mi-halopoulos, N., and Lelieveld, J.: Summertime free-tropospheric ozone pool over the eastern Mediterranean/Middle East, Atmos. Chem. Phys., 14, 115–132, doi:10.5194/acp-14-115-2014, 2014. Zbinden, R. M., Thouret, V., Ricaud, P., Carminati, F., Cammas, J.-P., and Nédélec, P.: Climatology of pure tropospheric profiles and column contents of ozone and carbon monoxide using MOZAIC in the mid-northern latitudes (24◦N to 50◦N) from 1994 to 2009, Atmos. Chem. Phys., 13, 12363–12388, doi:10.5194/acp-13-12363-2013, 2013.
Ziv, B., Saaroni, H., and Alpert, P.: The factors governing the sum-mer regime of the Eastern Mediterranean, Int. J. Climatol., 24, 1859–1871, 2004.

![Figure 5. Six-year monthly variation of the integrated [0–8] km IASI O 3 column averaged over [30–45 ◦ N] at 15 ◦ E (in black) and 30 ◦ E (in red)](https://thumb-eu.123doks.com/thumbv2/123doknet/14768567.589792/6.918.90.437.589.851/figure-monthly-variation-integrated-iasi-column-averaged-black.webp)
![Figure 7. Average [4–10] km O 3 column for JJA 2010 from IASI and WRF-Chem and their relative difference (%)](https://thumb-eu.123doks.com/thumbv2/123doknet/14768567.589792/8.918.163.754.112.270/figure-average-column-jja-iasi-chem-relative-difference.webp)