HAL Id: insu-01820363
https://hal-insu.archives-ouvertes.fr/insu-01820363
Submitted on 12 Sep 2020
HAL is a multi-disciplinary open access
archive for the deposit and dissemination of
sci-entific research documents, whether they are
pub-lished or not. The documents may come from
teaching and research institutions in France or
abroad, or from public or private research centers.
L’archive ouverte pluridisciplinaire HAL, est
destinée au dépôt et à la diffusion de documents
scientifiques de niveau recherche, publiés ou non,
émanant des établissements d’enseignement et de
recherche français ou étrangers, des laboratoires
publics ou privés.
chromatograph-mass spectrometer data sets: Reanalysis
of Viking mission data consistent with aromatic organic
compounds on Mars
Melissa Guzman, Christopher Mckay, Richard Quinn, Cyril Szopa, Alfonso
Davila, Rafael Navarro-Gonzalez, Caroline Freissinet
To cite this version:
Melissa Guzman, Christopher Mckay, Richard Quinn, Cyril Szopa, Alfonso Davila, et al.. Identification
of chlorobenzene in the Viking gas chromatograph-mass spectrometer data sets: Reanalysis of Viking
mission data consistent with aromatic organic compounds on Mars. Journal of Geophysical Research.
Planets, Wiley-Blackwell, 2018, 123 (7), pp.1674-1683. �10.1029/2018JE005544�. �insu-01820363�
Identi
fication of Chlorobenzene in the Viking Gas
Chromatograph-Mass Spectrometer Data Sets:
Reanalysis of Viking Mission Data Consistent
With Aromatic Organic Compounds on Mars
Melissa Guzman1 , Christopher P. McKay2 , Richard C. Quinn2, Cyril Szopa1,3, Alfonso F. Davila2 , Rafael Navarro-González4, and Caroline Freissinet1
1
ULATMOS/IPSL, UVSQ Université Paris-Saclay, UPMC Paris 06, CNRS, Guyancourt, France,2NASA Ames Research Center, Moffett Field, CA, USA,3Institut Universitaire de France, Paris, France,4Instituto de Ciencias Nucleares, Universidad Nacional
Autónoma de México, Ciudad de México, Mexico
Abstract
Motivated by the recent detection of chlorobenzene by the Sample Analysis at Mars instrument suite on the Curiosity rover, and the identification of its carbon source as indigenous to the martian sample, we reexamined the original, microfilm preserved, Viking gas chromatograph-mass spectrometer data sets. We found evidence for the presence of chlorobenzene in Viking Lander 2 (VL-2) data at levels corresponding to 0.08–1.0 ppb (relative to sample mass), in runs when the sample was heated to 350°C and 500°C. Additionally, we found a correlation between the temperature dependence of the chlorobenzene signal and the dichloromethane signal originally identified by the Viking gas chromatograph-mass spectrometer team. We considered possible sources of carbon that may have produced the chlorobenzene signal, by reaction with perchlorate during pyrolysis, including organic carbon indigenous to the martian parent sample and instrument contamination. We conclude that the chlorobenzene signal measured by VL-2 originated from martian chlorine sources. We show how the carbon source could originate from the martian parent sample, though a carbon source contributed from instrument background cannot yet be ruled out.Plain Language Summary
Thefirst successful landers on Mars were the twin Viking spacecraft in 1976. Their primary goal was to determine if life could survive on Mars. The Viking landers looked for organic matter in the martian soil. Organics are critical for astrobiology since carbon forms the key ingrediant for all known living organisms on Earth. Shockingly, a main instrument on the landers, the gaschromatograph-mass spectrometer, detected no organic matter. This was a surprise to scientists, who knew organic material was deposited by comets and meteorites to the martian surface. The apparent absence of organic molecules in the martian surface material became a scientific mystery for decades. In 2008, the Phoenix spacecraft explored the north pole of Mars. Phoenix discovered a salt in the martian soil which is rare on Earth. After further conclusions of the presence of this salt on Mars and complemental experiments on Earth, scientists proposed this salt might have chlorinated any organics inside the Viking instruments. We searched the Viking data for a possible reaction product between the salt and organics in the Viking oven, chlorobenzene, a chlorinated organic molecule. We found evidence of chlorobenzene. We conclude the chlorine component of the chlorobenzene is martian, and the carbon molecule of the chlorobenzene is consistent with a martian origin, though we cannot fully rule out instrument contamination.
1. Introduction
The twin 1976 Viking landers (VL-1 and VL-2) performed thefirst in situ search for organics on the martian surface. Each lander carried a pyrolysis-gas chromatograph mass spectrometer (GCMS), which was used to search for organics in regolith samples excavated with a robotic arm (Biemann et al., 1976). A total of four samples (two at each landing site) were analyzed, each multiple times, by rapidly heating the sample to one of four temperature steps (50, 200, 350, or 500°C) followed by a 15-s hold, before sweeping the volatilized components into a GC column for separation prior to MS detection. Hydrocarbons andfluorocarbons were detected in all runs and attributed to terrestrial contamination (Biemann et al., 1977). All reported com-pounds, with the exception of chloromethane detected by VL-1 at levels of 15 parts per billion (ppb); and dichloromethane detected by VL-2 at levels of 2–40 ppb, were identified in in-flight blank runs despite at a
RESEARCH ARTICLE
10.1029/2018JE005544 Key Points:
• Chlorobenzene is identified in Viking Lander 2 GCMS data
• The chlorine-bearing molecule of the chlorobenzene signal is martian • Evidence consistent with organic
carbon in martian surface sediments is detected in situ by Viking Lander 2
Correspondence to:
M. Guzman,
melissa.guzman@latmos.ipsl.fr
Citation:
Guzman, M., McKay, C. P., Quinn, R. C., Szopa, C., Davila, A. F.,
Navarro-González, R., & Freissinet, C. (2018). Identification of chlorobenzene in the Viking gas chromatograph-mass spectrometer data sets: Reanalysis of Viking mission data consistent with aromatic organic compounds on mars. Journal of Geophysical Research: Planets, 123, 1674–1683. https://doi.org/ 10.1029/2018JE005544
Received 2 FEB 2018 Accepted 12 JUN 2018
Accepted article online 20 JUN 2018 Published online 12 JUL 2018
©2018. American Geophysical Union. All Rights Reserved.
lower level. Despite not being identified in the blank runs, the chloromethane and dichloromethane were attributed to either terrestrial contamination resulting from the preflight use of chlorinated cleaning solvents, or from the reaction of absorbed traces of methanol and HCl (Biemann et al., 1977). While Biemann et al. (1977) did not rule out the possibility that the chloromethane may have been indigenous to the sample, they did not consider the possibility of production of chloromethane in the oven or in the instrument, since they did not know there were oxychlorides in the martian soil. While today the possibility of chloromethane or chlorobenzene indigenous to the martian soil cannot be excluded, it is unlikely, due to the volatility of these compounds (Freissinet et al., 2015). Biemann et al. (1977) also argued that the detection of chloromethane and dichloromethane in the absence of other related chlorinated compounds suggests a terrestrial origin. A variety of aromatic chlorohydrocarbons, in addition to aliphatic ones, should be produced upon heating of the samples (Biemann et al., 1976; Biemann & Bada, 2011; Steininger et al., 2012).
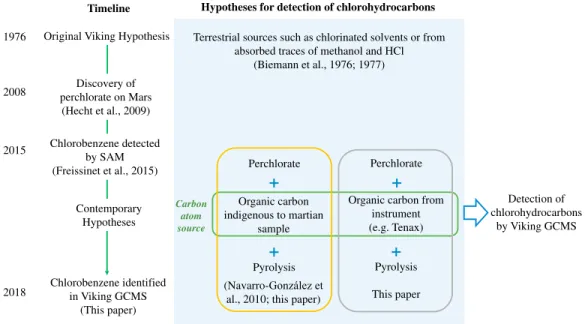
Navarro-González et al. (2010) hypothesized that martian perchlorate,first detected by the Wet Chemistry Laboratory on the 2008 Mars Phoenix lander (Hecht et al., 2009), could offer an alternative explanation for the presence of chloromethane and dichloromethane in the Viking GCMS data sets. Pyrolysis-GCMS experi-ments using Atacama Desert soils that contained parts per million (ppm) levels of organic carbon, released low levels of chloromethane and dichloromethane when mixed with 1 wt% magnesium perchlorate after heating to 500°C (Navarro-González et al., 2010). Based on experimental laboratory results and kinetic models, and the abundance of chloromethane detected by the VL-1 GCMS, Navarro-González et al. (2010) suggested that ppm levels of organics indigenous to the martian sample may have provided the carbon source for the reaction of perchlorate in the Viking GCMS ovens that resulted in the formation of the detected chlorinated organics. This hypothesis for the carbon source plus others which have been explored in the literature or will be explored in this paper are summarized in Figure 1.
The presence of organic carbon in martian surface materials wasfinally confirmed by the Sample Analysis at Mars (SAM) instrument suite, on board the Curiosity rover. SAM was designed to inventory organic and inor-ganic volatiles, released upon heating martian samples, using a combination of temperature-dependent evolved gas analysis (EGA) and GCMS. Despite the presence of high levels of background contamination due to an organic derivatization solvent, N-methyl-N-tert-butyldimethylsilyl-trifluoroacetamide (MTBSTFA), carried in the instrument, the SAM team confirmed the presence of organics indigenous to sedimentary materials at Gale Crater (Freissinet et al., 2015; Glavin et al., 2013). This positive detection was made by
Original Viking Hypothesis
1976 Terrestrial sources such as chlorinated solvents or from absorbed traces of methanol and HCl
(Biemann et al., 1976; 1977)
Hypotheses for detection of chlorohydrocarbons
Discovery of perchlorate on Mars (Hecht et al., 2009) 2008 Perchlorate Perchlorate Organic carbon indigenous to martian sample
Organic carbon from instrument (e.g. Tenax) Pyrolysis Pyrolysis This paper
+
+
+
+
Carbon atom source Timeline Detection of chlorohydrocarbons by Viking GCMS(Navarro-al., 2010; this paper) Chlorobenzene identified in Viking GCMS (This paper) Contemporary Hypotheses 2018 2015 Chlorobenzene detected by SAM (Freissinet et al., 2015)
Figure 1. A summary of past and present hypotheses for the detection of chlorinated hydrocarbons on Mars, including those explored in this paper. Section 4.3.1 of this paper discusses instrument background as the organic carbon source for the chlorobenzene signal and section 4.3.2 discusses organic carbon indigenous to the martian sample as the source of the chlorobenzene signal in the Viking gas chromatograph-mass spectrometer.
measurement of chlorobenzene and dichloroalkanes, at levels up to 300 parts per billion by weight (ppbw) higher than can be explained by background contamination. These chlorinated hydrocarbons were interpreted as thermal decomposition reaction products of martian oxychlorine species and organic carbon derived from martian or exogenous sources such as meteorites, comets, or interplanetary dust particles. The SAM detection of organic carbon indigenous to a martian sample and the seemingly widespread distri-bution of perchlorate on the planet (Glavin et al., 2013; Hecht et al., 2009; Ojha et al., 2015) prompted this reconsideration of the original Viking GCMS data sets and search for evidence of chlorinated hydrocarbons that could be reaction products of perchlorate and organic carbon indigenous to the martian sample in the Viking GCMS ovens. Chlorobenzene is the most abundant chlorinated hydrocarbon detected by SAM with a known organic carbon source indigenous to the martian sample (Freissinet et al., 2015). It is also inter-esting to look for an aromatic chlorohydrocarbon based on the expectation that such compounds should occur in suites (Biemann et al., 1977; Steininger et al., 2012).
We searched the Viking GCMS data sets for evidence of chlorobenzene. Chlorobenzene signals were quanti-fied and compared to the abundances of chloromethane and dichloromethane reported by the Viking GCMS team. The presence of chlorobenzene was considered in the light of possible sources of organic carbon that could have reacted with perchlorate during pyrolysis, such as organic carbon indigenous to the martian sam-ple and instrument contamination. We also searched the Viking background for compounds that might have been released by the degradation of the columns by HCl, as have been detected in SAM.
2. Methods
2.1. Viking GCMS Data
The derived data products from the Viking GCMS instrument were mass scans from the mass spectrometer, which had a dynamic range of 6–7 orders of magnitude (Biemann et al., 1976). It appears from the existing data sets that the mass range (m/z) was 12–215. A complete mass spectrum was scanned every 10.24 s. Up to 500 scans were produced for each GCMS run (Biemann et al., 1977) corresponding to about 48, 66, and 84 min of GC elution time in the case of three different gas chromatographic column temperature protocols. The total data were 16 GCMS runs (one cruise blank for each lander,five at VL-1, and nine at VL-2) focused on the analysis of four soil samples, as listed in Table 1.
Table 1
Summary of Viking GCMS Data
Sample Run ID number Oven temp (°C) Oven purge gas
Time column held at 200°C (min) Total run time (min) VL-1 Blank 10008 500 13CO2 36 66 VL-1 Sample 1 10015 200 13CO2 18 48 Subsurface 10018 500 13CO2 36 66 VL-1 Sample 2 10023 350 13CO2 54 84 Surface 10024 500 13CO2 54 84 10025 500 13CO2 36 66 VL-2 Blank 10007 500 13CO2 36 66 VL-2 Sample 1 10032 200 H2 36 66 Bonneville 10033 350 H2 36 66 Duracrust 10034 500 H2 36 66 10035 500 13CO2 36 66 VL-2 Sample 2 10036 50 H2 36 66 Under Badger 10037 200 H2 36 66 Rock 10038 350 H2 36 66 10039 500 H2 36 66 10041 500 13CO2 36 66
Note. Some analysis conditions for the four martian samples from Table 1 in Biemann et al. (1977) are included. All VL-1 runs used 2–3 mL of13C-labeled carbon dioxide to sweep any emerging volatile material from the oven to the gas chromato-graphic column. Early VL-2 runs utilized H2gas instead of13CO2in order to regulate the effluent divider status and maximize
the amount of sample transferred from the oven to the GC column (Biemann et al., 1977). In addition, the H2mode replaced
the gas in all void areas by hydrogen, allowing a more reliable detection of CO2. For each GC run, the temperature of the GC
column is held at 50°C for 12 min, followed by a linear increase up to 200°C over a period of 18 min, and then held at this temperature for either 18, 36, or 54 min for a total run time of 48, 66, or 84 min (Biemann et al., 1977).
The 16 Viking GCMS runs are preserved on 16-mm microfilms at the NASA Space Science Data Coordinated Archive and were individually scanned to digital imagefiles for this analysis. Although the Viking team origin-ally published mass spectra and gas chromatographs (signal intensity versus time), only the mass spectra (ion intensity versus m/z) are available. We have reconstructed chromatographs for specific ions (Figure 2, bottom right) using the digital mass spectra scans by plotting the ion intensity versus GC run time. The ion intensity shown on these digital mass spectra scans, and used for our paper, is given in arbitrary units in values from zero to 9.99 × 10⁶. The order of magnitude of these units is consistent with realistic values for the total ion current, but there is no direct information available on whether this is a relative or absolute value.
2.2. Presence and Abundance of Chlorobenzene in Viking GCMS Data
The SAM team identified chlorobenzene by its characteristic peak at m/z 112 with a corresponding peak at m/z 114 at about one third the intensity. We screened the Viking data for coincident peaks at m/z 112 and m/z 114 close to the background noise. We used the known abundance of toluene (0.04–0.08 parts per billion by mass or ppbm) in VL-2, Sample 2, GCMS Run 10039 (Biemann et al., 1977), as a reference compound to estimate the abundance of the probable chlorobenzene signal. The only toluene fragment detected by VL-2 (m/z 91) was used to calculate all other toluene mass fragments based on the National Institute of Standards and Technology (NIST) standard. Similarly, we used the NIST standard to calculate the mass fragments of chlorobenzene based on the mass fragments measured by VL-2 (m/z 112 and m/z 114). In these calculations, we considered all m/z which have≥10% of the intensity of the major m/z peak according to the
m/z 112
m/z 112 m/z 114
m/z 112 m/z 114
Scan 147 Scan 148 Scan 149
m/z m/z m/z
arb./u
Run Time
10.24 s
105 110 115 120 105 110 115 120 105 110 115 120
Figure 2. First probable chlorobenzene identification in VL-2. (top) Zoomed-in shots of three subsequent mass spectra scans on microfilm from VL-2, Sample 2, Run 10039 (under Badger Rock). Out of 411 total scans of mass spectra from this run, these are Scans 147, 148, and 149. In Scan 148, a peak at m/z 112 with a coincident peak at about one third the abundance at m/z 114 is clearly visible. The x axis shows the mass-to-charge ratio, while the y axis shows the ion intensity in arbitrary units, as given on the original microfilm. Moving left to right signifies moving through the GCMS run in time, with 10.24 s between each scan. (bottom left) Mass peaks for m/z 77, m/z 112, and m/z 114 compared between the results from the SAM GCMS, the NIST standard, and the Viking GCMS chlorobenzene signal as seen in VL-2, Sample 2, Run 10039. (bottom right) We have reconstructed a chromatograph for m/z 81 from the mass spectra scans on microfilm for VL-2, Sample 2, Run 10039. There is a recurring background signal seen throughout Run 10039, which is also visible in the VL-2 blank run (section 4.3.1). The base peak of this recurring signal is m/z 81. The timing of the GC column heating protocol, using Run 10039 as representative, shows the relationship between the ion intensity of base peak m/z 81, the chlorobenzene signal, and the heating of the column. Other recurring m/z peaks in VL-2 similarly decrease over time. For this specific gas chromatography run, the temperature of the GC column was held at 50°C for 12 min, followed by a linear increase up to 200°C over a period of 18 min, and then held at this temperature for 36 min as given in Table 1 of this paper and originally by Biemann et al. (1977). The specified MS background period refers to six scans of the mass spectrometer background which were obtained just prior to the beginning of the GC phase of the analysis. GCMS = gas chromatograph-mass spectrometer.
NIST standard (i.e., m/z 91, m/z 92, m/z 65, and m/z 39 for toluene and m/z 112, m/z 114, m/z 77, and m/z 51 for chlorobenzene). The sum of the intensities of each mass fragment was calculated for toluene and chloroben-zene, and the toluene-to-chlorobenzene intensity ratio was used to derive a lower limit of chlorobenzene abundance based on the toluene abundance (0.04–0.08 ppbm) reported by Biemann et al. (1977). The final result was corrected by a factor 1.2, corresponding to the ratio of the ionization cross section of chlorobenzene/toluene (Bart, 2003; Harrison et al., 1966).
Our estimates are an order of magnitude approximation of the lower limit of chlorobenzene abundance. First, calculating abundance from mass spectra is not the standard method for GCMS; rather, a chromatograph should be used to extract the area under the curve for a given eluted compound peak. This area provides the abundance of the eluting compound. Due to the scanning rate of the mass spectrometer (10.24 s for Viking) our calculation gives a lower limit on the abundance value since each mass scan captures only a snap-shot of the eluting compound over time. We use the mass spectrum scan where a given signal is seen most clearly (Scan 140 for toluene and Scan 148 for chlorobenzene). This is consistent with the Biemann et al. (1977) reporting of the toluene elution at Scan 140. Second, the amount of chlorobenzene detected is a lower limit to what is actually present in the sample. Some of the original sample will be combusted in the Viking oven, or will be lost during transfer through the instrument, or will not be fully extracted since it is heated only to 500°C.
3. Results
3.1. Chlorobenzene in Viking GCMS Data
Thefirst probable detection of chlorobenzene in the Viking GCMS data sets was identified in VL-2, Sample 2, Run 10039 (Figure 2, top). In Scan 148 (out of 411 scans) of this run there was a clear peak at m/z 112 with a coincident peak at about one third the intensity at m/z 114. There was also a visible peak at m/z 112 in Scans 147 and 149, and a peak at m/z 114 also in Scan 149. Outside of Scans 147–149 there was no signal at m/z 112 or 114 in the rest of the run. No signals were found at m/z 112 or m/z 114 in the blank run for VL-2. For the mass scan where m/z 112 and m/z 114 were both seen most clearly (VL-2, Run 10039, Scan 148), the magni-tude of the m/z 112 peak in arbitrary units was 685 compared to a base peak (m/z 81) value of 7,692 (in a scan where all peaks were normalized to the most abundant ion> m/z 46).
We next searched all Viking GCMS runs in the range surrounding Scans 147 to 149, corresponding to an approximated chlorobenzene GC retention time. No peaks at m/z 112 or m/z 114 were found in VL-1. However, there were m/z 112 and/or m/z 114 peaks found in VL-2 data recurring at the same scan number range (Scan 147–150; Figure 3). Additionally, we searched every scan in every run for any signal at m/z 112 or m/z 114, in case the signal occurred at a different scan number range due to a difference in temperature or other physical condition between VL-1 and VL-2, but no other peaks were found. The chlorobenzene signals were found in two samples at the VL-2 site (Bonneville and under a rock named Badger), only at tem-peratures between 350 and 500°C, similar to dichloromethane (Table 2). In both instances, the measured chlorobenzene signal was highest at 500°C.
Constraining the coincident signal of m/z 77, another important fragment for chlorobenzene, is more nuanced. There is a background signal at m/z 77 throughout most of this run as well as the blank run. We account for this background by subtracting the averaged m/z 77 signal from two scans before (Scans 145–146) and two scans after (Scans 150–151) the three scans where m/z 112 and/or m/z 114 are identified. The result is the mass peaks for m/z 77, m/z 112, and m/z 114 shown in Figure 2 (bottom left), which resemble the relative signal for chlorobenzene identified by SAM in Freissinet et al. (2015).
Estimated chlorobenzene abundances were 1 to 2 orders of magnitude lower than dichloromethane abun-dances reported by Biemann et al. (1977; Table 2). The lower limit of chlorobenzene abundance in the Bonneville sample ranged between 0.1 ppbm and 0.5 ppbm. The lower limit of chlorobenzene abundance under Badger Rock ranged between 0.08 ppbm and 0.7 ppbm. Biemann et al. (1977) used the chloromethane abundance ratio of m/z 50 to m/z 52 detected by Viking to interpret a35Cl/37Cl isotope ratio of about 3:1. This is within the bounds of the ~3:1 to ~5:1 ratio of m/z 112 to m/z 114 for the chlorobenzene peak found in SAM EGA and GCMS Cumberland samples (Freissinet et al., 2015). We do the same calculation for the
chlorobenzene signal in Viking andfind a35Cl/37Cl isotope ratio of ~2.5:1. This is a rough estimate because we calculate the ratio based on only Scan 148 of Run 10039, where we see the clearest signal from both m/z 112 and m/z 114. If we take an average of the isotope ratio using Scans 148 and 149 of Run 10039, where the m/z 112 and m/z 114 peaks are both visible, the ratio is ~5:1.
4. Discussion
4.1. Chlorobenzene at the VL-2 Landing Site
Our reanalysis of Viking GCMS data in the form of 16-mm microfilms revealed a probable signal of chloroben-zene in two samples at the VL-2 landing site, with an estimated lower limit of abundance of 0.1–0.7 ppbm. The background signal throughout the VL-2 runs at m/z 77 could be contributed by benzene or xylene,
Table 2
A Comparison Between the Abundance of Dichloromethaneaand ChlorobenzenebDetected in VL-2 Samples With Temperature
Sample
Oven temp,
Acetone Benzene Toluene Xylene DCMa CBZb
(92) (129) (140) (150) (89) (148) °C (ppbm) (ppbm) (ppbm) (ppbm) (ppbm) (ppbm) Blank 500 120–240c 4–8c 1–2c 0.6–1.4c NDc ND Bonneville 200 60–120c 1–2c 2–3c 0.3–0.5c NDc ND 350 40–70c 3–6c 2–3c 0.3–0.5c 6–14c >0.1 500 10–20c 3–6c 0.8–1.6c 0.4–0.8c 6–14c >0.5 500 1–2c 2–4c 0.6–1.4c 1–3c 2–6c ND
Under Badger Rock 50 NDc 0.2–0.4c 0.1–0.3c NDc NDc ND
200 200–400c 0.6–1.4c 0.4–0.8c 0.3–0.5c 0.04–0.08c ND 350 30–60c 0.6–1.4c 0.3–0.5c NDc 10–20c >0.08 500 <5c 1–2c 0.04–0.08c NDc <4c >0.2 500 5–10c 0.75–1.75c 1–1.5c 0.1–0.2c 20–40c >0.7 Note. Values are in parts per billion by mass (ppbm) for 100 mg samples. Numbers in parentheses indicate the approximate scan numbers where components elute. ND = not detected.
aBiemann et al. (1977). bThis study. cThis value is from Biemann et al. (1977).
Figure 3. All probable chlorobenzene signals in VL-2. Shown are the microfilm area of interest with suspected chlorobenzene signals: Scans 147 to 150 of each VL-2 GCMS run in which chlorobenzene has been identified, as well as the VL-2 blank run (Run 10007) where there is no chlorobenzene signal. Scans in which a relevant chlorobenzene peak is identified are highlighted with a green circled region. Each image shows a zoomed-in shot of subsequent mass spectra on microfilm in which the x axis shows the mass-to-charge ratio while the y axis shows the ion intensity in arbitrary units, as given on the original microfilm. These images illustrate how the chlorobenzene signal is seen only at temperatures between 350 and 500°C, and not in the VL-2 blank run. GCMS = gas chromatograph-mass spectrometer.
known contaminants on Viking (Biemann et al., 1977) or from column bleeding (e.g.,fluorotrimethylsilane, a known contaminant on SAM). Other compounds besides chlorobenzene may have a mass fragment at m/z 112 and m/z 114. We have identified other compounds with coincident peaks at m/z 112 and m/z 114, but have dismissed these compounds as the one in Viking due to the ratio of major peaks in the observed mass spectrum. Based on a convincing mass spectrum match to chlorobenzene (Figure 2, bottom left) and the temperature dependence similar to dichloromethane, we identify this signal as chlorobenzene and refer to this signal as chlorobenzene throughout the remainder of the paper. A more robust identification would compare the observed retention time of the chlorobenzene signal to that of chlorobenzene eluting from a laboratory reconstruction of the Viking GC column with the same packing material. However, certain impor-tant parameters of the packing configuration (e.g., the particle size distribution of the Tenax-GC packing material) in the Viking GC column is unpublished, and the reconstruction of the GC column is a difficult and ongoing task (Novotny et al., 1975; M. Novotny, private communication, 2018).
It is next important to identify the origin of the chlorobenzene in Viking, in order to determine if the signal is evidence of organic carbon indigenous to the martian sample present in the Viking ovens. Because of the high vapor pressure of chlorobenzene, it is unlikely that it was present as such in the martian regolith, although this hypothesis cannot be ruled out with the available data. The detected chlorobenzene is more likely a combination of chlorine- and carbon-bearing compounds in the Viking ovens, as is the case for some SAM samples, and it is assumed that the contribution of chlorine in the Viking GCMS comes from GC pyrolysis rather than being produced by irradiated perchlorate (Freissinet et al., 2015; Glavin et al., 2013; M. Millan, private communication, 2018). In the following sections, we address the origin of both the chlorine and the carbon as possible terrestrial contaminants, or as indigenous to the martian parent sample.
4.2. Chlorine Source
A possible source of chlorine could be chlorinated solvents used to clean the instrument beforeflight (e.g., dichloromethane) per Biemann et al. (1977). However, the boiling points of dichloromethane (~40°C at 1 atm) is very low compared to the temperature at which chlorobenzene wasfirst detected (350°C), and the temperature at which the chlorobenzene signal was highest (500°C), both of which overlap the tempera-ture range where decomposition of oxychlorine compounds occurs (Archer et al., 2014). Since the increase in abundance of chlorobenzene correlates to the temperature range at which oxychlorine compounds decom-pose, we conclude that the chlorine source is martian, probably the result of the decomposition of martian perchlorates or chlorates in the Viking ovens and represents indirect evidence of the presence of oxychlorine species in samples analyzed by VL-2. Additionally, the release of HCl during pyrolysis can be derived from the reaction of SO2with chloride salts and sulfates in the presence of water. However, sulfates only begin degrad-ing around 600°C, above the temperature range of the Vikdegrad-ing ovens (Sutter et al., 2017).
4.3. Carbon Source
The carbon source responsible for the chlorobenzene signal is more difficult to assert (see Figure 1). Here we consider two possibilities: (1) instrument background due to terrestrial organic contaminants; and (2) organic carbon indigenous to the martian sample. We consider only organic carbon as a source for the chloroben-zene discussed in this paper, since carbon-bearing phases such as carbonates, while quite common, do not degrade within the Viking GCMS temperature range of 50–500°C (Boynton et al., 2009; Sutter et al., 2017). 4.3.1. Instrument Background as the Organic Carbon Source of Chlorobenzene
Biemann et al. (1977) reported contaminants eluting at specific scan numbers in VL-2 GCMS runs (Table 2). We report an additional background revealed as a series of mass peaks in all scans (i.e., throughout the chromatograph), and which is also seen in the cruise blank runs, suggesting that these mass peaks are due to contamination in the instrument. A source of contaminants recognized by the Viking team were organic solvents used to clean the walls of the GCMS ovens. Among these, acetone had the highest concentration of the listed contaminants used (Biemann et al., 1977); however, this possibility can be ruled out as the pyrolysis of acetone with HCl does not lead to the formation of chlorobenzene (R. Navarro-González, private communication, 2018).
Another source of instrument contaminants are materials derived from the instrument itself, either through bleeding of the GC column or from sticky organic compounds in the walls of the MS system, which have also been observed in the SAM GCMS system (Freissinet et al., 2015; Miller et al., 2015). For example, the detection
by the SAM GCMS of some aromatic hydrocarbon fragments, including low levels of chlorobenzene in blanks, has been attributed to the degradation of Tenax-TA [poly (2,6-diphenyl-p-phenylene oxide] used in hydrocar-bon and injection traps upstream from the GC columns. Tenax-TA degradation was likely caused by HCl released from the decomposition of martian perchlorate in the GC columns (Freissinet et al., 2015; Miller et al., 2015), an issue that would have been unknown to the Viking team.
In the case of the Viking GCMS, a liquid-modified organic adsorbent consisting of 60- to 80-mesh Tenax-GC was used as packing material in the GC column (Biemann et al., 1977). Tenax-GC and Tenax-TA are essentially the same material, though Tenax-GC is known to be less stable under heating. Like in the case of the SAM instrument, degradation of the Tenax-GC material by HCl released from the decomposition of martian perchlorate could explain several mass fragments seen as background in the Viking GCMS data, including biphenyl (m/z 154), which reoccurs in VL-1 scans but is never seen in VL-2; styrene (m/z 104); xylene and ethylbenzene (m/z 106); cyclopentene and cyclopentadiene (m/z 66 and 67); or trichloromethane (m/z 83 and 85). In addition, we searched for phenol (m/z 94), a precursor of chlorobenzene at high temperature in the presence of an oxychlorine phase. We found small peaks at m/z 94 eluting early in VL-2, Sample 2, Run 10039 in the phase where the column is initially held at 50°C, but there were no m/z 94 peaks in scans where a chlorobenzene signal was observed. Mass peak m/z 94 began to appear consistently after Scan 200 in both the VL-2 blank run and VL-2, Sample 2, Run 10039. Unfortunately, phenol is very refractory and may not elute as such from the GC column. Therefore, we cannot rule out with the available data that the carbon-bearing compound which contributed to the chlorobenzene signal found in the VL-2 GCMS data set was due to Tenax-GC degradation.
We have reconstructed the chromatograph for m/z 81 (attributed to difluorodimethylsilane, as in SAM) using the digitized mass spectra scans for VL-2, Sample 2, Run 10039 (Figure 2, bottom right). There is a recurring signal throughout most of VL-2 with recurring peaks at m/z 81 (base peak). While the m/z 81 background sig-nal in Run 10039 decreases over the run time, which is consistent with column bleeding, there is no indication that the behavior of this background signal correlates to the occurrence of the chlorobenzene; that is, there is no change in the behavior of the background at the same time as the chlorobenzene, which would indicate that its organic carbon source is due to instrument contamination. To truly assert the origin of the chloroben-zene signal it would be necessary to compare the retention time of chlorobenchloroben-zene to that of other hydrocar-bons known to result from Tenax-GC degradation, using a laboratory reconstruction of the Viking GC column. As stated in section 4.1, this column reconstruction is an area for future work.
4.3.2. Organic Carbon Native to the Martian Sample as the Source of Chlorobenzene
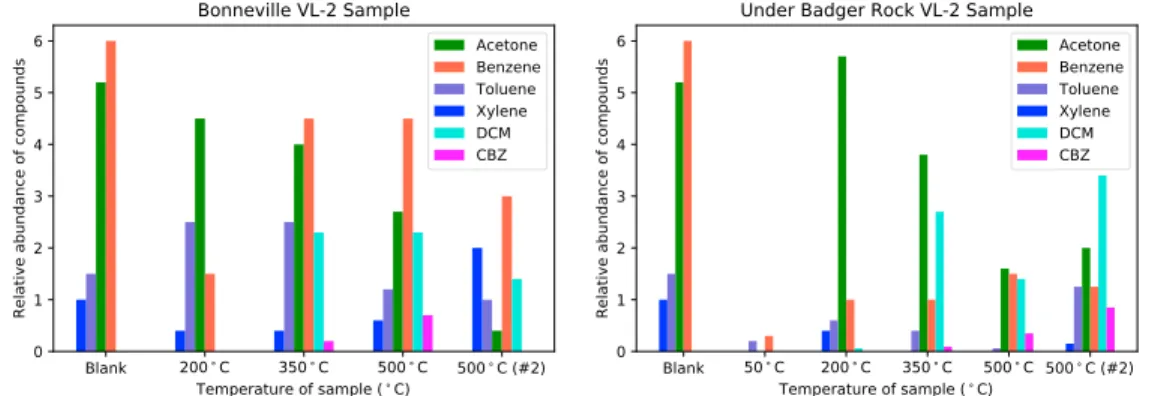
An alternative source of carbon to explain the chlorobenzene signal is ppm levels of martian organic carbon in the soil. In this scenario, organic compounds would be released from the mineral matrix in a sample at cer-tain temperatures and react with perchlorate, or its degradation products, forming chlorobenzene prior to detection by the MS. Navarro-González et al. (2010) showed that chloromethane and dichloromethane were produced this way, but they were not focused on looking for chlorobenzene. However, chlorobenzene is known to be produced in this way as well (Miller et al., 2015). Indeed, the chlorobenzene signal in VL-2 runs was observed between 350°C and 500°C, consistent with observations by the SAM instrument of chloroben-zene between 250°C and 450°C. In addition, the abundance of chlorobenchloroben-zene increased with temperature and was highest after two successive 500°C runs in a sample collected from under Badger Rock, in an area where organics would be better protected from ultraviolet radiation (Moores & Schuerger, 2012). A higher abundance of chlorobenzene at the highest temperature runs and in a sample protected from radiation is compatible with the release of organic compounds trapped in minerals, and it is contrary to the style of release of known contaminants in the instrument, which were detected in highest abundance at lower tem-perature runs (Figure 4). Therefore, the chlorobenzene signal in VL-2 runs is consistent with an organic carbon source native to the martian sample and reacting with martian oxychlorine species during GCMS analysis. 4.4. Comparison Between Viking and SAM
The chlorobenzene abundance in VL-2 is equivalent to ~0.08–1.0 ppbw, while SAM detected 150–300 ppbw of chlorobenzene (above background) in the Cumberland drill sample (Freissinet et al., 2015). It is difficult to make a direct comparison between these abundances, due to differences between the instruments and sam-ples. Each GCMS heats at different temperatures and rates, causing differences in combustion, line loss, and line temperature. The Viking ovens areflash heated, while the SAM ovens are heated at 35°C/min. It is known
that the chemistry of the reaction inside the oven is different in these two cases (M. Millan, private communication, 2018). SAM’s Cumberland sample was drilled in a clay-rich region, while VL-2 scooped one of its samples underneath a rock. Additionally, SAM deals with two sources of contamination: a leaked derivatization agent, MTBSTFA, and background from its hydrocarbon trap. In SAM, the leaked MTBSTFA produces a background of chloromethane and dichloromethane, which is impossible to separate from that which may be produced due to ppm levels of organic carbon in the martian sample. The Tenax-TA used in the SAM hydrocarbon trap is responsible for the instrument background of ~12 ppbw of chlorobenzene. While not quantifiably comparable, the Tenax-GC component in Viking could be a source of organic carbon contamination as well.
5. Conclusion
We identified chlorobenzene with a characteristic isotopic ratio between m/z 112 and m/z 114, in several VL-2 GCMS runs at temperatures>200°C, with a maximum signal at 500°C. We interpret this signal as the reaction product of chlorinated compounds with organic carbon compounds at high temperature.
The high temperature of the chlorobenzene release was not consistent with a terrestrial source of chlorinated compounds, such as dichloromethane used to clean the GCMS ovens, which has a low boiling point. Instead, the temperature range overlaps with the temperature range where decomposition of oxychlorine com-pounds occurs. Based on this, and on the absence of chlorobenzene in the VL-1 GCMS, which had the same cleaning protocol, we conclude that the chlorine source was martian. This would suggest perchlorates or other oxychlorines are also present at the VL-2 landing site.
Degradation of Tenax-GC used to pack the Viking GC columns by HCl released from perchlorate decomposi-tion could provide an instrument organic carbon source. This process would explain the presence of other hydrocarbons in the VL-1 and VL-2 GCMS runs, which coincide with Tenax-MS degradation products observed by the SAM instrument suite on the Curiosity rover. To test this, it would be necessary to compare the retention time of chlorobenzene and other hydrocarbons known to result from Tenax-GC degradation using a laboratory reconstruction of the Viking GC column with the same packing material.
The temperature range at which the chlorobenzene signal was observed, and the highest signal in a sample protected from UV radiation, were also consistent with a martian carbon source reacting with Martian oxy-chlorine species during GCMS analysis. Through this work we have demonstrated that the Viking GCMS experiment could have detected organic carbon indigenous to a martian sample for thefirst time, almost 40 years before the detection by the Curiosity rover’s SAM experiment.
References
Archer, P., Franz, H., Sutter, B., Arevalo, R., Coll, P., Eigenbrode, J., et al. (2014). Abundances and implications of volatile-bearing species from evolved gas analysis of the Rocknest aeolian deposite. Gale Crater, Mars, 119(1), 237–254.
Figure 4. Trends of relative abundance of compounds identified in VL-2 runs, Sample 1 (Bonneville) and Sample 2 (under Badger Rock). The natural log of the abundance of acetone and dichloromethane (DCM) in ppbw is plotted in order to visualize less abundant compounds clearly. The actual calculated abundance in ppbw is shown for all other compounds (benzene, toluene, xylene, and chlorobenzene or CBZ). The average abundance is used for all compounds. After an initial heating to 500°C, each sample was heated again at 500°C. The blank run shown on each graph above is the same data, as only one blank run was performed inflight for each of the landers and it was run at 500°C.
Acknowledgments
This work could not have been conducted without the continuous support of Dave Williams, Allison Lopez, Danny Hoag, Sharlene Rhodes, and Barbara Pope from the NASA Space Science Data Coordinated Archive (NSSDCA) group at the NASA Goddard Spaceflight Center. The original Viking GCMS data can be accessed at the NSSDCA in Greenbelt, Maryland. R. N. G. acknowledges UNAM (IN109416) and CONACyT (220626) for their support. R. Q. acknowledges the support of the NASA Astrobiology Institute. We honor and thank the late Klaus Biemann for his irreplaceable contribution to the search for organics on Mars and for his invaluable advice and encouragement in the early stages of this work.
Bart, M. (2003). Electron impact ionization: measurements of absolute cross-sections and cross-beam studies. Christchurch, New Zealand: University of Canterbury.
Biemann, K., Oro, J., Toulmin, P., III, Orgel, L. E., Nier, A. O., Anderson, D. M., et al. (1976). Search for organic and volatile inorganic compounds in two surface samples from the Chryse Planitia region of Mars. Science, 72–76, 194, 4260. https://doi.org/10.1126/science.194.4260.72 Biemann, K., & Bada, J. (2011). Comment on“Reanalysis of the Viking results suggests perchlorate and organics at midlatitudes on Mars” by
Rafael Navarro-González et al. Journal of Geophysical Research, 116, E12001. https://doi.org/10.1029/2011JE003869
Biemann, K., Oro, J., Toulmin, P. III, Orgel, L., Nier, A., Anderson, D., et al. (1977). The search for organic substances and inorganic volatile compounds in the surface of Mars. Journal of Geophysical Research, 82(28), 4641–4658. https://doi.org/10.1029/JS082i028p04641 Boynton, W., Ming, D., Kounaves, S., Young, S., Arvidson, R., Hecht, M., et al. (2009). Evidence for calcium carbonate at the Mars Phoenix
landing site. Science, 325(5936), 61–64. https://doi.org/10.1126/science.1172768
Freissinet, C., Glavin, D., Mahaffy, P., Miller, K., Eigenbrode, J., Summons, R., et al. (2015). Organic molecules in the Sheepbed Mudstone, Gale crater, Mars. Journal of Geophysical Research: Planets, 1–20.
Glavin, D., Freissinet, C., Miller, K., Eigenbrode, J., Brunner, A., Buch, A., et al. (2013). Evidence for perchlorates and the origin of chlorinated hydrocarbons detected by SAM at the Rocknest aeolian deposit in Gale crater. Journal of Geophysical Research: Planets, 1955–1973. Harrison, A., Jones, E., Gupta, S., & Nagy, G. (1966). Total cross sections for ionization by electron impact. Canadian Journal of Chemistry,
44(16), 1967–1973. https://doi.org/10.1139/v66-293
Hecht, M., Kounaves, S., Quinn, R., West, S., Young, S., Ming, D., et al. (2009). Detection of perchlorate and the soluble chemistry of Martian soil at the Phoenix lander site. Science, 325(5936), 64–67. https://doi.org/10.1126/science.1172466
Miller, K., Kotrc, B., Summons, R., Belmahdi, I., Buch, A., Eigenbrode, J., et al. (2015). Evaluation of the Tenax trap in the Sample Analysis at Mars instrument suite on the Curiosity rover as a potential hydrocarbon source for chlorinated organics detected in Gale crater. Journal of Geophysical Research, Planets, 120(8), 1446–1459. https://doi.org/10.1002/2015JE004825
Moores, J., & Schuerger, A. (2012). UV degradation of accreted organics on Mars: IDP longevity, surface reservoir of organics, and relevance to the detection of methane in the atmosphere. Journal of Geophysical Research: Planets, 117, E08008. https://doi.org/10.1029/2012JE004060 Navarro-González, R., Vargas, E., de la Rosa, J., Raga, A., & McKay, C. (2010). Reanalysis of the Viking results suggests perchlorate and organics
at midlatitudes on Mars. Journal of Geophysical Research, 115(E12), E12010. https://doi.org/10.1029/2010JE003599
Novotny, M., Hayes, J., Bruner, F., & Simmonds, P. (1975). Gas chromatographic column for the Viking 1975 molecular analysis experiment. Science, 189(4198), 215–216. https://doi.org/10.1126/science.189.4198.215
Ojha, L., Wilhelm, M., Murchie, S., McEwen, A., Wray, J., Hanley, J., et al. (2015). Spectral evidence for hydrated salts in recurring slope lineae on Mars. Nature Geoscience, 8(11), 829–832. https://doi.org/10.1038/ngeo2546
Steininger, H., Goesmann, F., & Goetz, W. (2012). Influence of magnesium perchlorate on the pyrolysis of organic compounds in Mars analogue soils. Planetary and Space Science, 71(1), 9–17. https://doi.org/10.1016/j.pss.2012.06.015
Sutter, B., McAdam, A., Mahaffy, P., Ming, D., Edgett, K., Rampe, E., et al. (2017). Evolved gas analyses of sedimentary rocks and eolian sediment in Gale crater, Mars: Results of the curiosity rover’s sample analysis at Mars instrument from Yellowknife Bay to the Namib dune. Journal of Geophysical Research: Planets, 122(12), 2574–2609.