A Diagnostic Study of Extratropical Winter Low
Frequency Variability of Northern Hemisphere
by
Yan Cui
M.S., Enviromental Sciences, Beijing University (1993)
Submitted to the Department of Earth, Atmospheric and Planetary Sciences in partial fulfillment of the requirements for the degree of
Master of Science in Meteorology
at the
MASSACHUSETTS INSTITUTE OF TECHNOLOGY
May 1996
@ Massachusetts Institute of Technology 1996. All rights reserved.
Author ... . Author... ... Center for Meteorology and Physical
Oceanography Department of Earth, Atmospheric, and Planetary Sciences May 18, 1996
Certified by ...
Professor John Marshall Thesis Supervisor
Accepted by...
Professor Thomas H. Jordan Department Chairman
Jt
6
J
4
a%)
MIT
flies~a,:
A Diagnostic Study of Extratropical Winter Low Frequency
Variability of Northern Hemisphere
by
Yan Cui
Submitted to the Department of Earth, Atmospheric and Planetary Sciences on May 18, 1996, in partial fulfillment of the
requirements for the degree of Master of Science in Meteorology
Abstract
The principal objective of this thesis is to study the extratropical winter low frequency variability of northern hemisphere from a PV perspective, which is physically more revealing than the 500 MB pressure surface geopotential height field used by Dole and Gordon (1983), Dole (1986) and Neilley (1990) and gives us a complete picture about the dynamical state of the atmosphere. We characterize the recurrent low frequency persistent anomaly patterns in terms of the phase relationship between potential temperature on tropopause (Otrop) and 850 MB (0850) themselves and with the underlying land/sea contrast and orography.
Using criteria derived from Otrop and 0850 idealized picture, PAC(+), PAC(-) and ATL(+) cases are identify from 15 years of NMC global analysis data. The cases compare well with Neilley (1990) and the difference is discussed. We also present the composite cases to show that the persistent cases identified in this thesis are
consistent with the persistent anomalies in the literature.
Detailed examination of observational data reveals that: 1). PAC(+), ATL(+) and PAC(-) cases have duration from about one week to one month, and are basically low frequency phenomena in the sense that daily maps resemble the case average. 2). PAC(+) (ATL(+)) cases are characterized by a broad warm potential temperature ridge over the Pacific (the Atlantic) on both tropopause and 850 MB, which is com-patible with the land/sea thermal contrast. They look like thermally equilibrated responses in Marshall and So (1990) because the warm air tends to stay over the ocean and cold air tends to stay over the land in the winter. The configuration of positive persistent cases effectively steers synoptic systems to the north of the ridge and maintains its persistence. 3). For PAC(-) cases, Otrop and O850 have phase rela-tionship out of phase with the land/sea thermal contrast, but the position of the ridge is compatible with the stationary planetary wave pattern due to the Rockies. This stationary forcing is evident when the flow is not thermally equilibrated. 4). PAC(+) and PAC(-) states may act as two natural attractors and the atmosphere oscillates between these two states regionally. 5) for ATL(-) cases, Otrop has concentrated con-tours over the Atlantic and divergence over the Europe, but surface temperature still
have warm over the ocean and cold over the land. The ATL(+) cases look more like intense zonal flow with synoptic systems embedded within it. Its low frequency characteristics is not as evident as the PAC cases and ATL(+) in the sense that twice daily maps can be very different from the case average. The out of phase relationship of 0
trop and 0850 implies rapid development rather than persistence. Due to the lack
of large mountains, the Atlantic region doesn't have another natural attractor for persistence other than the thermally equilibrated state ATL(+). The oscillation is between the thermal equilibrated response and intense zonal flow.
Thesis Supervisor: John Marshall Title: Professor
acknowlegements
I would like to express my sincerest gratitude to my advisor, Professor John Marshall, for his insightful, intellectual, inspirational guidance throughout this research. I would also like to thank Dr. Lodovica Illari, who has originally suggested this topic and has on many aspects provided me helpful suggestions and guidance.
I would like to thank Professor Kerry Emanuel, Professor Dick Lindzen, Profes-sor Mario Molina and ProfesProfes-sor Alan Plumb for their well organized and insightful lectures.
Special thanks go to Michael Morgan in providing the code to determine basic state. I also wish to thank my fellow students at MIT for their continuing inspira-tion and friendship. Special thanks go also to the members of CMPO support staff including Jane McNabb, Tracy Stanelun, Helen Dietrich, Linda Meinke.
Most of all, I wish to thank my Husband, Guduan Gong. His love, encouragement and dedication will forever be cherished. I express my deepest love and respect to him.
This thesis is dedicated to my parents, Tianbao Cui and Chunying Liu. Their unselfish love has been a continuing source of inspiration.
Contents
1 Introduction
1.1 Observational studies . . . . . . . . .. 1.2 Theoretical ideas about low frequency variability . . . .
1.2.1 Tropical forcing ... .. ... 1.2.2 Instability ... .. ... 1.2.3 Modons and Multiple equilibria . . . .. 1.2.4 Thermal equilibration ... . 1.3 Summary ... ... ...
2 Motivation
2.1 Background ... .... ...
2.1.1 PV perspective ... ... .... 2.2 Characteristics of Persistent Cases from PV perspective
2.2.1 Pacific Positive Cases . ....
2.2.2 Pacific negative cases . . . . . . . . . ... 2.2.3 Atlantic positive cases . . . ... 2.2.4 Atlantic negative cases . . . .. 2.2.5 1000 MB geopotential field . . . .... 2.3 Data Set and Methodology .. . . . . . . . .. 2.4 Discussion ... ... .... .
3 Pacific Persistent Cases
3.1 Observations of PAC(+) and PAC(-) ...
7 9 . . . . . . 13 . . . . 13 . . . . . 13 .. . . . . 14 . . . . 15 . . . . . 16 17 . . . . 17 . . . . 17 . . . . . 19 . . . . . 20 . . . . . 21 . . . . . 22 . . . . . 22 .. . . . . 22 .. . . . . 23 . . . . 23
3.1.1 PV distribution on isentropic surfaces . . . . 3.1.2 Tropopause potential temperature distribution . 3.1.3 Surface potential temperature distribution . . . 3.1.4 Cross sections . . . . . . . . . . . ..
3.1.5 An idealized picture ... ...
3.2 Study of a 15 years of period . . . .. 3.2.1 The criterion . . . . . . . . ..
3.2.2 Cases identified . . . . . . . . . ..
3.3 Case studies ... ...
3.4 Composite cases... ... 3.5 Summary ... ... ...
4 Atlantic Persistent Cases 4.1 Observations ...
4.1.1 An idealized picture . 4.2 Study of a 15 years of period .
4.2.1 The criterion ... 4.3 Cases identified ...
4.4 A case study... . 4.5 Composite cases . . . . 4.6 Summary ...
5 Discussion and Summary
5.1 PV and climatology . . . . 5.2 The positive cases and thermal equilibration 5.3 The cases and synoptic scale wave packets . 5.4 Possible further work .. . . . . ...
5.5 Summary . . . . . . . . ....
Bibliography
Appendix A: Case dates of Neilley(1990)
. . . . 31 . . . . 32 . . . . 32 . . . . 33 . . . . 33 . . . . 34 . . . . 34 . . . . 35 . . . . 36 . . . . 39 . . . . 40 54 . . . . . . . . . . .. . 54 . . . . . . . . . 55 . . . . . . . . . 55 . . . . . . .. . 5 5 . . . . .. . . . . .. . 5 5 . . . . . . . . . . .. . 5 6 . . . . . . . . 57 . . . . . . . . . . .. . 5 8 66 66 68 69 69 70
Chapter 1
Introduction
Over the past several decades, the accuracy of synoptic time scale weather prediction has been greatly improved. Weather prediction of longer than one week or ten days becomes the frontline of intense research and practical interest. On the weather maps the tendency of the atmosphere toward persistence (like blocking) is easy to be no-ticed. Many studies (Hoskins et al., 1983; Blackmon et al. 1984a, b) have shown that phenomena with temporal scales on the order of several days behave considerably different from those with characteristic temporal scales greater than about a week. Recurrent large-scale persistent anomaly patterns are an important component of low frequency variability of the extratropical winter atmosphere. Understanding of these intermediate period variations (about a week to a month in the large scale atmo-sphere) could not only lead to improved predictability of forecasting in the 'medium range', but also help us to understand the physics of longer time scale low frequency variability.
Persistent anomalies are deviations from the winter seasonal climatological mean flow, including the deviations from zonal symmetry, which are commonly referred to as the stationary waves. Stationary wave amplitudes in the geopotential height field increase markedly with height up to the tropopause level, which is indicative of an equivalent barotropic component in the vertical structure, while in the high latitudes the vertically propagating component is comparable with the equivalent barotropic component.
It is generally agreed that thermal forcing dominates the lower troposphere with a pronounced westward tilt with height and poleward heat flux. But there are hot debates about the relative importance of topographic and thermal forcing in the middle and upper troposphere, Rong-Hui and Gambo (1982) concluded that diabatic heating was more important. Held (1983) found the responses to topographic and thermal forcing were comparable, but the topographic response had smaller spatial scale. Jacqmin and Lindzen (1985) found topographic wave response dominated, but midlatitude interannual variability in the troposphere was much more sensitive to thermal forcing. They used a GCM without sensible heating, and suggested that the unrealistic tropospheric Aleutian high in the model result could be corrected in part by the inclusion of sensible heating associated with the Kuroshio current system. On the other hand as noted by Shutts (1987), the way to impose forcing in these models tends to overestimate the topographic forcing by forbidding the flow to go around mountains, and underestimate the thermal forcing by excluding the possibility of 'thermal equilibration'. Thermal forcing therefore at least influences the pattern of stationary waves in the upper troposphere, and might dominant its variability.
This thesis is toward a succinct and dynamically consistent way of understanding extratropical winter low frequency variability of northern hemisphere. Chapter 1 briefly reviews observational and theoretical studies. We see that observational studies of low frequency variability more often than not concentrate on just one level of the atmosphere typically 500 MB or 300 MB. Instead this thesis will look at tropopause and 850 MB potential temperature as a summary of dynamical state. Chapter 2 provides the observational and dynamical rationalization for the work that follows. The persistent anomaly cases, including cases near the Pacific (PAC(+), PAC(-)) and the Atlantic (ATL(+), ATL(-)), have characteristic regional PV configuration (including surface temperature) with proper phase relationship with the underlying topography. In terms of tropopause and 850 MB potential temperature fields, for the positive cases, 0trop and 0850 are in phase with each other and with the thermal
nature of the underlying topography; for the Pacific negative case , Otrop and 85ss are nearly in phase with slight eastward tilt, but both of them are out of phase with
the land/sea thermal contrast and compatible with the stationary planetary waves implied by the Rockies; for the Atlantic negative cases, the surface temperature is very much affected by the sea/land thermal contrast, while the tropopause temperature undulates and more like an integration of synoptic oscillations. A description of the data set and calculation methodology is also presented in Chapter 2. Chapter 3 studies in detail the Pacific cases observationally. It gives an idealized picture of the Otrop and 0850 of the Pacific persistent anomaly cases. Case studies are given to illustrate the PV evolution during the persistent cases and their transition, with particular interest in the importance of the interaction of upper-level PV distribution with surface temperature and the role of synoptic systems in their transition. Based on the idealized picture and many cases we studied, a new criterion has been found and used to study a 15 year period of NMC global analysis data. Composite maps are given for the case periods identified and compared with those from Neilley (1990)
and the idealized picture is argued to be not only physically clear but also practically consistent. Chapter 4 studied Atlantic cases, especially the difference from the Pacific cases. Using an idealized picture, a criterion is found and used to identify ATL(+) and composite maps are compared with Neilley(1990)'s. Chapter 5 discussed the importance of the PV perspective in understanding the climatological flow. With very slight surface wind and tropopause isentropes nearly parallel with wind, the positive cases resemble thermally equilibrated free modes found by Marshall and So
(1990).
1.1
Observational studies
The most obvious low frequency feature in the middle latitude is blocking, which has been continuously studied since the seventies in the hope of predicting weather into the medium range of a week or two. Green (1977) proposed that high frequency syn-optic eddies might act to maintain low frequency blocking events through a positive feedback effect due to fluxes of vorticity at upper levels. In this theory the deforma-tion of the synoptic storms in the split jetstream west of the block would cause them
to reinforce the split, so maintaining the block. Austin (1980), Illari and Marshall (1983), Illari (1984), Hoskins et al. (1985), Shutts (1986), Dole (1986), Metz (1986) have all shown from different case studies that synoptic storms can have a positive feedback on the time mean flow reinforcing the anomalous dipole circulation during persistent blocking. But other mechanisms might be more influential in determining when and where the anomalies develop, and in anchoring them in certain favored geographical positions.
Rossby (1939) postulated that the semi-permanent 'centers of action' associated with the ultra-long waves forced by land-sea thermal contrasts and mountains should tend to drift westward during periods of weak zonal circulation and vice versa. Rossby and his collaborators noticed the apparent tendency for 'high index' and 'low index' situations. This index is defined by the meridional pressure gradient in the lati-tude belt between 350N and 550N. 'High index' situation is characterized by abnor-mally warm temperatures in middle latitudes, strong high latitude baroclinicity, and a poleward displacement of the zonally-averaged jetstream relative to its usual posi-tion; 'low index' situation is characterized by an expanded polar vortex with strong mid-latitude baroclinicity and strong westerlies near 300N. The papers of Rossby and Willet (1948) and Namias (1950) viewed the index-cycle fluctuations as resulting from the combined action of cyclogenesis, diabatic heating gradients and frictional dissipa-tion. Wallace and Hsu (1985) pointed out that coordinated outbreaks of cyclogenesis on a hemispheric scale seems incompatible with (i) the presence of the northern hemi-sphere winter stationary waves which give rise to strong longitudinal contrasts in local baroclinicity along any given latitude circle and (ii) the two-dimensional character of planetary wave dispersion in the northern hemisphere troposphere. The strong re-gional dependency of low frequency variability implies a complete understanding of low frequency phenomena has to deal with regional or geographical characteristics. And resonance, if it occurs, will be a local resonance.
Dole and Gordon (1983) studied the geographical distribution of winter persis-tent anomalies over the Northern Hemisphere. They defined a local, latitude-scaled temporal height anomaly
sin450
Z = Z' (1.1)
sinO
where Z' is the deviation of the 500 MB geopotential height from its long-term seasonal trend and 0 is latitude. They defined a persistent anomaly whenever Zo
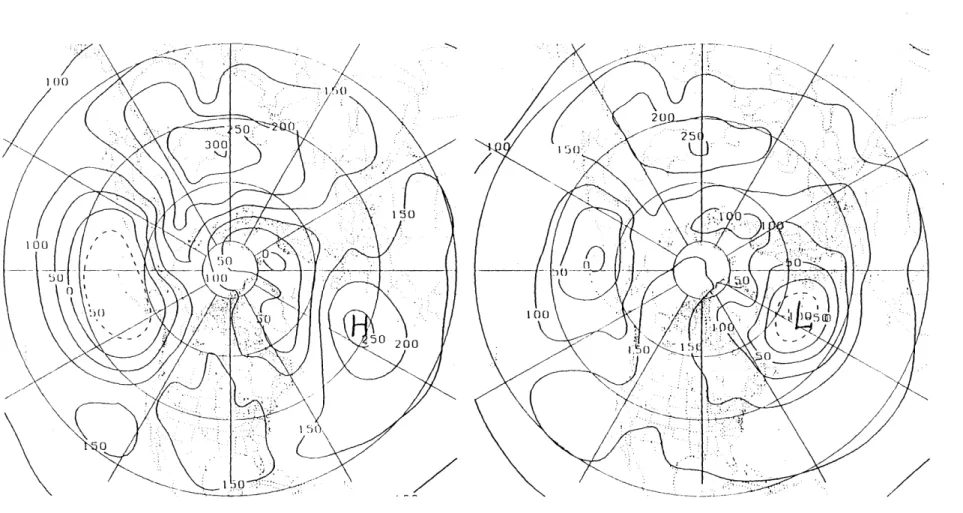
exceeds a threshold of 100 m for at least 10 consecutive days. They found that persistent anomaly events occurred most frequently in three 'key' regions: over the eastern North Atlantic Ocean (ATL), the eastern North Pacific Ocean (PAC) and over the Northern Soviet Union (NSU). Later work by Dole (1986) showed that the cases he had identified represented particularly strong realizations of the dominant patterns of the low-frequency variability of the atmosphere. He also found that the composite-anomaly patterns of the positive and negative cases over each region could be broadly described as opposite phases of the same basic pattern, although the full field composites were characterized by considerably different structures. Fig. 1 is from Dole (1986) showing composite 500 mb height anomaly maps for 7 PAC(+) cases (la) and 7 PAC(-) cases (ib). 1d,le shows the corresponding composite maps of the 500 MB height. Near the key points, the positive cases are often associated with blocking patterns while the negative cases are characterized by abnormally intense zonal flow. Apart from the primary features, significant anomalies are often found downstream of the key regions. The complete patterns consisting of both the primary and downstream anomalies resemble strong realizations of the major teleconnection patterns identified by Wallace and Gutzler (1981). Teleconnection patterns often bare a strong resemblance to stationary Rossby waves dispersing on a sphere and such large scale patterns often begin and/or end in the tropics. Evidence for large scale teleconnections over the Atlantic explained less variance than the PNA mode. But even across the whole Pacific and western American seaboard, more localized and intense blocking events certainly still appear in the data, superimposed on the larger scale PNA patterns.
One of the few diagnostic studies which try to identify possible dynamical causes of the persistence of atmospheric states, particularly of the large scale teleconnection
variety, is that of Branstator and Opsteegh (1989). They took various 500 MB or 300 MB atmospheric flows over the entire globe during periods of persistent atmospheric anomalies as initial states and searched numerically for nearby steady free states (free modes) of the barotropic vorticity equation. Such free mode states may perhaps act
as attractors when the atmosphere is considered as a dynamical system.
Despite the development of new methods assisted by fast computers, it remains an open question to identify objectively atmospheric states which may be synopti-cally considered as persistent based on dynamical and physical mechanisms. The development and diagnosis of high resolution PV fields, however, has given a new impetus to these studies. (Hoskins et al. (1985)). Note that the three dimensional nature of the invertibility principle for PV means that a full picture of the blocking circulation and eddy reinforcement mechanism should consider all relevant vertical levels and in particular the role of boundary temperature anomalies. Relatively little work has been done in this area and more is needed if a fully consistent picture of the persistence of both surface and tropopause level flow is to emerge. Morgan (1994) found a way to define a basic state based on the observation that isentropic potential vorticity is nearly uniform in the troposphere and lower stratosphere away from the jet stream, but has concentrated gradients at the tropopause, and that climatological
maps of PV and Montgomery potential show a strong tendency to be aligned. His basic state can be regarded as the balanced mass and wind field of a steady free flow, in which synoptic scale waves and other transients have been removed, but in which dynamically important features (e.g PV gradient) of the observed distribution have been retained.
1.2
Theoretical ideas about low frequency
vari-ability
1.2.1
Tropical forcing
Many theories (Hoskins and Karoly, 1981; Simmons, 1982; Navarra, 1990) have sug-gested that diabatic heating from the tropics could be important in forcing low-frequency variability in mid-latitudes. Davey (1989) proposed that tropical waves such as moist Kelvin waves may have long development timescales to influence mid-dle latitudes through planetary Rossby wave propagation triggered by divergence at upper levels at longitudes where the sub-tropical potential vorticity gradients are strongest such as over Indonesia (Sardeshmukh and Hoskins (1988)). On the 1-2 week timescale a persistent anomalous upper level divergence could provide a source of Rossby wave energy propagation into mid-latitudes to produce low-frequency vari-ability. However, numerical investigations have had only limited success in producing significant extratropical response to tropical heating. Lindzen (1986) notes that as the sophistication of the models increases, the mid-latitude response to tropical heating anomalies tends to decrease. Further, Plumb (1985) found little observational evi-dence for the forcing of the stationary waves from tropical sources. Even if tropical forcing and heating variations may not have a major role in forcing the extratropi-cal low frequency variations, tropiextratropi-cal variability may still have an indirect effect by modifying the strength of Hadley circulation as suggested by Hou and Lindzen (1992) which could change the wave activity through the change of PV gradient at the winter edge of the Hadley circulation.
1.2.2
Instability
Simmons et al. (1983) proposed that the low-frequency variability of the Northern Hemisphere winter general circulation could be attributed to the barotropic instability of upper tropospheric winds. Unstable normal modes of a zonally and meridionally varying climatological upper-tropospheric flow are found to be of long period and
bear a resemblance to persistent features which tend to have an equivalent barotropic structure in vertical. Borges and Sardeshmukh (1995) examined the evolution of linear Rossby waves on representative zonally varying upper tropospheric flow, and found that the growth of free perturbations in a linear barotropic model is too weak to explain, by itself, the dominant observed structures of extratropical low-frequency variability. Their analysis implies that one cannot explain the relative importance of, or the energy contained in, the patterns of extratropical low-frequency variability with only knowledge of upper tropospheric flows.
Frederiksen (1982, 1983, 1984, 1986, 1989) argued for a role for mixed mode in-stabilities involving an initial large-scale mixed baroclinic-barotropic instability stage followed by stationary barotropic growth stage. Observational evidence (Dole and Black, 1990) suggests that both baroclinic and barotropic extraction of energy from the climatological-mean state on a large-scale are likely to play a important role in the development of negative persistent anomalies over the North Pacific, with the baroclinic conversions dominating the early stages of development. However, the ap-plication of instability theory, especially over these longer timescales, to flows which are not exactly steady states is a sensitive procedure since the instability modes may interact with the forcing which is needed to maintain the mean flow, as described by Andrews (1984). Since the range of interlocking feedback which must operate to
support the atmospheric mean flow are not fully understood it is difficult to draw detailed conclusions on the evolution of transients which grow upon the flow.
1.2.3
Modons and Multiple equilibria
Modons have also been shown to resemble some mature blocking structures. They are characterized by internal and external flow regions having separate functional relationships between the PV and the non-divergent flow. The PV structure in the persistent anomaly cases identified by Dole and Gordon (1983) and later work is char-acterized by an open-wave structure while the traditional blocking PV field consists of a more convoluted structure, with closed (or nearly closed) off low PV pool north of the mean PV gradient. The local resonant character of modon and coherent structure
theory may be very important to the regional characteristics of persistent features. Another mechanism proposed is that the large scale flow may persist in several attractor basins or multiple equilibria with occasional transitions occurring between these regimes. For the equations describing atmospheric motion, solutions may be sought which are stationary large scale flow patterns in equilibrium with external forcing or boundary conditions, due to for example topography, surface temperature contrasts or diabatic heating. For time mean solution transient eddy fluxes of heat and vorticity may also on occasion be considered as forcing terms. It was speculated that certain persistent flow patterns such as blocking may be close to a particular quasi-equilibria. Although some evidences for multiple equilibria exist, the time the atmosphere spent between these equilibria is not trivial and the dynamical reason behind their cause and transition of different states is not obvious.
1.2.4
Thermal equilibration
The low frequency transients result not only from the internal dynamics of the atmo-spheric flow, particularly the nonlinear interactions between different scales of motion which lead to a cascade of energy toward lower frequencies, but are also forced by interactions between the atmospheric circulation and more slowly varying systems, such as the ocean.
Persistent wave patterns related to underlying land-sea distribution have long been noticed. Marshall and So (1990) showed in a three-level quasi-geostrophic model that in addition to the thermally forced response, the atmosphere tends to relax to an unforced steady free mode characterized by vertical phase lines, zero surface winds, vanishing diabatic heating rates and a temperature field that is phased locked to the underlying land- sea distribution. In winter climatology, the atmosphere oscillates between these two states, but to what extent and on what spatial and temporal scale the atmosphere chooses to stay on the unforced and forced states, and the dynamical and climatological reasons behind the states and their transition is still an open question.
1.3
Summary
Despite the development of fast computers and improvement of data resolution, a physically clear picture helping us to explain and predict the low-frequency systems has yet to be achieved. This thesis will concentrate on the low frequency variability pattern "PAC" and "ATL" positive and negative cases, which are considered similar patterns in the literature. The positive cases are characterized by an amplified ridge over Pacific or Atlantic, reduced Aleutian or Icelandic low, slight surface wind. The negative cases are characterized by an intense zonal flow over the Pacific or Atlantic, extensive and deep Aleutian or Icelandic low. We will try to understand these fea-tures from the PV perspective, which has been proved a valuable tool for diagnosing cyclogenesis (Davis and Emanuel, 1990) and hurricane (Wu and Emanuel,1993), but few studies has applied both the invertibility and conservation properties of PV to low frequency phenomena. we emphasis that a solid understanding of the phenomena has to incorporate the regional characteristics, especially land-sea contrast and large scale orography.
Chapter
Motivation
2.1
Background
2.1.1
PV perspective
For a fully baroclinic, compressible flow, potential vorticity is defined as
1
Q = -Va VI0 (2.1)
where p is the density of air, (a is the absolute vorticity, and 0 the potential temperature. For a hydrostatic atmosphere, the potential vorticity on isentropic
surfaces may be written as
Cao
Q =-g @ 80
where p is pressure and g is the gravitational acceleration. The lagrangian time rate of change of Q is given by
DQ 1 . 1
S- a V+-x F 0),
Dt p p
(2.2)
(2.3)
where 6 represents diabatic heating, and F is a frictional force.
This conservative property of PV allows one to identify and follow features in a meaningful way and to isolate the effects of nonconservative processes on the dy-namics. With appropriate balance condition to specify the interdependent relation between the wind and temperature fields, we can invert the instantaneous distribution of potential vorticity to get all the dynamical information of the flow under certain boundary conditions. The invertibility property depends on the precise balance as-sumption used. In a nondivergent, barotropic fluid, the balanced flow and actual flow are identical. In the atmosphere, the balanced flow is an approximation to the total flow, the accuracy of which depends on the validity of scaling assumptions used to define the invertibility problem. By employing the invertibility principle, we can quantify different features in terms of the strength of their associated circulation and their ability to enhance the development of other features and separate individual perturbations of PV and study their relative importance. In particular, an isolated maximum of PV in the Northern Hemisphere will be associated with a minimum in geopotential, and a maximum in vorticity and static stability (and the opposite for a PV minimum). Perturbations of potential temperature at the lower boundary can be thought of as PV anomalies, with locally warm air associated with cyclonic vorticity and cold anomalies related to anticyclonic vorticity. This is a very general way to study the atmosphere and the dynamics of planetary waves and weather regimes. Typical values of PV range from 0.25 PVU to about 1 PVU in the troposphere, to several times those values in the stratosphere. A dynamical tropopause is often de-fined as the surface at 1.5 or 2 PVU. The high PV in stratosphere and low PV in troposphere are principally associated with the differences in stratifications between these two regions.
2.2
Characteristics of Persistent Cases from PV
perspective
Dole and Gordon (1983) and later work used the following criterion to identify no-ticeable persistent anomalies: positive (negative) cases were indentified at key points whenever the magnitude of the departure of latitude-scaled 500 MB height anomaly
(Zo in equation 1.1) from long term seasonal trend value exceeds positive (negative)
100 m for at least 10 consecutive days during the winter season. Though the link with dynamics is not clear, their work basically has clarified the problem quasi-objectively from the point of view of synoptic meteorologists: there are major regions (e.g. the North Pacific to the south of the Aleutian (PAC region) and the North Atlantic to the southeast of Greenland (the ATL region)) for the frequent occurrence of persistent anomalies that are strong and long-lived relative to anomalies in other regions. These favored regions also closely correspond with the major centers of large daily variance which is dominated by low-frequency contribution. But Dole and Gordon used only 500 MB geopotential height fields to characterize the flow, and they did not provide dynamical reason behind the criterion. Some important questions are: what is special about these favored regions? And what do they have to do with the persistence of the atmosphere? We are trying to find a dynamically consistent way to characterize the persistent features based on a more powerful and general dynamical reference point: the PV approach.
From the PV perspective, all dynamical information about the troposphere is contained in its PV distribution and boundary condition. Because the PV gradients are concentrated on the surface and tropopause, the most relevant and dynamically important field is the tropopause and surface potential temperature distribution, to understand the regional preference, we will look at Otrop and Osurface In terms of their phase relationship to one another of their distribution and evolution with the underlying orography. The key points used by Dole and Gordon for Atlantic and Pacific cases (500N, 250W for the Atlantic and 460N, 170OW for the Pacific) are both
some way the contrast between land and sea in the winter: the ocean with its high heat content is warmer than the continents. This contrast affects the atmosphere by controlling the evolution of surface temperature. Another prominent feature about the Pacific regions is the Rockies. Dole and his colleagues did not focus specifically on the difference on the Pacific and Atlantic cases, but the topographic forcing is generally regarded to be at least of equal importance to the thermal forcing in setting the planetary wave pattern of the troposphere. If the Pacific and Atlantic cases have a common dynamical origin, we have to answer why it is so. We also need to pay attention to those regions of the surface temperature field which are sensitive to the tendency toward persistence and their interactive relationship.
The three essential pieces of information from the PV perspective are:
1. the tropopause potential temperature which contains information of interior PV of the atmosphere;
2. the surface temperature which contains boundary PV information;
3. the distribution of land and sea, the position and magnitude of major moun-tains.
We will inspect the persistent anomaly cases of Neilley (1990) from 1980 to 1986 identified using the criterion of Dole and Gordon (1983), and study the relative phase relationship of the two potential temperature fields to one another and the underlying orography.
2.2.1
Pacific Positive Cases
The distribution of potential temperature on the tropopause, 0
trop, provides a concise way to view the dynamical information in the upper troposphere in the absence of appreciable interior potential vorticity gradient. When used in conjunction with near-surface temperature map, 0850, and interpreted making use of the invertibility
principle, they provide the most succinct and complete description of the balanced flow.
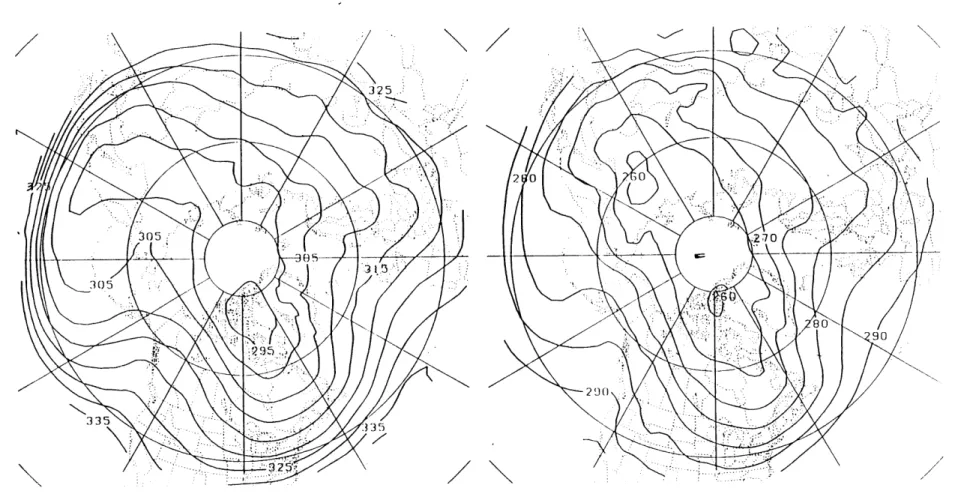
Fig. 2.1 shows the composite Otrop during all PAC(+) cases. The most pronounced feature is the broad ridge over the Pacific. Contours from 300K to 325K are concen-trated between 35N to 50N over the eastern Asia, and run north above the western Pacific. They are crowded between 50N to 65N forming a ridge over the central Pacific and run south again at the western Europe to become a trough over the U.S. Over the central Pacific between 35N to 55N, we can see much higher temperature than the same latitude over the continents. Notice the high potential temperature air over the central Pacific and low potential temperature air over the western north America and eastern Pacific, which is in phase with the thermal nature of the orography. The contours show a pronounced ridge adopting a shape parallel with the sealine.
Fig. 2.2 shows the composite 850 MB potential temperature distribution for all PAC(+) cases. Notice the broad warm ridge which is in phase with the tropopause potential temperature distribution and in phase with the land-sea distribution around the Pacific. The Otrop pattern is highly correlated with 0850 (which in turn is aware of the distribution of land and sea), a characteristic feature of this composite and many other individual PAC(+) events we have observed.
2.2.2
Pacific negative cases
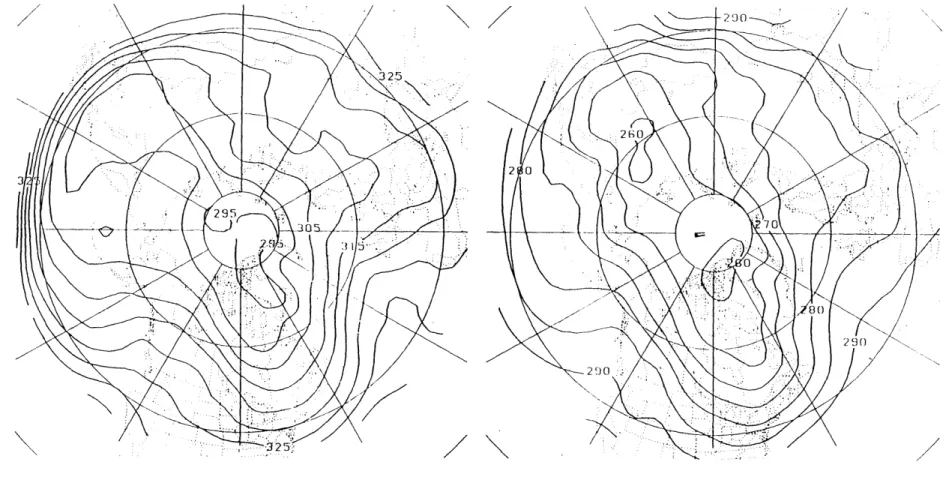
For the composite Otrop during all PAC(-) cases (Fig. 2.3), the isotherms between 310K and 330K are well pushed to the south over western and central Pacific and concentrated almost zonally between 35N to 45N. They have ridges over the eastern Pacific and western north America coast, and have a trough over eastern U.S. We observe the warm air sits around the coast and cold polar air sits over eastern north America and central Pacific, which is about 90 degrees out of phase with the thermal nature of the land sea thermal contrast.
The surface temperature during a PAC(-) compared to PAC(+) (Fig. 2.4) has the temperature contours over western Pacific being pushed southward, though not as much as the 0 trop. Therefore the ridge is over the eastern Pacific coast, and troughs over the Eastern Asia and eastern U.S. Carefully comparing the position of the ridge with Fig. 2.3, we can see almost in phase relationship between Otrop and Os850
Fig. 2.5, 2.6 show the 1000 MB geopotential height field during PAC cases. For PAC(-), an extensive and pronounced Aleutian low covers almost all of the Pacific. For PAC(+), the Aleutian low retreats westward and has less strength, a high geopotential center occurs over the central and eastern Pacific. This feature of the persistent anomalies is often emphasized in the literature.
2.2.3
Atlantic positive cases
For ATL(+) Fig. 2.7 shows between 35N to 70N isotherms have troughs over eastern North America and western Europe, and ridges over the Atlantic. Notice the con-centrated contours run along the coastlines and less concon-centrated warm air over the Atlantic and cold air over the Europe.
The 0850 (Fig. 2.8) of ATL(+) seems to be almost in phase with Otrop. We can see that ATL(+) and PAC(+) share many characteristics: 0850 and t,rop almost in phase, and both have warm air over the ocean and cold air over the continents.
2.2.4
Atlantic negative cases
For ATL(-) Fig. 2.9 shows almost zonal concentrated potential temperature contours over the U.S and Atlantic between 35N and 50N, and divergence of the contours over the coast of Europe.
Fig. 2.10 shows 850 MB potential temperature during a ATL(-) case. We see that the surface temperature contours have ridge over the ocean and part of the coast. The configuration is not as pronounced as the ATL(+) but the shift of the ridge to the coast is much less evident than for the PAC(-). if anything, the Otrop ridge is more to the east in the ATL(+).
2.2.5
1000 MB geopotential field
Fig. 2.11, 2.12 show the 1000 MB geopotential field during ATL cases, we see the reduced Icelandic low during positive cases, and the high over the eastern ocean. During the ATL(-) cases, we see the extensive Icelandic low over almost the whole
Atlantic.
2.3
Data Set and Methodology
The data used in this thesis are from the twice daily NMC Global Analysis available from NCAR on 144x73, 2.5 degree grids. The analyses are based on synoptic obser-vations (surface reports, aircraft obserobser-vations, soundings and satellite derived fields) taken at or near 0000 UTC and 1200 UTC and run through the Global Data Assim-ilation System as part of the analysis and forecast cycle for NMC's global spectral model. Data field of geopotential height, temperature, wind (u and v component) at mandatory levels of 1000 hPa, 850 hPa, 700 hPa, 500 hPa, 400 hPa, 300 hPa, 250 hPa, 200 hPa, 150 hPa, 100 hPa were used in this thesis. The winter season is defined
as the 90 day period from 1 December to 28 February.
Analysis of isentropic PV was performed on the data by linearly interpolating mandatory level data to the desired isentropic level. Stability, used in the calculation of PV, is calculated using a vertical finite difference of pressure over a 10 K thick layer. We compute the potential temperature fields from five day running mean NMC global analysis data. Tropopause potential temperature is derived by calculating PV using five day running mean of geopotential height, temperature, winds at all levels and then extropolating the potential temperature at Potential Vorticity surface of 2 PVU. Maps of PV on the 320 K potential temperature surface are calculated from instantaneous NMC data, which represent air parcel movement before low pass filtering.
2.4
Discussion
In efforts to understand the intraseasonal persistence of the midlatitude, different studies place emphasis on different aspects of the problem. Dole and Gordon's work identified planetary scale persistent features noticeable from weather maps. Here we have characterized them from a PV perspective arguing that the tropopause and 850 MB potential temperature fields are dynamically more revealing than the 500 MB
geopotential field. Based on this PV perspective we have shown how tropopause and surface potential temperature behave during persistent cases. We found that the PAC(+) and ATL(+) look the same in terms of 0trop and 0850 distributions with
their large scale ridge over the Pacific or Atlantic, and trough over the continents. They look like thermally equilibrated responses (Marshall and So (1990)) with 0850 and 0850 in phase with the land/sea contrast. However, the distributions of Ot,op and
0850 during PAC(-) and ATL(-) look very different, although Dole and his colleagues'
work emphasizes the similarities of the Pacific and Atlantic cases. PAC(-) has in phase Otrop and 0850 distribution with large trough over the Pacific and ridge over the western North America while the ATL(-) has for Otrop almost zonal concentrated isotherms over the Atlantic and divergence at the end of the strom track but for 0850 compatible with the land/sea contrast. A major difference between the Pacific region and the Atlantic region is the presence of the Rockies. The large scale orographic forcing gives a ridge over the mountain. This stationary forcing will be evident when the flow is not thermally equilibrated. This may explain the PAC(-) with its strong Aleutian low and ridge over the mountains. In the Atlantic, when the flow is not thermally equilibrated we tend to get more zonal flow with a strong Icelandic low. Thus, in terms of PV, the negative cases are very different and may have different mechanisms behind their persistence. To have a clearer physical picture about the cases, we will try now to quantitatively characterize Otrop and 0850 during persistent cases so that we have the PV information to explain the formation, maintenance and transition of these states.
Fig. 2.1: PAC(+) composite tropopause potential temperature using Neilley(1990)'s PAC(+) case periods.
Fig. 2.2: PAC(+) composite 850 MB potential temperature using Neilley(1990)'s PAC(+) case periods.
Fig. 2.3: PAC(-) composite tropopause potential temperature
using Neilley(1990)'s PAC(-) case periods. Fig. 2.4: PAC(-) composite 850 MB potential temperature using Neilley(1990)'s PAC(-) case periods.
Fig. 2.5: PAC(+) composite 1000 MB geopotential height
using Neilley(1990)'s PAC(+) case periods. Fig. 2.6: PAC(-) 'composite 1000 MB geopotential height using Neilley(1990)'s PAC(-) case periods.
Fig. 2.7: ATL(+) composite tropopause potential temperature using Neilley(1990)'s ATL(+) case periods.
Fig. 2.8: ATL(+) composite 850 MB potential temperature using Neilley(1990)'s ATL(+) case periods.
Fig. 2.9: ATI1(-) composite tropopause potential temperature using Neilley(1990)'s ATL(-) case periods.
Fig. 2.10: ATL(-) composite 850 MB potential temperature using Neilley(1990)'s ATL(-) case periods.
Fig. 2.11: ATL(+) composite 1000 MB geopotential height using Neilley(1990)'s ATL(+) case periods.
Fig. 2.12: ATL(-) composite 1000 MB geopotential height using Neilley(1990)'s ATL(-) case periods.
Chapter 3
Pacific Persistent Cases
In this chapter and the next one we will use more observational data to illustrate the characteristics of persistent anomalies from our PV perspective over the Pacific and the Atlantic respectively. An idealized picture of the potential temperature distribu-tion on the tropopause and 850 MB is proposed, from which a new criterion is found to identify cases from 15 year NMC global analysis data. Case studies are included to illustrate the PV evolution during positive and negative cases and their transition. Finally we composite PAC cases to show that the cases identified in this study are consistent with the characteristics of persistent anomalies in the literature.
3.1
Observations of PAC(+) and PAC(-)
3.1.1 PV distribution on isentropic surfaces
The 150 K potential temperature surface is characteristic of the atmosphere in the upper troposphere and lower stratosphere in midlatitude. Between the tropospheric and stratospheric air masses, PV contours are concentrated around the tropopause. The existence and cold nature of tropopause and lower stratosphere is the result of radiative-convective balance. The cold air mass moves along isentropic surface and strongly affect the underlying tropospheric weather systems. Because potential temperature and PV are both quasi-conserved quantities, the contours tell us the
location and movement of cold high potential vorticity stratospheric air.
Fig. 3.1 shows an instantaneous PV distribution on December 26 12Z, 1992 during a PAC(+) case: notice the in phase relation with the land/sea contrast. The planetary scale ridge of low PV air sits over central Pacific and high PV air sits over the Western Pacific and north America. South of this large scale ridge we see a small pool of isolated high PV air. During intense blocking cases, the blocking PV field may consist of more convoluted structure with a closed-off (or nearly closed) low PV pool north of the main PV gradient.
During a case of PAC(-), at Jan. 9 12Z, 1985 (Fig. 3.2), notice the phase shift with the underlying orography. Low PV air sits over the western north America; high PV air sits over the central Pacific and eastern north America. These phase relations of PV structure with orography are typical in all PAC(+) and PAC(-) cases we have studied.
3.1.2
Tropopause potential temperature distribution
Fig. 3.3 shows potential temperature distribution on tropopause on December 26 12Z, 1992 during a PAC(+) case. Notice the high potential temperature air over the central Pacific and low potential temperature air over the western north America and eastern Pacific, which is in phase with the thermal nature of the orography. Notice the wind on the tropopause is generally parallel with the isentropes.
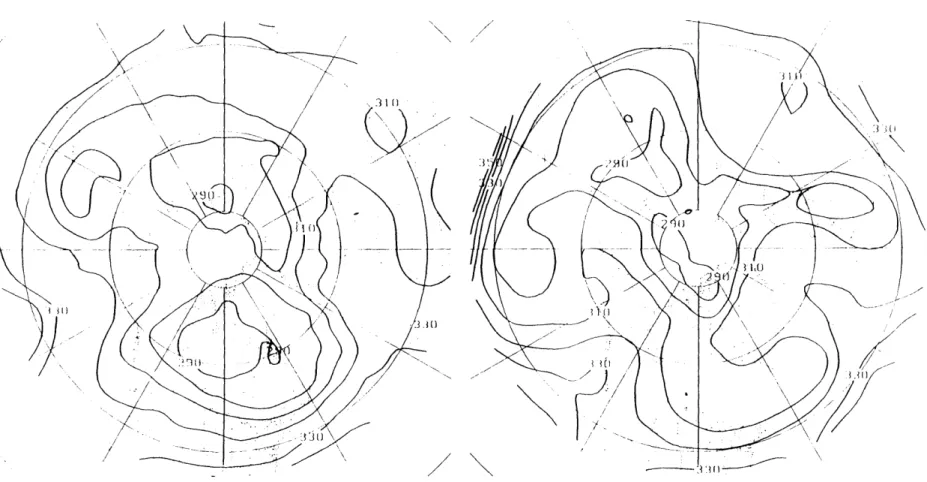
During a PAC(-) of Jan. 9 12Z, 1985 (Fig. 3.4), however, the warm tropical air sits over the eastern Pacific and western north America coast, and cold polar air sits over eastern north America and central Pacific, which is out of phase with the thermal nature of the orography.
3.1.3
Surface potential temperature distribution
Fig. 3.5 shows 850 MB potential temperature distribution on December 26 12Z, 1992 during a PAC(+). Notice the broad warm ridge which is in phase with the tropopause potential temperature distribution and in phase with the land-sea distribution around
the Pacific. The Otrop pattern is highly correlated with 0850 (which in turn is aware of the distribution of land and sea), a characteristic feature of this and many other persistent events we have observed.
The surface temperature of Jan. 9 12Z, 1985, during a PAC(-) (Fig. 3.6) has the temperature ridge over the eastern Pacific coast, and troughs over the Pacific and eastern U.S. Carefully comparing the position of the ridge with Fig. 3.4, we can see a slight eastward tilt (about 150 longitude in this case).
3.1.4
Cross sections
Fig. 3.7 shows longitudinal and height cross section of PV and potential temperature during a PAC(+): we clearly see an upwardly bowing tropopause over the central Pacific, along with a downward arch of isentropes in the lower troposphere, which has no eastward or westward phase shift with height. An opposite relationship of these two fields is seen to the east over the north America continent.
Fig. 3.8 is for the PAC(-) case: the high tropopause is now over the north America western coast, the low tropopause over central Pacific and Eastern U.S. The downward arch of isentropes are also below the upwardly bowing tropopause near the coast area, but notice the eastward tilt of the isentropes in the lower troposphere.
3.1.5
An idealized picture
From such observational data we see that 1) instantaneous field resembles averages over many cases, which shows that Pacific persistent anomalies are indeed lower frequency phenomena; 2) because the tropopause and 850 MB potential tempera-ture during PAC(+) and PAC(-) cases both have pronounced ridges and are almost in phase, their difference lies largely on the phase relationship with the underlying orography. To best characterize the distribution of 0850 and 0trop during the Pacific persistent cases, we choose two key points, of which A is located over the center of the ocean while B is located at the western continent. The idealized tropopause and 850 MB potential temperature distribution during the positive and negative cases are
shown in Fig. 3.9.
For PAC(+), both point A and B are in the ridge, which holds for both 0850 and
Otrop. For a negative case, point A is in the trough, point B is in the ridge. We see
here in the positive case, point A and B have little temperature difference, while for a negative case, the temperature of B is much higher than that of A.
3.2
Study of a 15 years of period
3.2.1
The criterion
Form our schematic picture ,we see that the two key points A,B are symmetric about the maximum temperature in a positive case , and because of the broad temperature ridge, their temperature difference is rather small. In a negative case, points A and B are respectively in the trough and ridge of the temperature wave, and their temperature difference is significant. The following criterion are motivated from the idealized picture and are used to study Fifteen years of NMC global analysis data to identify cases.
We choose two key longitude for PAC cases: A=170W, B=130W.
Fifteen winters (1980-1995) have been studied using NMC global analysis data by performing a five day running mean on all the data and computing the potential tem-perature fields on tropopause and 850 MB surfaces. We then average the tropopause and 850 MB potential temperature field from 350N to 500N. When the following criterion is satisfied continuously for at least 8 days we consider it to be a persistent case:
for PAC(+):
AO < 20C for both tropopause and 850 MB.
for PAC(-):
3.2.2
Cases identified
The following cases satisfy the above criterion: Pacific Positive: 81122712-82010512 84120700-84122900 85012600-85021012 88121912-88122700 89020100-89021500 89021800-89022600 90021212-90022100 90121100-90122912 92121612-93011612 93021712-93022600 94020512-94022500 94120312-94121500 Pacific Negative: 80122712-81012112 83010800-83012512 83021100-83022500 84010100-84011212 84012612-84020600 85010400-85011900 85121212-85122900 86010112-86011612 86011900-86013012 87013100-87021100 88021812-88022600 88120312-88121512 91011412-91012112
92010412-92012112 92012500-92020112 93012600-93020812 93122000-93122712 94121512-94122500 95011612-95021012 95021712-95022500
Neilley (1990) processed data from 1962 to 1987. Fig. 3.10 compares the case duration identified in this work with his result during the overlapping period 1980-1987. There are 3 PAC(+) (all of them correspond well with Neilley's 3 cases), 9 PAC(-) (4 of them have counterparts in Neilley's 7 cases, other two are obviously during a long case of Neilley). The very long case of Neilley (a 56 day PAC(-) case beginning Jan. 1983) may in part due to his rather sharp high frequency filter. Because our criterion is based on PV evolution and requires its persistence it is less possible to give such a long period. Because there are only five periods that are more than 30 days for the entire 25 years study of Neilley (1990), and from the idealized picture, for example, it is easy to subjectively relate the two cases during 1983 together, we have chosen the very strict criterion. Neilley (1990) only used one key point to find the anomaly from a geopotential height deviation of 100 m from climatology. The intention of this thesis is not to identify the same case durations as
Neilley did from existing data. We are trying to understand low frequency variability from the PV perspective. This comparison of cases reveals that our objective criterion is quite good in identifying cases, and the idealized picture is practically consistent and physically clear.
3.3
Case studies
In this section we study the winter of 92-93 in which there is a PAC(+) (92121612-93011612) followed by a PAC(-) (93012600-93020812), then by a PAC(+) (93021712-93022600). We will examine the PV information during the persistent periods and
their transition. The motivation here is to describe synoptic analysis from the PV perspective to illustrate the dynamical importance of potential temperature of tropopause (Fig. 3.11) and surface (Fig. 3.12) and their relative phase relation with the underlying land/sea contrast and orography in defining persistent features in the midlatitude troposphere. We will pay particular attention to persistence patterns and how synoptic systems interact with the low frequency anomalies and their transition. At the beginning of December 1992, 0850 shows that North America, the Eurasia
continent and west Pacific are covered by cold air with only a synoptic scale warm ridge over the east Pacific. Otrop has a ridge over the west coast of North America. On 320K isentropic surface waves move eastward passing the Pacific. On Dec. 11, notice that in the western Pacific there is a pronounced trough A of polar cold air stretching southward (Fig. 3.13). Notice the compression of east-west scale of the trough, whose strong southerly flow of air on its eastern flank brings tropical low PV air into the downstream ridge B so that ridge B amplifies meridionally for the next two days. On Dec. 15, another trough C approaches the ridge at the west end and helps bring more tropical air into the ridge. This reminds us of the eddy straining hypothesis and model experiments of Shutts (1983). As the result of the eddy reinforcement, a large scale upper level ridge establishes over the central Pacific well extending to the north. On Dec. 16, identified as the beginning of a PAC(+) case by our criterion, The two fields Otrop and O850 become in phase with one another and clearly assumes a configuration with large scale ridges over the Pacific and troughs over the continents. Sea surface pressure shows the confinement of the Aleutian low, and an extensive barotropic high pressure center locates over the Central Pacific (Fig. 3.14b), which is completely different from 10 days ago (Fig. 3.14a).
During the following month, this in-phase relationship lasts. Although we can see some small scale undulations, the planetary scale warm ridge effectively deviates the synoptic systems to the north. Thus the feature with warm tropical air over the ocean and cold air over the continents stays although there are small temporal and spatial scale systems embedded within it.
D moving west to east in the Pacific and compressing the ridge and cut off the low PV tropical air and the cold tropopause over west continent retreats eastward. The cold air at the surface gradually warms up too. The ridge of 0850 flatens eastward 3 days
later. The cold polar air masses are not strong enough to anchor to the western north America. Surface temperature over the western north America coast rises during this period. The zonal temperature gradient decreases and finally the surface temperature maximum moves eastward toward the north America coast.
With the decaying of the PAC (+), the struggle of the warm air over the ocean and cold air over the continent leads to the mixing of air masses and warm-up of the coast. By Jan. 26, we can see the two fields become in phase again with ridges over the coast, typical of PAC(-) Otrop and 0s50 distribution. If we say the interaction of the zonal flow with the Rockies chooses a preferred place for upper level ridges, the surface warm coast this time is in phase with the upper level and this state is to stay. The decaying stage of the positive case and the initialization of the negative case clarifies another important factors for persistence: for positive case the ability of warm tropical air to stay over the ocean and cold polar air to stay over the continents; for negative case, the climatological ridge implied by the Rockies and a surface warm coast. Quite obviously the warm air won't stay over central continents for long, the cold nature of the land will continuously absorb heat from the air. The warm ocean surface likewise will change the nature of cold air over the ocean. Therefore in the Northern winter, if we anticipate anomaly from climatology, the state characterized by warm over ocean and cold over land should be an natural attractor. The position of the Rockies at the west side of the continent coincide with the warming of the surface coast of the PAC(+) decaying stage, thus we anticipate longer than synoptic scale persistence of the negative cases.
0trop and 0850 have their ridges over the coast from about Jan. 26 to Feb.8, during
which both fields over the central and western Pacific undulate a lot. we can see that the warm ridge attracted by the Rockies effectively blocks the propagation of the synoptic systems over the Pacific Ocean. In an average sense, the stationary planetary waves due to the Rockies also implies a large scale trough above also implies a large
scale trough above the Aleutian region, which is why we tend to see an extensive Aleutian low in PAC(-) case (Fig. 3.14c).
At Feb. 11, a pronounced trough E on the eastern Pacific brings strong southerly flow into its downstream ridge extending it northward. And the Aleutian low becomes confined to the west (Fig. 3.14d). Another PAC(+) is initiated in a manner very similar to the beginning of PAC(+) in December.
From all cases we have studied, what is important here is not only that Otrop and
0850 ridges have a tendency of being in phase, but also they lock in phase with the orography. A positive case will occur whenever the ridges lock to the center of the Pacific. Strong troughs to the west of split jet helps to bring southerly tropical air into a ridge which helps the ridge to grow meridionally northward and may trigger a persistent case or lead to a block. For a PAC(+), Behind the tracer movement is the strong warm tropical air over the ocean and strong cold polar air over the western U.S.A and eastern Pacific and Asian Coast which is compatible with the thermal nature of the ground. A negative case will occur whenever ridges on Otrop and s850 lock to the western coast of the North America. A ridge over the Rockies is compatible with the interaction of climatological zonal flow with the Rockies.
3.4
Composite cases
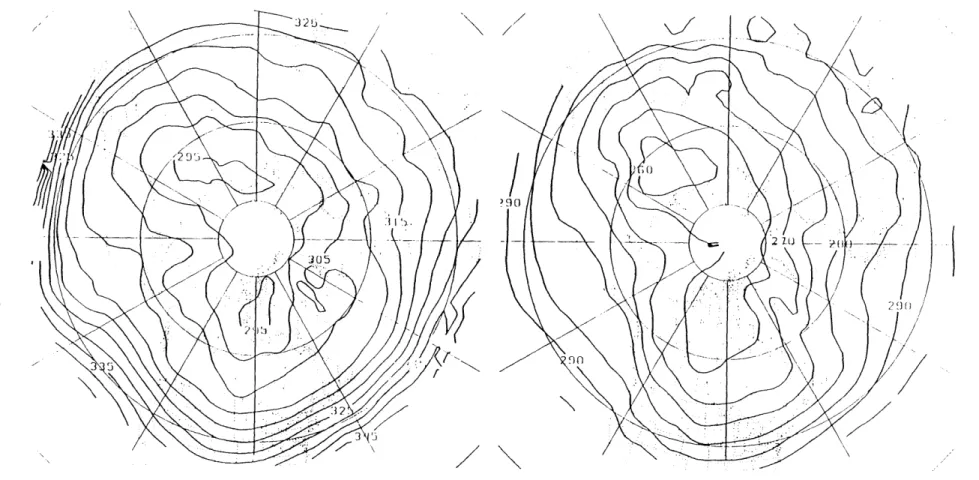
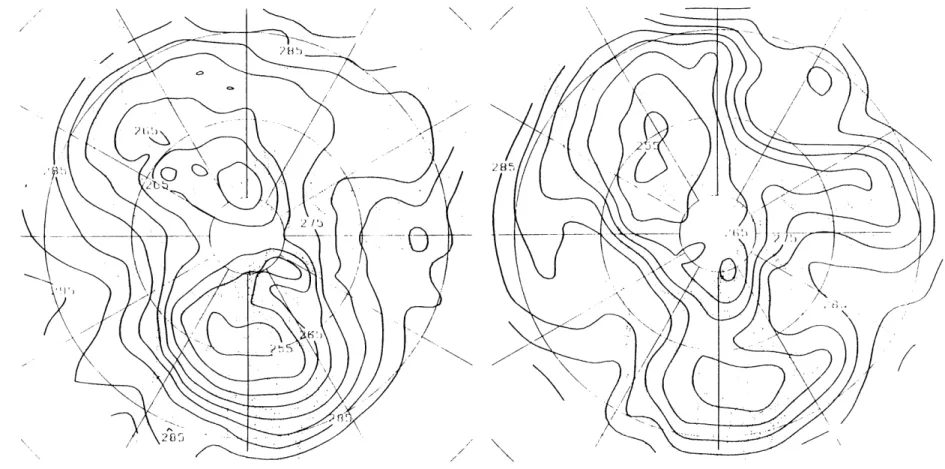
To show that the cases identified in this chapter are consistent with the Pacific persis-tent cases in the literature, I composite the cases by averaging all the cases identified with our criterion. Fig. 3.15 shows Ot,op and 0850 for PAC(+) composite case, we can see they are very much in phase with each other with planetary scale ridges over the Pacific and troughs over the land.
Fig. 3.16 shows Otrop and O850 for PAC(-) composite case, the ridges have moved eastward to be over the U.S North America coast, and they are still pretty much in phase with each other.
Fig. 3.17 shows the 1000 MB geopotential height field. For PAC(+), we see a high over the east Pacific, and a reduced Aleutian low, while for PAC(-), an extensive
Aleutian low covers the whole Pacific.
3.5
Summary
In this chapter, we used more detailed observational data to illustrate the character-istics of Pacific persistent anomalies from the PV perspective. From the analysis, we find that 1). The Pacific cases have duration from one week to less than one month, and are basically low frequency phenomena in the sense that daily maps resemble the case average. 2). Otrop and 0850 are almost in phase for both PAC(+) and PAC(-), their difference lies in their phase relationship with the underlying surface. 3). The PAC(+) cases have phase relation compatible with the land sea thermal contrast around the Pacific, because the warm air tends to stay over the ocean and cold air tends to stay over the land in the winter. In the two PAC(+) case studies, eddy rein-forcement mechanism helps to establish the upper level ridge in bringing in tropical low PV air northward into the ridge. The PAC(+) configuration effectively steers synoptic systems to the north of the ridge and maintains the persistence. The mixing of the air masses may result in the retreat of the cold air and lead to the decaying of the PAC(+) case. 4). The PAC(-) cases have phase relationship out of phase with the land sea thermal contrast, but the position of the ridge is compatible with the climatological flow implied by the Rockies. When the surface cold air is not strong, Otrop and s850 may become almost in phase with one another and the state may last for longer than synoptic systems. 5). As illustrated in the case studies, the two states may act as two natural attractors and the atmosphere oscillates between these two states regionally.
/ \ 15
Fig. 3.1: 921226 12Z 315 K1 isentropic surface Fig. 3.2: 850109 12Z 315 IK isentropic surface
Fig. 3.3: 921226 12Z tropopause potential temperature and wind during a PAC(+).
Fig. 3. 1: 850109 12Z tropopaiise pote ntial temperatell during a PAC(-).
Fig. 3.5: 921226 12Z 850 mb potential temperaiure
during a PAC(+).
Fig. 3.6: 850109 12Z 850 mib potential telmperature during a PAC(-).
405 395 385 S 375 365 355 345 330 320 310 300 295 290 285 280 275 270 260 250 60; -60 150 200 250 300 400 500 700 850 45;150
Fig. 3.7: 921226 12Z PV and potential temperature
cross section during a PAC(+).
-I] I I I I i I I 380 370 360 350 340 330 320 310 300 295 290 285 280 N. 275 270 55;I I I I -60 55; -60
Fig. 3.8: 850109 12Z PV and potential temperature
cross section during a PAC(-). 150 200 250 300 400 500 700 850 50;150 100 100 ----~\ ----\ ---i I i li i I I I I I i it
LO-)
/
Fig. 3.9: Idealized tropopause and 850 mb potential temperature distribution during (a) PAC(+) and (b) PAC(-) cases