HAL Id: inserm-00292181
https://www.hal.inserm.fr/inserm-00292181
Submitted on 3 Jul 2008HAL is a multi-disciplinary open access
archive for the deposit and dissemination of sci-entific research documents, whether they are pub-lished or not. The documents may come from teaching and research institutions in France or abroad, or from public or private research centers.
L’archive ouverte pluridisciplinaire HAL, est destinée au dépôt et à la diffusion de documents scientifiques de niveau recherche, publiés ou non, émanant des établissements d’enseignement et de recherche français ou étrangers, des laboratoires publics ou privés.
Physical Activity and Insulin Sensitivity. The RISC
Study.
Beverley Balkau, Leila Mhamdi, Jean-Michel Oppert, John Nolan, Alain
Golay, Francesca Porcellati, Markku Laakso, Ele Ferrannini
To cite this version:
Beverley Balkau, Leila Mhamdi, Jean-Michel Oppert, John Nolan, Alain Golay, et al.. Physical Activity and Insulin Sensitivity. The RISC Study.: Physical activity and insulin sensitivity. Diabetes, American Diabetes Association, 2008, 57, pp.2613-2618. �10.2337/db07-1605�. �inserm-00292181�
Physical Activity and Insulin Sensitivity.
The RISC Study
Beverley Balkau, PhD1
Leila Mhamdi, MSc1
Jean-Michel Oppert, MD, PhD2
John Nolan, MD, FRCPI3
Alain Golay, MD4
Francesca Porcellati, MD5
Markku Laakso, MD6
Ele Ferrannini, MD7
On behalf of the EGIR-RISC Study Group
Running title: Physical activity and insulin sensitivity
Author Affiliations:
1INSERM Unit 780, F-94807 Villejuif; Univ Paris-Sud, F-91405 Orsay, France (Dr Balkau, Ms
Mhamdi);
2Université Pierre et Marie Curie-Paris 6; Service de Nutrition, hôpital Pitié-Salpêtrière (AP-HP);
Centre de Recherche en Nutrition Humaine Ile-de-France (CRNH-IdF), France (Dr Oppert);33
3Metabolic Research Unit, Department of Endocrinology, Hospital 5, St James' Hospital, Trinity
College Dublin, Dublin 8, Ireland (Dr Nolan);
4Service of Therapeutic Education for Diabetes, Obesity and Chronic Diseases, Geneva University
Hospital, CH-1211 Geneva, Switzerland (Dr Golay);
5DiMI, University of Perugia, I-06126 Perugia, Italy (Dr Porcellati);
6Department of Medicine, Kuopio University Hospital, FIN-70210 Kuopio, Finland (Dr Laakso);
7Department of Internal Medicine and CNR Institute of Clinical Physiology, University of Pisa,
I-56100 Pisa, Italy (Dr Ferrannini).
Corresponding author:
B Balkau INSERM U780,
16 Avenue Paul Vaillant Couturier 94807 Villejuif cedex,
France
E-mail: [email protected] Telephone : +33 1 40 46 80 61 Fax : +33 1 47 26 94 54
Abstract
OBJECTIVE—Physical activity is a modifiable risk factor for type 2 diabetes, partly through its
action on insulin sensitivity. We report the relation between insulin sensitivity and physical activity measured by accelerometry.
RESEARCH DESIGN AND METHODS—This cross-sectional study is of 346 men and 455
women, aged 30 to 60 years, without cardiovascular disease and not treated by drugs for diabetes, hypertension, dyslipidaemia or obesity; they were recruited in 18 clinical centres from 13 European countries. Insulin sensitivity was measured by hyperinsulinaemic euglycaemic clamp. Physical activity was recorded by accelerometry for a median of six days. We studied the relationship of insulin sensitivity with total activity (number of counts/min), percent time spent sedentary, percent tine in light activity and activity intensity (whether the participant recorded some vigorous or some moderate activity).
RESULTS—In both men and women, total activity was associated with insulin sensitivity
(P < 0.0001). Time spent sedentary, in light activity, and activity intensity were also associated with insulin sensitivity (P < 0.0004/0.01; 0.002/0.03; 0.02/0.004 respectively for men/women), but lost significance once adjusted for total activity. Adjustment for confounders, such as adiposity,
attenuated the relations with total activity; there were no interactions with confounders. Even in the 25% most sedentary individuals, total activity was significantly associated with better insulin sensitivity (P < 0.0001)
CONCLUSIONS—Accumulated daily physical activity is a major determinant of insulin sensitivity. Neither time spent sedentary, in light-activity, nor bouts of moderate or vigorous activity impacted on insulin sensitivity independently of total activity.
Physical activity is now recognised as a major component of type 2 diabetes prevention: cohort studies have documented the lower risk of incident diabetes even for everyday activities such as walking (1,2). In a post hoc analysis of the Finnish Diabetes Prevention Study, walking for exercise for at least two and a half hours a week in comparison to less than one hour, was associated with a 63-69% lower risk of incident diabetes (3). Physical activity is a complex behaviour, characterised by intensity, duration and frequency (4). Various consensus groups recommend physically active lifestyles for adults, with an accumulation of at least 30 min of moderate-intensity aerobic physical activity five or more days a week or vigorous intensity aerobic physical activity for at least 20 min three days a week (5). Another important dimension is the time spent in sedentary occupations (6): in the Nurses Health Study, the number of hours spent sedentary was related with incident diabetes even after adjusting for total physical activity (7).
Physical activity may decrease the risk of diabetes by increasing insulin sensitivity (1). Insulin sensitivity has been shown to increase with physical activity, as assessed by questionnaire (8). Objective assessment of physical activity is now possible with unobtrusive accelerometer-based motion sensors (9,10).
The aim of this study was to describe the relationship between insulin sensitivity – as measured by the “gold standard” hyperinsulinaemic euglycaemic clamp – and habitual physical activity assessed by accelerometer: total activity, its intensity, and time spent in light and sedentary activities.
RESEARCH DESIGN AND METHODS
Participants and protocol. In 2002-2004, healthy adults aged 30-60 years, without diabetes,
hypertension or dyslipidaemia, were recruited into the European RISC (Relationship between Insulin Sensitivity and Cardiovascular risk) Study (11,12). Each centre had Ethics Committee approval and participants signed an informed consent.
Participants had a clinical examination, an oral glucose tolerance test and were fitted with an accelerometer, which they returned one week later when they presented for their hyperinsulinaemic euglycaemic clamp.
We report on 346 men and 455 women from 18 clinical centres, with data available on insulin sensitivity and accelerometer-measured physical activity.
Physical activity – accelerometer. Physical activity was measured objectively by a small
single-axis accelerometer, (ACTIGRAPH, AM7164-2.2 Computer Science and Applications Inc, Florida USA) (9,10). The acceleration signal was digitized with 10 samples per s, registered as counts over 1-min intervals. The accelerometer was worn for up to eight days, on a belt in the small of the back, from waking to going to bed except during water-based activities. We analysed
participants with at least three days of data, including days when the device was worn more than 10 hours; we assumed it was not worn if there were 60 consecutive min with no counts. Accelerometer data were processed with custom software developed for this project, using SAS Version 9. Data was checked for spurious recording – high counts >20,000 counts/min or repeated counts (13). Our software provided:
• total activity: average number of counts/min when accelerometer was worn;
• activity intensity group: participants were classed as having on any day when accelerometer was worn (a) some vigorous activity (>5724 counts/min for at least 10 consecutive min); (b) some moderate activity (1952-5724 counts/min for at least 10 consecutive min); (c) neither moderate nor vigorous activity on any day (9);
• percent time in light activity: not sedentary nor in moderate or vigorous activity.
Anthropometric measurements. On lightly clad participants we measured: body weight and
fat-free mass by bipodal bio-electric impedance (Tanita, TBF 300), height with a stadiometer, waist circumference with a horizontally placed tailor’s tape-measure mid-way between the lower costal margin and the iliac crests.
Smoking and alcohol. Never smokers, ex-smokers, current smokers, family history of diabetes,
menopause and alcohol intake were from a self-administered questionnaire.
Analytical methods. Local laboratory data were used for study inclusion criteria. Blood collected
was stored at -20°C and centrally analysed in Odense, Denmark: plasma glucose was measured by the Glucose Oxidase Technique (Roche Cobas Integra) and serum insulin by a specific
time-resolved fluroimunoassay (AutoDELFIATM Insulin kit, Wallac Oy, Turku, Finland).
Insulin sensitivity. A 2-hour hyperinsulinaemic euglycaemic clamp used a primed-continuous
infusion rate of 240 pmol.min-1.m-2 and a variable dextrose infusion adjusted every 5-10 min to
maintain the plasma glucose level within 0.8 mmol/l (±15%) of target glucose (4.5-5.5 mmol/l). The procedure was standardised across centres, with a written protocol and a video demonstration; data from the clamp were quality controlled centrally (11,12).
Insulin sensitivity is expressed as the ratio of the M value – averaged over the final 40 min of the clamp and normalised by fat-free mass to the mean plasma insulin (I) over the final 40 min of
Statistical analysis. SAS version 9 was used and statistical significance refers to P<0.05.
Logarithms of insulin sensitivity, fasting insulin, 2-hour plasma insulin and average number of counts/min worn were used in statistical testing; data are presented transformed to the original units.
Participant characteristics are described by means (SD) or %, and compared between genders
by t- and χ2 tests. MIXED linear models were used to predict insulin sensitivity, adjusted for age
classes (<40, 40-49, ≥ 50 years) and for recruitment centre as a random factor, and for gender when men and women were combined. Mean insulin sensitivity (95% confidence interval) is shown according to evenly spaced classes of total activity, percent time sedentary, and activity intensity, and tested for linear trends. Beta coefficients quantify the relations between insulin sensitivity and activity variables; additional adjustments were made for other activity variables and for potential confounding factors (BMI, waist, fasting glucose, alcohol intake, smoking, diabetes in family, menopause). The relations between insulin sensitivity and activity variables were linear, as
quadratic terms were significant; interactions with centre, age class and confounders were non-significant.
As gender interactions were non-significant, men and women were combined. Total activity and percent time sedentary were divided into quartiles, and the mean insulin sensitivity in the resulting 16 categories estimated and trend tests were used to compare across quartiles.
RESULTS
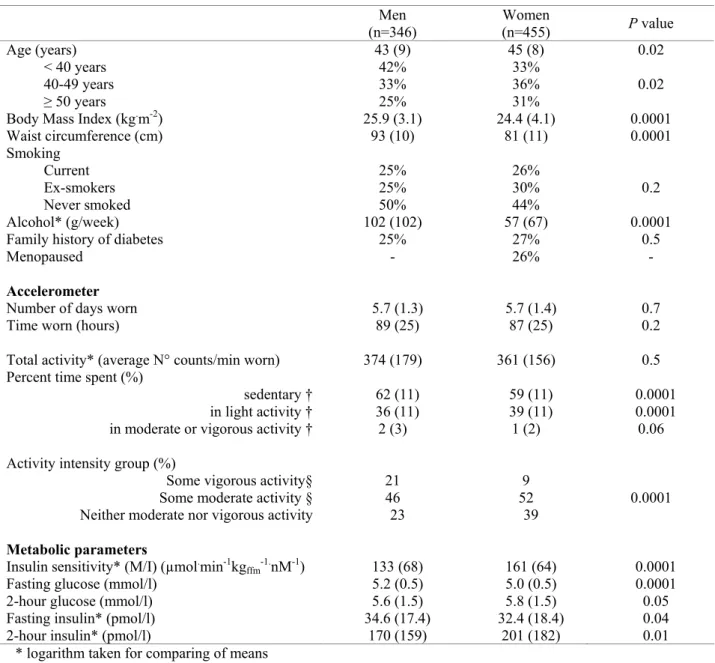
On average, men were 43 years, women 45 years, with BMI of 25.9 and 24.4 kg/m²
respectively (Table 1). The accelerometers were worn for a median of 6 days, a total of 89 hours in men, 87 hours in women. While total activity was similar between genders, men spent more time sedentary and in vigorous or moderate intensity activity than women (Table 1). Women spent more time than men in light intensity activity.
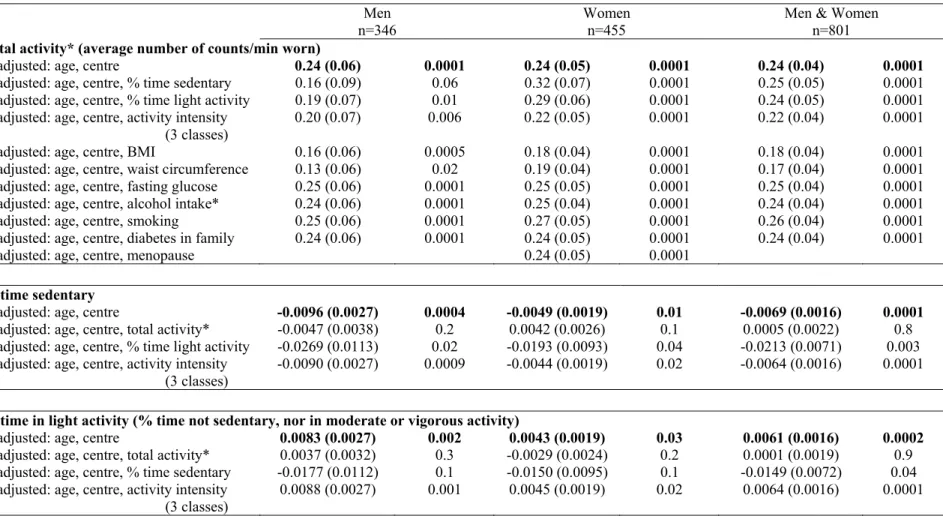
Insulin sensitivity was positively related with total activity, with percent time spent in light activity and with activity intensity, and negatively with time spent sedentary, in both men and women (Fig. 1, Table 2). However, after adjustment for total activity, the relations with insulin sensitivity were no longer significant for other activity variables. Adjustment for other potential confounding factors attenuated the relations between insulin sensitivity and total activity.
In the most sedentary quartile group, those with more than 68% time sedentary, there was a highly significant relation between insulin sensitivity and total activity (P trend <0.0001) (Fig. 2); for the other quartiles, there was a trend for a positive relation (P trend <0.1, 0.03, 0.2 respectively). In contrast, for a given quartile group of total activity, there was no significant trend between insulin sensitivity and time spent sedentary (P trend 0.2, 0.4, 0.9, 0.5 respectively).
DISCUSSION
This is the first study to report the relation between physical activity and insulin sensitivity using the “gold standard” method for determining insulin sensitivity and an objective measure of activity. Our results show that in both men and women, total physical activity is the key parameter positively related with insulin sensitivity: neither the percent time spent sedentary, in light-activity or the intensity of activity were associated with insulin sensitivity after adjusting for total activity. The percent time spent in moderate or vigorous activity was less than 2%, with 38% in light activity. Thus, it is the accumulation of physical activity, over the day, that appears to be the determinant of insulin sensitivity. The relation between total activity and insulin sensitivity remained after adjusting for overall (BMI) or abdominal adiposity (waist circumference) or other potential confounders.
In the Insulin Resistance Atherosclerosis Study, insulin sensitivity was quantified by the frequently sampled intravenous glucose tolerance test and physical activity by questionnaires; insulin sensitivity was positively associated with the frequency of vigorous physical activity and also with the energy expended in vigorous and non-vigorous activities (8). Other studies have measured physical activity objectively, but used surrogate measures of insulin sensitivity. Total activity as measured by accelerometer has been shown to be more strongly related to fasting insulin than either sedentary or moderately intense activity (10). In line with our results, after one-year follow-up in the ProActive trial, fasting insulin was significantly associated with change in total body movement, as measured by accelerometer (14). Fasting glucose has been shown to be related to total activity (counts/min worn), but not to time spent in sedentary, light or moderate to vigorous intensity activities (15); in contrast in the same population, 2-hr glucose was related to time spent in all three activities (16).
Among the strengths of the RISC study is the quality control procedure used to evaluate each clamp as it was completed in clinical centres (11). Only healthy individuals, from a wide spectrum
of countries, were selected for the study, with no drug treatment for diabetes, hypertension, lipids or obesity and a healthy clinical and biological profile.
We have used accelerometer decision rules written specifically for this project, and these rules may affect some of the results (13). We assumed that the accelerometer was not worn if 60 min was recorded with no activity, thus we may record longer percentages of sedentary time than other studies. For moderate or vigorous activity, we required at least 10 min of this activity, in line with current physical activity recommendations that refer to “bouts lasting 10 or more min”(5). Activity intensity may be underestimated as it has been studied in three groups: more than a third of the population recorded no moderate or vigorous activity, thus intensity is difficult to study as a continuous variable. Further, it has been reported that the accelerometer underestimates higher intensity movements (17).
Physical activity can influence insulin sensitivity in many ways, among which are: (a) enhancing both GLUT4-dependent and hypoxia-dependent glucose transport in skeletal muscle (18); (b) increasing skeletal muscle vascularization, mitochondrial neobiogenesis, and eventually, tissue mass (19); (c) repartitioning intracellular fat, thereby improving its utilisation (20); (d) fat mass loss. We and others have shown that aerobic exercise has a dose- and intensity-related effect to increase insulin signalling and glucose transporter content in skeletal muscle (21,22). Exercise training increases insulin-stimulated glucose disposal and GLUT-4 (SLC2A4) protein content in obese patients with type 2 diabetes (22). High levels of sedentary time produce the reverse effect. However, inactivity physiology may be qualitatively different to exercise physiology, with different cellular mechanisms (6). For example, experimental data from animals show that reducing low-intensity activity had a greater effect on skeletal muscle lipoprotein lipase regulation than adding intensive exercise (6). This parallels an Australian study which found that the negative effects on hyperinsulinaemia of 14 h per week of TV viewing, were similar to the beneficial effects of 2.5 hours of physical activity (walking and more vigorous activities) (23).
Our study emphasizes that activity has beneficial effects on insulin sensitivity. In this
population of men and women aged 30-60 years, the total accumulated activity was the important factor rather than the intensity of the activity. Even in those who spent most of their time sedentary, more movement during the day from work, household, commuting and also from leisure and
sporting activities, accumulated to exert a beneficial effect on insulin sensitivity, and so decrease the risk of type 2 diabetes and other diseases associated with insulin resistance. These results highlight the importance of even light activity, which should be taken into account in
recommendations for increasing the total amount of physical activity in the general population to prevent diabetes.
ACKNOWLEDGMENTS
The RISC Study received the EU grant QLG1-CT-2001-01252. Additional finances have been provided by AstraZeneca (Sweden). The EGIR group is supported by Merck Santé, France. L Mhamdi was financed in part by a grant from La Fondation de France. C Lange is thanked for her help with the accelerometer data.
RISC Investigators: RISC recruiting centres
Amsterdam, The Netherlands: R.J. Heine, J Dekker, S de Rooij, G Nijpels, W Boorsma Athens, Greece: A Mitrakou, S Tournis, K Kyriakopoulou, P Thomakos
Belgrade, Serbia: N Lalic, K Lalic, A Jotic, L Lukic, M Civcic
Dublin, Ireland: J Nolan, TP Yeow, M Murphy, C DeLong, G Neary, MP Colgan, M Hatunic Frankfurt, Germany: T Konrad, H Böhles, S Fuellert, F Baer, H Zuchhold
Geneva, Switzerland: A Golay, E. Harsch Bobbioni,V. Barthassat, V. Makoundou, TNO
Lehmann, T Merminod
Glasgow, Scotland: JR Petrie (now Dundee), C Perry, F Neary, C MacDougall, K Shields, L
Malcolm
Kuopio, Finland: M Laakso, U Salmenniemi, A Aura, R Raisanen, U Ruotsalainen, T
Sistonen, M Laitinen, H Saloranta
London, England: SW Coppack, N McIntosh, J Ross, L Pettersson, P Khadobaksh
Lyon, France: M Laville, F. Bonnet (now Rennes), A Brac de la Perriere, C Louche-Pelissier,
C Maitrepierre, J Peyrat, S Beltran, A Serusclat
Madrid, Spain: R. Gabriel, EM Sánchez, R. Carraro, A Friera, B. Novella Malmö, Sweden (1): P Nilsson, M Persson, G Östling, (2): O Melander, P Burri Milan, Italy: PM Piatti, LD Monti, E Setola, E Galluccio, F Minicucci, A Colleluori
Newcastle-upon-Tyne, England: M Walker, IM Ibrahim, M Jayapaul, D Carman, C Ryan, K
Short, Y McGrady, D Richardson
Odense, Denmark: H Beck-Nielsen, P Staehr, K Hojlund, V Vestergaard, C Olsen, L Hansen Perugia, Italy: GB Bolli, F Porcellati, C Fanelli, P Lucidi, F Calcinaro, A Saturni
Pisa, Italy: E Ferrannini, A Natali, E Muscelli, S Pinnola, M Kozakova Rome, Italy: G Mingrone, C Guidone, A Favuzzi. P Di Rocco
Vienna, Austria: C Anderwald, M Bischof, M Promintzer, M Krebs, M Mandl, A Hofer, A
Luger, W Waldhäusl, M Roden
Project Management Board: B Balkau (Villejuif, France), SW Coppack (London, England), JM
Dekker (Amsterdam, The Netherlands), E Ferrannini (Pisa, Italy), A Mari (Padova, Italy), A Natali (Pisa, Italy), M Walker (Newcastle, England)
Core laboratories and reading centres
Lipids Dublin, Ireland: P Gaffney, J Nolan, G Boran
Hormones Odense, Denmark: C Olsen, L Hansen, H Beck-Nielsen Albumin:creatinine Amsterdam, The Netherlands: A Kok, J Dekker Genetics Newcastle-upon-Tyne, England: S Patel, M Walker
Stable isotope laboratory Pisa, Italy: A Gastaldelli, D Ciociaro Ultrasound reading centre Pisa, Italy: M Kozakova
ECG reading, Villejuif, France: MT Guillanneuf Actigraph, Villejuif, France: B Balkau, L Mhamdi
Data Management Villejuif, France, Padova, and Pisa, Italy: B Balkau, A Mari, L Mhamdi,
L Landucci, S Hills, L Mota
Mathematical modelling and website management Padova, Italy: A Mari, G Pacini, C
Cavaggion
Coordinating office: Pisa, Italy: SA Hills, L Landucci. L Mota
Further information on the RISC Study and participating centres can be found on www.egir.org.
REFERENCES
1. Joen CY, Lokken RP, Hu FB, van Dam RM: Physical activity of moderate intensity and risk of
type 2 diabetes: a systematic review. Diabetes Care 30:744-752, 2007
2. Hu FB, Sigal RJ, Rich-Edwards JW, Colditz GA, Solomon CG, Willett WC, Speizer FE,
Manson JE: Walking compared with vigorous physical activity and risk of type 2 diabetes in women: a prospective study. JAMA 282:1433-1439, 1999
3. Laaksonen DE, Lindström J, Lakka TA, Eriksson JG, Niskanen L, Wikström K, Aunola S,
Keinänen-Kiukaanniemi S, Laakso M, Valle TT, Ilanne-Parikka P, Louheranta A, Hämäläinen H, Rastas M, Salminen V, Cepaitis Z, Hakumäki M, Kaikkonen H, Härkönen P, Sundvall J, Tuomilehto J, Uusitupa M; Finnish diabetes prevention study: Physical activity in the
prevention of type 2 diabetes: the Finnish diabetes prevention study. Diabetes 54:158-165, 2005
4. US Department of Health and Human Services (DHSS): Physical Activity and Health: A Report
of the Surgeon General. Atlanta, GA: US DHSS, Centers for Disease Control and Prevention, National Center for Chronic Disease Prevention and Health Promotion, 1996.
5. Haskell WL, Lee IM, Pate RR, Powell KE, Blair SN, Franklin BA, Macera CA, Heath GW,
Thompson PD, Bauman A: Physical Activity and Public Health. Updated Recommendation for Adults From the American College of Sports Medicine and the American Heart Association.
Med Sci Sports Exerc 39:1423-1434, 2007; Circulation 116:1081-1093, 2007
6. Hamilton MT, Hamilton DG, Zderic TW: Role of low energy expenditure and sitting in obesity,
metabolic syndrome, type 2 diabetes, and cardiovascular disease. Diabetes 56:2655-2667, 2007
7. Hu FB, Li TY, Colditz GA, Willett WC, Manson JE: Television watching and other sedentary
behaviors in relation to risk of obesity and type 2 diabetes mellitus in women. JAMA 289:1785-1791, 2003
8. Mayer-Davis EJ, D'Agostino R Jr, Karter AJ, Haffner SM, Rewers MJ, Saad M, Bergman RN:
Intensity and amount of physical activity in relation to insulin sensitivity: the Insulin Resistance Atherosclerosis Study. JAMA 279:669-674, 1998
9. Freedson PS, Melanson E, Sirard J: Calibration of the Computer Science and Applications, Inc.
accelerometer. Med Sci Sports Exerc 30:777-781, 1998
10. Ekelund U, Griffin SJ, Wareham NJ. Physical activity and metabolic risk in individuals with a
family history of type 2 diabetes. Diabetes Care 30:337-342, 2007
11. Hills SA, Balkau B, Coppack SW, Dekker JM, Mari A, Natali A, Walker M, Ferrannini E;
EGIR-RISC Study Group: The EGIR-RISC STUDY (The European group for the study of insulin resistance: relationship between insulin sensitivity and cardiovascular disease risk): I. Methodology and objectives. Diabetologia 47:566-570, 2004
12. Ferrannini E, Balkau B, Coppack SW, Dekker JM, Mari A, Nolan J, Walker M, Natali A,
Beck-Nielsen H; RISC Investigators: Insulin resistance, insulin response, and obesity as indicators of metabolic risk. J Clin Endocrinol Metab 92:2885-2892, 2007
13. Masse LC, Fuemmeler BF, Anderson CB, Matthews CE, Trost SG, Catellier CJ, Treuth M:
Accelerometer data reduction: a comparison of four reduction algorithms on select outcome variables. Med Sci Sports Exerc 37:S544-554, 2005
14. Simmons RK, Griffin SJ, Steele R, Wareham NJ, Ekelund U; On behalf of the ProActive
Research Team: Increasing overall physical activity and aerobic fitness is associated with improvements in metabolic risk: cohort analysis of the ProActive trial. Diabetologia in press 2008
15. Healy GN, Wijndaele K, Dunstan DW, Shaw JE, Salmon J, Zimmet PZ, Owen N: Objectively
measured sedentary time, physical activity, and metabolic risk: the Australian Diabetes, Obesity and Lifestyle Study (AusDiab). Diabetes Care 31:369-371, 2008
16. Healy GN, Dunstan DW, Salmon J, Cerin E, Shaw JE, Zimmet PZ, Owen N: Objectively
measured light-intensity physical activity is independently associated with 2-h plasma glucose.
17. Brage S, Wedderkopp N, Franks PW, Andersen LB, Froberg K. Reexamination of validity and
reliability of the CSA monitor in walking and running. Med Sci Sports Exerc. 2003;35:1447-1454.
18. Holloszy JO: Exercise-induced increase in muscle insulin sensitivity. J Appl Physiol
99:338-343, 2005
19. Joseph AM, Pilegaard H, Litvintsev A, Leick L, Hood DA: Control of gene expression and
mitochondrial biogenesis in the muscular adaptation to endurance exercise. Essays Biochem 42:13-29, 2006
20. Horowits JF: Exercise-induced alterations in muscle lipid metabolism improve insulin
sensitivity. Exerc Sport Sci Rev 35:192-196, 2007
21. Sriwijitkamol A, Coletta D, Wajcberg E, Balbontin G, Reyna S, Barrientes J, Eagan P,
Jenkinson C, Cersosimo E, DeFronzo R, Sakamoto K, Musi N: Effect of Acute Exercise on AMPK signalling in Skeletal Muscle of Subjects with Type 2 Diabetes. Diabetes 56:836-848, 2007
22. O'Gorman DJ, Karlsson HK, McQuaid S, Yousif O, Rahman Y, Gasparro D, Glund S, Chibalin
AV, Zierath JR, Nolan JJ: Exercise training increases insulin-stimulated glucose disposal and GLUT-4 (SLC2A4) protein content in patients with Type 2 diabetes. Diabetologia 49:2983-2992, 2006
23. Dunstan DW, Salmon J, Owen N, Armstrong T, Zimmet PZ, Welborn TA, Cameron AJ, Dwyer
T, Jolley D, Shaw JE; AusDiab Steering Committee: Associations of TV viewing and physical activity with the metabolic syndrome in Australian adults. Diabetologia 48:2254-2261, 2005
TABLE 1 Anthropometric, activity and metabolic characteristics: mean (SD) and percentages. The RISC Study Men Women (n=346) (n=455) P value Age (years) 43 (9) 45 (8) 0.02 < 40 years 42% 33% 40-49 years 33% 36% 0.02 ≥ 50 years 25% 31%
Body Mass Index (kg.m-2) 25.9 (3.1) 24.4 (4.1) 0.0001
Waist circumference (cm) 93 (10) 81 (11) 0.0001 Smoking Current 25% 26% Ex-smokers 25% 30% 0.2 Never smoked 50% 44% Alcohol* (g/week) 102 (102) 57 (67) 0.0001
Family history of diabetes 25% 27% 0.5
Menopaused - 26% -
Accelerometer
Number of days worn 5.7 (1.3) 5.7 (1.4) 0.7
Time worn (hours) 89 (25) 87 (25) 0.2
Total activity* (average N° counts/min worn) 374 (179) 361 (156) 0.5
Percent time spent (%)
sedentary † 62 (11) 59 (11) 0.0001
in light activity † 36 (11) 39 (11) 0.0001
in moderate or vigorous activity † 2 (3) 1 (2) 0.06
Activity intensity group (%)
Some vigorous activity§ 21 9
Some moderate activity § 46 52 0.0001
Neither moderate nor vigorous activity 23 39
Metabolic parameters
Insulin sensitivity* (M/I) (µmol.min-1kg
ffm-1.nM-1) 133 (68) 161 (64) 0.0001
Fasting glucose (mmol/l) 5.2 (0.5) 5.0 (0.5) 0.0001
2-hour glucose (mmol/l) 5.6 (1.5) 5.8 (1.5) 0.05
Fasting insulin* (pmol/l) 34.6 (17.4) 32.4 (18.4) 0.04
2-hour insulin* (pmol/l) 170 (159) 201 (182) 0.01
* logarithm taken for comparing of means
† vigorous activity: > 10 consecutive min with > 5724 counts/min; moderate activity: > 10 consecutive min with 1952 - 5724 counts/min; sedentary < 100 counts/min;
light activity: neither vigorous, moderate activity nor sedentary
TABLE 2 Relations between activity parameters and insulin sensitivity*: beta regression coefficients (standard errors) adjusted for age class and recruitment
centre, and for gender when men and women combined, and then additionally adjusted, one by one, for other activity parameters and potential confounders. The RISC Study.
Men Women Men & Women
n=346 n=455 n=801
Total activity* (average number of counts/min worn)
adjusted: age, centre 0.24 (0.06) 0.0001 0.24 (0.05) 0.0001 0.24 (0.04) 0.0001
adjusted: age, centre, % time sedentary 0.16 (0.09) 0.06 0.32 (0.07) 0.0001 0.25 (0.05) 0.0001 adjusted: age, centre, % time light activity 0.19 (0.07) 0.01 0.29 (0.06) 0.0001 0.24 (0.05) 0.0001 adjusted: age, centre, activity intensity
(3 classes)
0.20 (0.07) 0.006 0.22 (0.05) 0.0001 0.22 (0.04) 0.0001 adjusted: age, centre, BMI 0.16 (0.06) 0.0005 0.18 (0.04) 0.0001 0.18 (0.04) 0.0001 adjusted: age, centre, waist circumference 0.13 (0.06) 0.02 0.19 (0.04) 0.0001 0.17 (0.04) 0.0001 adjusted: age, centre, fasting glucose 0.25 (0.06) 0.0001 0.25 (0.05) 0.0001 0.25 (0.04) 0.0001 adjusted: age, centre, alcohol intake* 0.24 (0.06) 0.0001 0.25 (0.04) 0.0001 0.24 (0.04) 0.0001 adjusted: age, centre, smoking 0.25 (0.06) 0.0001 0.27 (0.05) 0.0001 0.26 (0.04) 0.0001 adjusted: age, centre, diabetes in family 0.24 (0.06) 0.0001 0.24 (0.05) 0.0001 0.24 (0.04) 0.0001 adjusted: age, centre, menopause 0.24 (0.05) 0.0001
% time sedentary
adjusted: age, centre -0.0096 (0.0027) 0.0004 -0.0049 (0.0019) 0.01 -0.0069 (0.0016) 0.0001
adjusted: age, centre, total activity* -0.0047 (0.0038) 0.2 0.0042 (0.0026) 0.1 0.0005 (0.0022) 0.8 adjusted: age, centre, % time light activity -0.0269 (0.0113) 0.02 -0.0193 (0.0093) 0.04 -0.0213 (0.0071) 0.003 adjusted: age, centre, activity intensity
(3 classes) -0.0090 (0.0027) 0.0009 -0.0044 (0.0019) 0.02 -0.0064 (0.0016) 0.0001
% time in light activity (% time not sedentary, nor in moderate or vigorous activity)
adjusted: age, centre 0.0083 (0.0027) 0.002 0.0043 (0.0019) 0.03 0.0061 (0.0016) 0.0002
adjusted: age, centre, total activity* 0.0037 (0.0032) 0.3 -0.0029 (0.0024) 0.2 0.0001 (0.0019) 0.9 adjusted: age, centre, % time sedentary -0.0177 (0.0112) 0.1 -0.0150 (0.0095) 0.1 -0.0149 (0.0072) 0.04 adjusted: age, centre, activity intensity
Activity intensity (in three classes, some vigorous, some moderate, neither moderate nor vigorous activity) some moderate vs neither moderate nor
vigorous some vigorous vs neither moderate nor vigorous
adjusted: age, centre
0.070 (0.067) 0.22 (0.08) 0.02 0.091 (0.042) 0.23 (0.07) 0.004 0.083 (0.036) 0.22 (0.05) 0.004
adjusted: age, centre, total activity * 0.017 (0.069)
0.088 (0.092) 0.6
0.028 (0.043)
0.11 (0.08) 0.4
0.022 (0.038)
0.085 (0.057) 0.3 adjusted: age, centre, % time sedentary 0.055 (0.066)
0.19 (0.08) 0.04 0.081 (0.042) 0.22 (0.07) 0.006 0.070 (0.036) 0.20 (0.05) 0 adjusted: age, centre, % time light activity 0.064 (0.066)
0.23 (0.08) 0.01 0.088 (0.041) 0.24 (0.07) 0.003 0.078 (0.036) 0.23 (0.05) 0.0001 * logarithm of variable
Figure legends
FIG. 1. Mean insulin sensitivity (95% confidence interval), adjusted for age and clinical
recruitment centre, and characteristics of physical activity measured by accelerometer in men and women, according to: mean number of counts/min that the accelerometer was worn (A), by percent sedentary time (B) and by groups according to some moderate and some vigorous intensity activity (C). The RISC Study.
FIG. 2. Mean insulin sensitivity (age, sex and recruitment centre adjusted) and physical activity
measured by accelerometer (in men and women combined) by quartiles of average number of counts/min worn and quartiles of percent time sedentary. Table gives the distribution of participants according to total-activity and time-sedentary quartiles. The RISC Study.
RISC 30/06/2008 19/22 60 80 100 120 140 160 180 200 220 men, p trend=0.0001 women, p trend=0.0001 men 11% 27% 31% 13% 6% 12% women 11% 29% 27% 20% 8% 6% 200 300 400 500 600 average number of counts per minute worn
A
Insulin sensitivity, M/I
RISC 30/06/2008 20/22 60 80 100 120 140 160 180 200 220 men, p trend=0.0004 women, p trend=0.005 men 5% 8% 8% 18% 21% 16% 12% 11% women 9% 10% 16% 18% 16% 13% 8% 9% 45 50 55 60 65 70 75 percent of time sedentary
B
Insulin sensitivity, M/I
RISC 30/06/2008 21/22 60 80 100 120 140 160 180 200 220 men, p trend=0.007 women, p trend=0.0009 men 33% 46% 21% women 38% 52% 10%
no moderate some some
or vigorous activity moderate activity vigorous activity
C
Insulin sensitivity, M/I
(µmol min-1 kgffm-1 nM-1)
RISC 30/06/2008 22/22 80 100 120 140 160 180 4 3 2 1 1 2 3 4
quartiles: percent time sedentary
quartiles: average counts per minute 53% 61% 68% 341 428 261 13% Insulin sensitivity: M/I (µmol.min-1kgffm-1nM-1)
distribution of participants according to total activity and sedentarity
13% 6% 4% 2% >428 8% 7% 6% 2% 341-428 3% 9% 8% 5% 261-341 1% 2% 6% 16% <261 quartiles: average counts per minute worn <53% 53-61% 61-68% > 68%