HAL Id: cea-03014550
https://hal-cea.archives-ouvertes.fr/cea-03014550
Submitted on 19 Nov 2020
HAL is a multi-disciplinary open access archive for the deposit and dissemination of sci-entific research documents, whether they are pub-lished or not. The documents may come from teaching and research institutions in France or abroad, or from public or private research centers.
L’archive ouverte pluridisciplinaire HAL, est destinée au dépôt et à la diffusion de documents scientifiques de niveau recherche, publiés ou non, émanant des établissements d’enseignement et de recherche français ou étrangers, des laboratoires publics ou privés.
Steady-State Electrocatalytic Activity Evaluation with
the Redox Competition Mode of Scanning
Electrochemical Microscopy: A Gold Probe and a
Boron-Doped Diamond Substrate
Olivier Henrotte, Alice Boudet, Ndrina Limani, Philippe Bergonzo, Bacem
Zribi, Emmanuel Scorsone, Bruno Jousselme, Renaud Cornut
To cite this version:
Olivier Henrotte, Alice Boudet, Ndrina Limani, Philippe Bergonzo, Bacem Zribi, et al.. Steady-State Electrocatalytic Activity Evaluation with the Redox Competition Mode of Scanning Electrochemical Microscopy: A Gold Probe and a Boron-Doped Diamond Substrate. ChemElectroChem, Weinheim : Wiley-VCH, 2020, 7 (22), pp.4633-4640. �10.1002/celc.202001088�. �cea-03014550�
1
Steady state electrocatalytic activity
1
evaluation with the redox competition
2
mode of SECM: the interests of a gold
3
probe and a boron doped diamond
4
substrate
5
Olivier Henrotte [a], Alice Boudet [a], Ndrina Limani [a], Philippe Bergonzo [c], Bacem Zribi [b], Emmanuel
6
Scorsone [b], Bruno Jousselme [a] and Renaud Cornut [a]
7 8
[a] Dr. O. Henrotte, A. Boudet, N. Limani, Dr. B. Jousselme, Dr. R. Cornut 9
Université Paris-Saclay, CEA, CNRS, NIMBE, LICSEN 10
CEA Saclay 91191, Gif-sur-Yvette Cedex (France) 11
12
[b] Dr. B. Zribi, Dr. E. Scorsone 13
Diamond Sensors Laboratory, LIST, CEA 14
CEA Saclay 91191, Gif-sur-Yvette Cedex (France) 15
16
[c] Dr. P. Bergonzo 17
Formerly [b], now at: 18
Department of Electronic and Electrical Engineering, University College London
19
17-19 Gordon Street, London, WC1H 0AH, United Kingdom
20 21
Abstract
22
In the current context of energetic transition, investigations of alternative complex systems require 23
tools as scanning electrochemical microscopy (SECM) offering interesting opportunities as an 24
electroanalytical technique to evaluate innovative catalysts. Herein, we demonstrate how a judicious 25
choice of probe and substrate materials opens up improved performances to achieve steady state 26
measurements for oxygen reduction reaction (ORR) catalytic activity detection through the redox 27
competition scanning electrochemical microscopy (RC-SECM). 28
2
On the probe side, we show that using gold enhances the stability of the local oxygen concentration 29
detection in comparison to the regularly used platinum one. On the substrate side, we evaluate boron 30
doped diamond as an appealing alternative to classical support substrate, that shows a low ORR 31
activity, high stability and very good reusability. 32
This work introduces an alternative approach for quantitative measurements with SECM, improving 33
measurement easiness, comfort and reproducibility, thus paving the way towards standardized 34
benchmarking and numerical simulation-based parameter extraction. 35
36
Introduction
37
The global energetic transition requires innovative tools enabling the evaluation of alternative 38
materials and systems as candidates to perform energy. Fuel cells, and proton exchange membranes, 39
for instance, are envisioned to play a key role as an efficient alternative technology. They are 40
considered worldwide with high interests and could be easily adopted. However, the variety of 41
catalysts presently under consideration by the community generates a high demand to enable their 42
comparative characterization. Improved tools would help in their discrimination[1,2]. Presently
43
characterization methods are the limiting part of innovation and improvements, particularly when 44
active carbon based nanomaterials are concerned[3]. During the past decades, local probe techniques,
45
such as scanning electrochemical microscopy (SECM) have made great progress. SECM already 46
provides impressive results in the investigation of local electrochemical properties[4]. SECM is an
47
electroanalytical tool that consists of a four-electrodes setup: two working electrodes (WE), namely a 48
micrometric probe as an electrochemical sensor and a substrate to polarize the investigated material, 49
a counter electrode (CE) and a reference electrode (RE). A potential can be applied on both the probe 50
and the substrate while the probe is moved in the close vicinity of the substrate. The versatility of the 51
technique allows it to be used in many different fields such as electrocatalysis[5,6], corrosion[7],
photo-52
electrochemistry[8] or even DNA detection[9] or archaeological remains investigations[10].
53
In the global research context of energetic transition, SECM has been used for the investigation of 54
materials involved in energy related systems (batteries[11], solar cells[12], supercapacitors[13], etc…), in
55
particular for fuel cells (e.g. direct methanol fuel cell[14], polymer electrolyte fuel cell[15], proton
56
exchange membrane fuel cell (PEMFC)[16–18], etc…). The investigations here mainly focus on hydrogen
57
evolution reaction (HER)[19] and more particularly on oxygen reduction reaction (ORR)[6,16,20] due to its
58
slow kinetics, which constitutes a key point regarding the adoption of fuel cells at a large scale. 59
3
Regarding electrocatalytic activity assessment, the redox competition (RC) mode of SECM, introduced 60
by W. Schuhmann’s group in 2006, is a recognised reference protocol[21]. It consists in polarizing the
61
probe and the substrate in such a way that the same reaction occurs on both sides: the probe then 62
evaluates the local reactant depletion due to its consumption by the electroactive sample (as shown 63
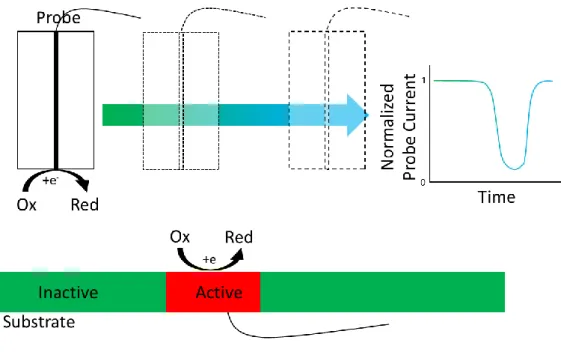
in Figure 1). A scan over the surface thus reveals the local activity variations. 64
65
Figure 1. Scheme of the RC-SECM mode.
66
RC mode has already been used to visualize the cell breathing[22], to understand corrosion mechanism
67
on CrN film[23], to study the consumption of oxygen from zinc oxide formation[24] or even to determine
68
more accurately enzymatic kinetics[25] thanks to previous modelling studies of such a system[26]. For
69
ORR catalysts, it operates in such a way that the scanning electrode is used as a probe of the local O2
70
concentration[18,21,27]. However, the use of the technique still remains mostly limited to the SECM
71
community, where studies are usually proof of concepts. We foresee that the expansion of the 72
technique to quantitative studies could provide better knowledge of many catalysts that are currently 73
being investigated within the context of the energetic transition. In fact SECM, and RC-SECM in 74
particular, are presently underused by the community, in comparison to the benefits the technique 75
can provide, namely its high resolution[28,29].
76
The lack of a comfortable configuration that would enable better ease and reproducibility, and 77
particularly in complex conditions such as in acidic media to be compatible with PEMFC technology, is 78
a key obstacle to the development of the RC mode approach. Herein, we show how the choice of the 79
probe and substrate materials can help to stabilize the experimental configuration and enable steady 80
state measurements while scanning the surface. 81
4
Up to now, Pt microelectrodes are the most frequently used for the RC mode[18,21,27,30], which is a
82
rational choice considering the established electrocatalytic activity of this material towards ORR. 83
However, Pt presents some drawbacks, for instance measurement instabilities are common at high 84
probe current densities, and further it displays a high sensitivity to impurities that might be present in 85
the solution. Subsequent alternatives such as the use of potential pulses[31] or high scan speeds[27] are
86
required, but that may significantly hinder quantitative studies. On the other hand, gold as a probe 87
metal has been used for other SECM measurements[16], but –to the best of our knowledge- not for ORR
88
detection. Here, we show that the low catalytic activity of gold is not an issue for ORR detection, which 89
makes it suitable for studying ORR in RC mode, and even in acidic media. 90
In theory, the high sensitivity of the RC mode enables the evaluation of very low catalytic activities, 91
however in this case, the substrate activity is likely to enter in competition with the catalytic 92
material[32]. Overall ORR studies are usually performed using glassy carbon (GC) substrate[30,33,34]. Boron
93
doped diamond (BDD) catalytic activity toward ORR has been investigated[35], as other carbon based
94
materials[36]. Furthermore, BDD has been used in SECM as a probe[37] or a studied material[35,38], but
95
not as substrate for ORR catalytic activity determination. BDD has shown higher overpotential for ORR, 96
higher stability and lower H2O2 production in acidic media compared to other carbon based
97
substrates[39]. Here we demonstrate that BDD is an interesting alternative to standard carbon based
98
substrates. We compared it to a GC substrate, due to its high representation in the literature, and a Si-99
wafer substrate covered with gold, as it is easy to produce, with good reproducibility and permits to 100
achieve highly flat surface. The catalyst used to illustrate the potentiality of the new setup is a noble-101
metal free material based on carbon nanotubes (CNT) annealed with cobalt and nitrogen precursors[40].
102
Experimental
103
Materials
104
All chemicals and solvents of research grade were purchased in the highest purity from Sigma Aldrich 105
and used as received. All gases (nitrogen, oxygen) were of 99.995% purity. Commercial grade NC3100 106
(purity >95%) multi-wall carbon nanotubes were obtained from Nanocyl (Belgium). 107
BDD substrate preparation
108
BDD was grown onto highly doped 4 inches silicon substrates by microwave plasma enhanced chemical 109
vapor deposition (MPECVD) technique in a Seki Diamond AX6500 diamond growth reactor in a 110
hydrogen plasma containing 1% methane as the source of carbon and trimethylboron as dopant. The 111
resulting boron doping level is approximately 2x1021 cm-3 as determined by secondary ion mass
5
spectrometry measurements. The polycrystalline diamond film obtained is approximately 1 micron 113
thick. 114
BDD substrate cleaning process
115
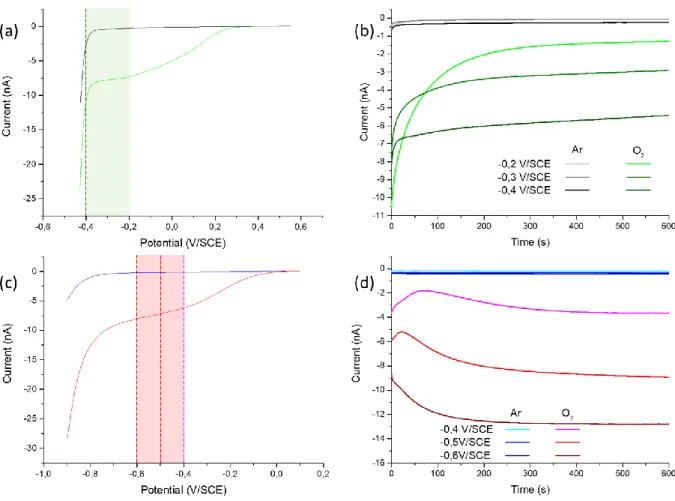
BDD substrates were immerged into a piranha solution during 30 minutes and then in pure H2SO4 at
116
300°C for 30 minutes. Afterward, KNO3 was added into the solution until a yellow coloration started to
117
appear and the substrates stayed still 30 minutes more in the 300°C solution. Then, the substrates 118
were rinsed into a 300°C pure H2SO4 solution during 10 minutes and finally rinsed with distilled water.
119
In the case there was any doubt of catalyst residual traces on the substrate, a micro-wave hydrogen 120
plasma exposure of the BDD surface, at a temperature of 600°C, was used to perform a complete 121
reclaim of the BDD native surface. 122
Gold substrate preparation
123
Gold substrates were obtained by vacuum evaporation in a Balzers BAK 600 evaporator: a thin 124
interlayer of chromium (to enhance gold adhesion on glass) and pure gold (99.99 % from Williams 125
Advanced Materials) were evaporated at room temperature on silicium wafers. Prior to evaporation, 126
the silicium wafers were rinsed 10 min under ultrasonication in water, ethanol and acetone 127
successively. The thickness of the deposited layers was 3 nm of chromium and 30 nm of gold monitored 128
in-situ by using a quartz crystal microbalance. 129
Catalyst preparation
130
The catalyst was prepared as described previously[40]. Briefly, Co(NO
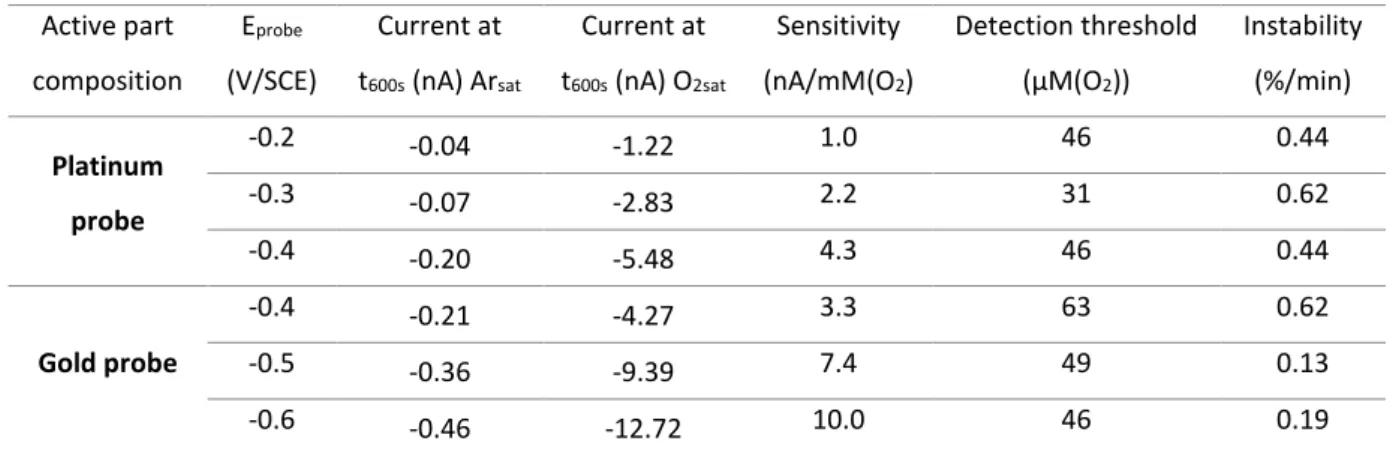
3)2.6H2O, multi-wall carbon
131
nanotubes (MWNTs) and triazolopyridine (TAPy) were mixed in ethanol and sonicated for 30 minutes. 132
Ethanol was removed under low pressure and the black Co-TAPy/CNTs powder was pyrolyzed at 950°C 133
during 2h under argon. This catalyst will be called Co-N-NTC. 134
Catalyst deposition
135
The catalyst ink was prepared by dispersing Co-N-NTC powder (20 mg) with 5% in wt of D-520 Nafion 136
in ethanol (1 mL) under sonication (30 min) with a cup-horn coupled with a Vibra-Cell (VCX 130 PB 137
from Sonics Material). Afterwards, the total volume is increased with ethanol to 2 mL and the process 138
is repeated. The same process continues by increasing the total volume to 5/10/20/50/100/200 mL to 139
obtain a catalyst ink of 0.1 g.L-1.
140
The catalyst spot was obtained by two methods. The first one consists of dropping 2 mL of the catalytic 141
ink onto the substrate heated at a temperature of 100°C with a micropipette. The second method uses 142
the ExactaCoat apparatus from Sono-Tek to pulverize the solution onto the substrate. A mask with 143
6
micropatterns (from Micron Laser Technology) was used to obtain a controlled square spot in size and 144
volume of solution deposited. 145
Instrumentation
146
AFM and SEM measurements
147
AFM images were performed on a Veeco Dimension 3100 equipped with a Nanoscope IIIa controller 148
and analysed with the software Gwyddion. SEM images were recorded with a Hitachi S-4500 scanning 149
electron microscope. 150
Electrochemical measurements
151
Electrochemical measurements were performed in sulfuric acid (Sigma Aldrich). The gold and platinum 152
microelectrodes from Sensolytics had an active radius of 5 microns and a RG (the ratio between the 153
inactive part radius and the active part radius of the probe) of 30. SECM experiments were performed 154
on a modified M470 SECM Workstation from Bio-Logic Science Instruments. A four-electrode setup 155
was used for the SECM experiments. It involved a platinum or a gold microdisk as first working 156
electrode, a GC, a gold or a BDD substrate as second working electrode, a saturated calomel electrode 157
(SCE) as reference and a net made of platinum wires as counter electrode. Both reference and counter 158
electrodes are placed in sintered guards to avoid direct contact between the analysed solution, the 159
reference and the counter electrodes. The probe-substrate distance was evaluated by approaching the 160
probe in the vicinity of the area of interest, somewhere without catalyst, and by letting the substrate 161
at open circuit potential (OCP). In this case a negative feedback was obtained, and a comparison with 162
theory provides the relationship between the probe position and the probe-substrate distance[41,42].
163
Unless mentioned, the analysis of the ORR activity was made in H2SO4 0.1 M solution. The probe was
164
stabilized 300 s before each measurement. 165
Results & discussion
166
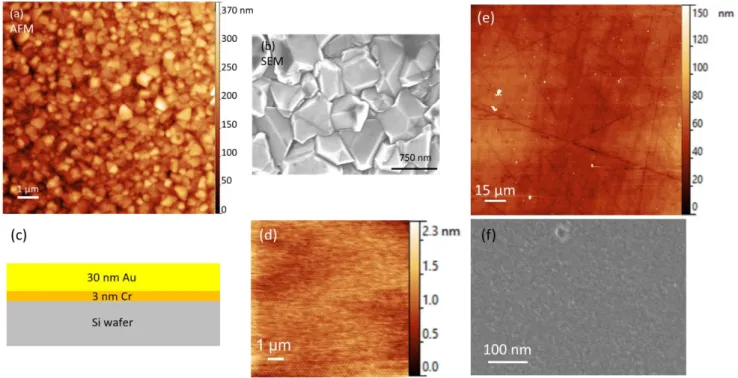
The working electrodes are central to the SECM technique. Improving both of them to specific 167
demands allows progresses in the quality of measurements. First, in order to investigate the first 168
working electrode, i.e. the probe, a linear sweep voltammetry (LSV) is performed from OCP up to the 169
solvent reduction signal, in Ar saturated solution and O2 saturated solution. At this step, the probe is
170
put in solution without the substrate to avoid any interaction. 171
7 172
Figure 2. (a) LSV at the platinum probe from 0.55 to -0.43 V/SCE with a 10 mV/s scan rate. (b) CA at the platinum probe at
173
different potentials (-0.2, -0.3 and -0.4 V/SCE). Black curves for Ar saturated solution and green curves for O2 saturated solution
174
in (a & b). (c) LSV at the gold probe from 0.1 to -0.9 V/SCE with a 10 mV/s scan rate. (d) CA at the gold probe at different
175
potentials (-0.4, -0.5 and -0.6 V/SCE). Blue curves for Ar saturated solution and red curves for O2 saturated solution in (c & d).
176
All measurements were made in H2SO4 0.1M, rT = 5 µm and RG = 30 for both probes.
177
As shown in Figure 2.a, a well-defined plateau is observed between -0.2 to -0.4 V/SCE for the ORR at 178
the platinum probe, illustrated by the green bar. Several potentials of this plateau are then tested by 179
chronoamperometry (CA). Each potential is applied for 600 seconds, in order to investigate the stability 180
of the measurement. The probe is polished and cleaned between each measurement and the 181
procedure is repeated several times in the O2 saturated solution. The results presented Figure 2.b show
182
the currents measured at -0.2, -0.3 and -0.4 V/SCE. For the three potentials, an exponential loss of 183
current is observed, followed by a stabilization of the slope to a non 0 value. This behaviour is not the 184
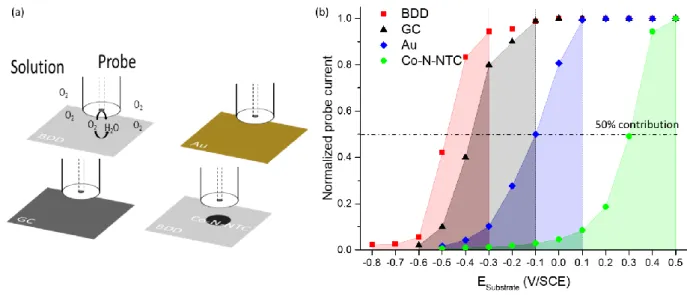
one expected from a well-defined diffusion plateau as observed on the CV. Furthermore, the current 185
variation during the first 200 seconds is not exclusively due to the establishment of the diffusion profile 186
in the vicinity of the probe, as this is a process that has time constant of typically seconds[43]. It is also
187
related to the evolution of platinum surface states, with possibly some contamination due to side 188
reactions. Furthermore, the current densities are not the same along the probe surface increasing the 189
complexity of such phenomenon. In any case, the observation is in accordance with what is observed 190
8
in the literature[21]. In any case, the important element for SECM imaging is to have a steady-state
191
current at the probe. The Pt probe current was the most stabilized after 300s with a linear loss of 192
current. After this stabilization step, the sensitivity, the detection threshold and the instability can be 193
then evaluated. These values are shown in Table 1. We evaluated the theoretical sensitivity by using 194
the equation of the current at a diffusion plateau[44]. In the equation 1, n is the number of electrons
195
exchanged (4 in the case of a complete O2 reduction), F is the Faraday constant, D0 is the diffusion
196
coefficient of O2 in H2SO4 (1.4x10⁻⁵ cm².s-1 for 0.5M)[45], C0 is the concentration of O2 in H2SO4 (in the
197
case of an O2 saturated H2SO4 0.1M solution, it is 1.27x10⁻⁶ mol.cm-3 at 298K)[46] and rT is the radius of
198
the active part of the electrode. The theoritical sensitivity is 10.8 nA/mM(O2). The sensitivity measured
199
at t600 is 1.0, 2.2 and 4.3 nA/mM(O2) for -0.2, -0.3 and -0.4 V/SCE respectively, which are significantly
200
lower values compared to the theoritical one. It can be noticed that the sensitivity measured at t0 is
201
8.3, 5.9 and 6.4 respectively which is closer to the theoritical one. 202
𝐼 = 4𝑛𝐹𝐷𝑂𝐶𝑂𝑟𝑇 (1)
203
We decided to consider the detection threshold as the O2 concentration for a current equal to the
204
current measured in absence of O2 in solution. This is calculated by the equation 2 where 𝐼𝑂2 is the 205
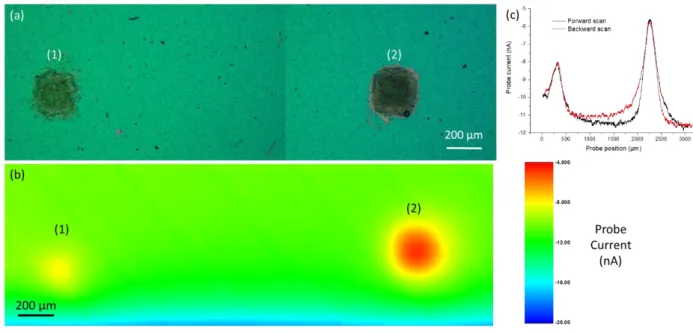
current measured in the O2 saturated solution and 𝐼𝐴𝑟, the current measured in the Ar saturated
206
solution. For -0.2, -0.3 and -0.4 V/SCE, the detection threshold is 47, 31 and 46 µM(O2) respectively.
207
𝐷𝑒𝑡𝑒𝑐𝑡𝑖𝑜𝑛 𝑡ℎ𝑟𝑒𝑠ℎ𝑜𝑙𝑑 = 𝐶𝑂
𝐼𝑂2× 𝐼𝐴𝑟−1 (2)
208
Besides, the instability of the measurement is evaluated by considering the current difference between 209
480 and 600 s to have a well-defined slope compared to 300 s where the stabilization occurs (see 210
equation 3, where I600 is the current at t600, I480 is the current at t480 and 𝐼𝑚 is the averaged current 211 between t480 and t600). 212 𝐼𝑛𝑠𝑡𝑎𝑏𝑖𝑙𝑖𝑡𝑦 = |𝐼600− 𝐼480 𝑡600− 𝑡480 × 1 𝐼𝑚| 𝑥100 (3) 213
The calculated instability is expressed in %/min which corresponds to the current percentage loss every 214
minute of the measurement. In the case of the Pt probe, the instability is 0.44, 0.62 and 0.44 for -0.2, 215
-0.3 and -0.4 V/SCE respectively. 216
Exactly the same procedure is applied to the gold probe. The LSV and the CA are presented in Figure 217
2.c and Figure 2.d respectively. In this case, a pseudo-plateau between -0.4 to -0.7 V/SCE is observed 218
(illustrated by the red bar) in the ORR window instead of a well-defined diffusion plateau. Different CA 219
were done in the same condition as previously for the platinum probe, except that the chosen 220
potentials are -0.4, -0.5 and -0.6 V/SCE, in accordance with the observed lower electrocatalytic activity 221
9
of gold versus platinum. Here also, stabilisation of measurements lasted about 300 s. The shape of the 222
current curves is different in the case of gold. Here again, the probe’s surface state impacts positively 223
or negatively the kinetics at the surface. The difference between Pt and Au probes can be explained by 224
their different ORR mechanisms occurring at the surface, as well as the difference in the stability of the 225
surface states. It can be noticed in the Figure 2.d that the stabilized current is close to the starting 226
current. Thus, for the gold probe, the sensitivity calculated is 3.3, 7.4 and 10.0 nA/mM(O2) for 0.4,
-227
0.5 and -0.6 V/SCE respectively. The detection threshold is 63, 49 and 46 µM(O2) and the instability is
228
0.62, 0.13 and 0.19 %/min respectively. The sensitivity at -0.6 V/SCE is close to the theoretical one. As 229
an additional advantage, the use of a gold probe permits to avoid the possibility to contaminate the 230
substrate with a highly active material such as platinum. Moreover, the stability of the current at the 231
gold probe allows long time acquisition with steady-state measurements. Therefore, based on the 232
comparison of their sensitivities, their detection thresholds and their instabilities between platinum 233
and gold probes, the latter really appears as a very interesting alternative probe for studying ORR. 234
Table 1. Averaged values from the CA at the probes at t600s and calculated sensitivity, detection threshold and instability for
235 these values. 236 Active part composition Eprobe (V/SCE) Current at t600s (nA) Arsat Current at t600s (nA) O2sat Sensitivity (nA/mM(O2) Detection threshold (µM(O2)) Instability (%/min) Platinum probe -0.2 -0.04 -1.22 1.0 46 0.44 -0.3 -0.07 -2.83 2.2 31 0.62 -0.4 -0.20 -5.48 4.3 46 0.44 Gold probe -0.4 -0.21 -4.27 3.3 63 0.62 -0.5 -0.36 -9.39 7.4 49 0.13 -0.6 -0.46 -12.72 10.0 46 0.19 237
The supporting substrate used to analyse the activity of a catalyst is another important element for 238
electrochemical measurements. Micrometric planarity, roughness and electrochemical activity are key 239
parameters that influence the analysis. Figure 3 shows AFM (a) and SEM (b) images of a BDD substrate, 240
where one can observe its polycrystallinity. The roughness average (Ra) and the root-mean-square 241
roughness (Rq) of BDD is measured by AFM and is 39.9 nm and 50.0 nm respectively. Moreover, the 242
maximum measured height is 372 nm. In the present work, a micrometric probe is used, and the 243
positioning is performed at the micrometric scale (typically 30 microns, as shown Figure 5), so the ~100 244
nm roughness of the sample is negligible[49]. Besides, the use of a Si-wafer as substrate support
245
guaranties a negligible non-planarity of the whole sample. Thus, the topography of the BDD substrate 246
is highly acceptable for the investigation of micrometric spots of catalysts with the RC-mode and a 247
micrometric probe. 248
10
249
Figure 3. (a) AFM image showing a thickness of 372 nm, Ra of 39.9 nm and Rq of 50.0 nm and (b) SEM image showing crystals
250
smaller than 1 µm in diameter of a BDD substrate. (c) Scheme of the gold substrate structure. (d) AFM image showing a 2.3
251
nm thickness, Ra of 178 pm and Rq of 225 pm of a gold substrate. (e) AFM image showing a GC substrate with a Ra of 7.2 nm
252
and a Rq of 11.4 nm. (f) SEM image of a GC substrate.
253
As an alternative to BDD, a Si-wafer covered with gold and a GC substrate can be considered. The gold 254
substrate structure is illustrated in Figure 3.c and d for the AFM image. The maximum measured height 255
is 2.3 nm with a Ra of 178 pm and a Rq of 225 pm which allows to scan on a nanoscale surface where 256
inhomogeneities come from the investigated material only. The AFM and SEM image of a GC substrate 257
are presented in Figure 3.e and f respectively. The maximum height measured on the GC substrate is 258
almost 650 nm despite a Ra of 7.2 nm and a Rq of 11.4 nm. The average value is 58.3 nm meaning 259
there is scarce but important inhomogeneities on the GC substrate. The polishing process of the GC 260
substrate is of the outmost importance to allows a high planarity and so nanoscale measurements on 261
it. In contrary, gold and BDD substrates, thanks to the Si-wafer support, keep their planarity on the 262
whole surface. 263
Electrochemical results are presented Figure 4 comparing BDD to a GC substrate, a gold substrate and 264
a catalyst spot of Co-N-NTC deposited on BDD. The samples are studied by RC-SECM at a constant 265
height with a probe-substrate distance of 50 µm. The process involved is presented Figure 4.A and is 266
done in acidic media saturated with oxygen (H2SO4 0.1 M) due to the acidic condition used in a PEMFC.
11 268
Figure 4. (a) Scheme presenting the process involved in the RC-SECM measurement to analyse the ORR activity of BDD, GC, Au
269
and the catalyst spot. (b) Results of chronoamperometry (CA) at different substrate potentials with a gold probe (rT = 5 µm,
270
RG = 30, Eprobe = -0.6V/SCE) in H2SO4 0.1 M solution saturated with oxygen and with a distance probe-substrate of 50 µm.
271
Measurements are made on a clean BDD substrate (∎), a clean GC substrate (▲), a clean gold substrate (♦) and a Co-N-NTC
272
spot (●). The area under the curves represent the potential zone were the competition between the probe and the substrate
273
occurs.
274
The probe was held at -0.6 V/SCE in order to reduce O2 during all measurements. Samples were held
275
at different potentials, from one from which the sample is inactive, to one corresponding to a high 276
activity of the sample (almost no current at the probe) with a 100 mV difference between each 277
measurement. Each potential was held at least 100 s for the current to reach a plateau once stabilized. 278
The results of the experiment are presented in Figure 4.b. 279
The competition starting point between the probe and the samples is noticed at a potential between 280
0.5 and 0.4 V/SCE for the Co-N-NTC spot, 0.1 V/SCE for the gold substrate, between -0.1 and -0.2 V/SCE 281
for the GC substrate and -0.3 V/SCE for the BDD substrate. This means that the competition occurs for 282
more negative potentials applied to the substrate than the one of this starting point. A 50 % 283
contribution of samples is observed at 0.3 V/SCE for the Co-N-NTC spot, -0.1 V/SCE for the gold 284
substrate, -0.41 V/SCE for the GC substrate and -0.48 V/SCE for the BDD substrate. Finally, the probe 285
measures a current almost null at -0.2 V/SCE for the Co-N-NTC spot, -0.5 V/SCE for the gold substrate 286
and -0.7 V/SCE for the BDD. However, for the GC substrate, even at the lowest potentials, the probe 287
current was not null. This can be explained by an uncomplete ORR at the GC substrate. These results 288
showed that the BDD substrate is less active than the other substrates. Moreover, according to 289
previous investigations made for GC through cyclic voltammetry, the same conclusion was established 290
in acidic[39] and alkaline media[50].
12
Overall, the large inactive window of BDD -until -0.3 V/SCE no contribution from the substrate is 292
observed- offers a wider range of experimental conditions that can be used, as illustrated with the Co-293
N-NTC spot with a loading around 200 µg/cm2. There, the O
2 consumption by the catalyst is total before
294
the O2 consumption starts at the substrate, which is not the case with gold. This proves that much
295
lower electrocatalytic activities or loadings can be investigated with BDD. 296
In order to further show that gold probe and BDD substrate are suitable to perform SECM imaging at 297
steady state, Figure 5.a shows a 3 mm² optical image of two Co-N-NTC spots of 120 (a) and 230 (b) 298
µg/cm² sprayed with the ExactaCoat system through a micro-patterned mask to obtain this well-299
defined square spots. The RC-SECM image of these spots is shown in Figure 5.b at Esubstrate = -0.3 V/SCE.
300
The full RC-SECM image (with both forward and backward scans) is recorded within 2 hours. 301
302
Figure 5. (a) Optical image of (1) 120 µg/cm² and (2) 230 µg/cm² Co-N-NTC spots on a BDD substrate. (b) RC-SECM image of
303
the spots shown in (a). (c) RC-SECM forward (black curve) and backward (red curve) linescans at Y = 450 µm from the RC-SECM
304
image (b) corresponding. SECM experiments done with a gold probe (rT = 12 µm, RG = 11, Eprobe = - 0.45V/SCE) in H2SO4 0.1 M
305
solution saturated with oxygen and with Esubstrate = -0.3 V/SCE, a distance probe-substrate of 30 µm and vscan = 20 µm/s.
306
As shown in Figure 5.c, forward and backward linescans overlap above the active spot, and this proves 307
the steady state nature of the measurement. Still, non-stationarity can be seen when the probe is at 308
the extremity of the spots, and in this case the current is smaller if the probe is approaching the center 309
of the spot, and larger in the contrary. This fits the expectations, and does not affect the maximal 310
current variation, which is the most important parameter regarding the spot electrocatalytic activity 311
evaluation. At each line of the image, the current obtained far from the spots can be used to calibrate 312
the relationship between the measured current and the oxygen concentration, by evaluating the 313
effective number of electrons transferred: 314
13
𝑛 =
𝐼4𝐹𝐷𝑂𝐶𝑂𝑟𝑇𝛽(𝑅𝐺)𝑁𝑖𝑇(𝐿,𝑅𝐺) (4)
315
with 𝛽(𝑅𝐺), a correction factor due to the enhancement of diffusion limiting current for the small RG 316
values[51] and NiT(L, RG), a correction factor due to diffusion hindering similar than a negative
317
feedback[42]. With the experimental conditions of Figure 5.c (RG = 11, L = 2.5; L being the ratio between
318
the distance probe-substrate with the rT), NiT(L, RG) = 0.79 so n= 1.8 with the current measured at
319
the end of the linescan (-11.5 nA) presented Figure 5.c. Alternatively, NiT(L, RG) = 0.78 is the ratio 320
between the current measured far from the spot, divided by the current measured in solution. n is 321
smaller than 2 here probably because the diffusion plateau is not reached at the working potential. 322
This way, the quantification of the oxygen consumption rate will become possible. It will need the 323
support of numerical simulation, explicitly taking into account the experimental parameters such as 324
the probe-to-substrate distance, the probe size (active and inactive part), and the spot size and shape. 325
This is fully justified in a context of performing the benchmarking of catalysts, which will be done in 326
future works. 327
Conclusion
328
Herein, we showed how steady state evaluation by RC-SECM for ORR detection in acidic conditions can 329
be achieved with gold probes and BDD substrates. The gold probe exhibited a remarkable current 330
stability, with variation values under 0.2 % variation per minute), further to a good sensitivity and a 331
detection threshold similar to that of the platinum probe. Similarly, we also demonstrated that BDD as 332
supporting substrate shows a very large inactivity window, up to -0.3 V vs SCE, with a submicrometric 333
roughness and a small long-distance non-planarity, thanks to the Si-wafer support underneath. The 334
same setup can also be considered for alkaline media investigations. This may be the basis of future 335
works. Furthermore, preparation of flat BDD substrates is also planned in the future. 336
Conflicts of interest
337
The authors have no conflict of interest to declare. 338
Acknowledgement
339
The authors acknowledge the SENTINEL project, funded by the European Union’s Horizon 2020 340
research and innovation program under the Marie Sklodowska-Curie grant agreement no 812398, and 341
the PEGASUS project, funded by the European Union’s Horizon 2020 research and innovation program 342
FCH-01-2-2017, no779550. 343
14 344
345 346
15
References
347
[1] J. Heinze, Angew. Chemie Int. Ed. English, 1993, 32, 1268–1288. 348
[2] A. Dobrzeniecka et al., Catal. Today, 2013, 202, 55–62. 349
[3] A. S. Arico, P. Bruce, B. Scrosati, J. M. Tarascon, and W. Van Schalkwijk, Nat. Mater., 2005, 4, 350
366–377. 351
[4] Y. Yu, T. Sun, and M. V. Mirkin, Anal. Chem., 2015, 87, 7446–7453. 352
[5] C. M. Sánchez-Sánchez, J. Rodríguez-López, and A. J. Bard, Anal. Chem., 2008, 80, 3254–3260. 353
[6] A. Minguzzi, M. A. Alpuche-Aviles, J. R. Lopez, S. Rondinini, and A. J. Bard, Anal. Chem., 2008, 354
80, 4055–4064. 355
[7] J. J. Santana, J. Gonzalez-Guzman, L. Fernandez-Merida, S. Gonzalez, and R. M. Souto, 356
Electrochim. Acta, 2010, 55, 4488–4494. 357
[8] J. Y. Kim, H. S. Ahn, and A. J. Bard, Anal. Chem., 2018, 90, 3045–3049. 358
[9] A. Domenech-Carbo et al., Electrochim. Acta, 2014, 115, 546–552. 359
[10] A. Domenech-Carbo, M. Teresa Domenech-Carbo, M. Lastras Perez, and M. Herrero-Cortell, 360
Forensic Sci. Int., 2015, 247, 79–88. 361
[11] J. Hui, M. Burgess, J. Zhang, and J. Rodriguez-Lopez, ACS Nano, 2016, 10, 4248–4257. 362
[12] K. C. Huang et al., J. Mater. Chem., 2011, 21, 10384–10389. 363
[13] A. Sumboja, U. M. Tefashe, G. Wittstock, and P. S. Lee, J. Power Sources, 2012, 207, 205–211. 364
[14] Z. Wang, Y. Liu, and V. M. Linkov, J. Power Sources, 2006, 160, 326–333. 365
[15] A. Kishi, M. Inoue, and M. Umeda, J. Phys. Chem. C, 2010, 114, 1110–1116. 366
[16] J. L. Fernández, D. A. Walsh, and A. J. Bard, J. Am. Chem. Soc., 2005, 127, 357–365. 367
[17] W. Li, F.-R. F. Fan, and A. J. Bard, J. Solid State Electrochem., 2012, 16, 2563–2568. 368
[18] S. Kundu et al., J. Phys. Chem. C, 2009, 113, 14302–14310. 369
[19] S. Kumar, P. K. Sahoo, and A. K. Satpati, ACS Omega, 2017, 2, 7532–7545. 370
[20] G. J. Lu, J. S. Cooper, and P. J. McGinn, Electrochim. Acta, 2007, 52, 5172–5181. 371
[21] K. Eckhard, X. Chen, F. Turcu, and W. Schuhmann, Phys. Chem. Chem. Phys., 2006, 8, 5359– 372
16 5365.
373
[22] M. Nebel, S. Grützke, N. Diab, A. Schulte, and W. Schuhmann, Faraday Discuss., 2013, 164, 19– 374
32. 375
[23] S. Gao, C. Dong, H. Luo, K. Xiao, X. Pan, and X. Li, Electrochim. Acta, 2013, 114, 233–241. 376
[24] S. Thomas et al., J. Appl. Electrochem., 2014, 44, 747–757. 377
[25] I. Morkvenaite-Vilkonciene, A. Ramanaviciene, P. Genys, and A. Ramanavicius, Electroanalysis, 378
2017, 29, 1532–1542. 379
[26] F. Ivanauskas, I. Morkvenaite-Vilkonciene, R. Astrauskas, and A. Ramanavicius, Electrochim. 380
Acta, 2016, 222, 347–354. 381
[27] A. J. Wain, Electrochim. Acta, 2013, 92, 383–391. 382
[28] P. Sun and M. V Mirkin, Anal. Chem., 2006, 78, 6526–6534. 383
[29] B. B. Katemann, A. Schulte, and W. Schuhmann, Electroanalysis, 2004, 16, 60–65. 384
[30] A. Tiwari, V. Singh, D. Mandal, and T. C. Nagaiah, J. Mater. Chem. A, 2017, 5, 20014–20023. 385
[31] X. X. Chen, A. J. R. Botz, J. Masa, and W. Schuhmann, J. Solid State Electrochem., 2016, 20, 1019– 386
1027. 387
[32] T. Löffler, P. Wilde, D. Öhl, Y. T. Chen, K. Tschulik, and W. Schuhmann, Faraday Discuss., 2018, 388
210, 317–332. 389
[33] B. Lim et al., Science (80-. )., 2009, 324, 1302–1305. 390
[34] L. Qu, Y. Liu, J. Baek, and L. Dai, ACS Nano, 2010, 4, 1321–1326. 391
[35] V. S. Dilimon, N. S. V. Narayanan, and S. Sampath, Electrochim. Acta, 2010, 55, 5930–5937. 392
[36] G. Wu and P. Zelenay, Acc. Chem. Res., 2013, 46, 1878–1889. 393
[37] K. B. Holt, J. Hu, and J. S. Foord, Anal. Chem., 2007, 79, 2556–2561. 394
[38] S. Tan et al., Phys. Chem. Chem. Phys., 2017, 19, 8726–8734. 395
[39] M. Gara and R. G. Compton, New J. Chem., 2011, 35, 2647–2652. 396
[40] A. Morozan, P. Jégou, B. Jousselme, and S. Palacin, Phys. Chem. Chem. Phys., 2011, 13, 21600– 397
21607. 398
[41] B. R. Horrocks, M. V. Mirkin, and A. J. Bard, J. Phys. Chem., 1994, 98, 9106–9114. 399
17
[42] R. Cornut and C. Lefrou, J. Electroanal. Chem., 2007, 608, 59–66. 400
[43] M. V. Mirkin and S. Amemiya, Nanoelectrochemistry, in CRC Press, CRC Press, 2015, 439–461. 401
[44] K. Aoki and J. Osteryoung, J. Electroanal. Chem. Interfacial Electrochem., 1981, 122, 19–35. 402
[45] J. J. Salvador-Pascual, S. Citalán-Cigarroa, and O. Solorza-Feria, J. Power Sources, 2007, 172, 403
229–234. 404
[46] T. N. Das, Ind. Eng. Chem. Res., 2005, 44, 1660–1664. 405
[47] Y. Shen, M. Trauble, and G. Wittstock, Anal. Chem., 2008, 80, 750–759. 406
[48] A. M. Gómez-Marín, A. Boronat, and J. M. Feliu, Russ. J. Electrochem., 2017, 53, 1029–1041. 407
[49] F. O. Laforge, J. Velmurugan, Y. Wang, and M. V Mirkin, Anal. Chem., 2009, 81, 3143–3150. 408
[50] T. Yano, D. A. Tryk, K. Hashimoto, and A. Fujishima, J. Electrochem. Soc., 1998, 145, 1870–1876. 409
[51] C. Lefrou and R. Cornut, ChemPhysChem, 2010, 11, 547–556. 410
411 412
18
Table of Contents
413 414
415
This paper demonstrates how a judicious choice of probe and substrate materials opens up improved 416
performances to achieve steady state measurements, in this case, for oxygen reduction reaction (ORR) 417
catalytic activity detection through the redox competition scanning electrochemical microscopy (RC-418
SECM). 419
We show that the use of gold enhances the stability of the local oxygen concentration detection in 420
comparison to the regularly used platinum one. We evaluate boron doped diamond as an appealing 421
support substrate, that shows a low ORR activity, high stability and very good reusability. 422
423 424
Keywords
425
Boron doped diamond; Electrocatalysis; ORR; Redox competition mode; SECM 426