HAL Id: hal-01761323
https://hal.archives-ouvertes.fr/hal-01761323
Submitted on 9 Apr 2018
HAL is a multi-disciplinary open access
archive for the deposit and dissemination of
sci-entific research documents, whether they are
pub-lished or not. The documents may come from
teaching and research institutions in France or
abroad, or from public or private research centers.
L’archive ouverte pluridisciplinaire HAL, est
destinée au dépôt et à la diffusion de documents
scientifiques de niveau recherche, publiés ou non,
émanant des établissements d’enseignement et de
recherche français ou étrangers, des laboratoires
publics ou privés.
A flash characterisation method for thin cylindrical
multilayered composites based on the combined front
and rear faces thermograms
Loys Duquesne, Christophe Lorrette, Christophe Pradere, Gérard L. Vignoles,
Jean-Christophe Batsale
To cite this version:
Loys Duquesne, Christophe Lorrette, Christophe Pradere, Gérard L. Vignoles, Jean-Christophe
Bat-sale. A flash characterisation method for thin cylindrical multilayered composites based on the
com-bined front and rear faces thermograms. Quantitative InfraRed Thermography Journal, Taylor and
Francis, 2016, 13, pp.182-194. �10.1080/17686733.2016.1165958�. �hal-01761323�
A flash characterization method
for thin cylindrical multilayered composites based on the
simultaneous front and rear faces thermograms
Loys Duquesne
(1), Christophe Lorrette
(2), Christophe Pradere
(3), Gérard Louis Vignoles
(4) (*
)and Jean-Christophe Batsale
(5)(1) CNRS, LCTS, UMR 5801, F-33600 Pessac, France, (2) CEA, DEN, SRMA, LTMEx, F-91191 Gif-sur-Yvette, France (3) CNRS, I2M, UMR 5295, F-33400 Talence, France
(4) Univ. Bordeaux, LCTS, UMR 5801, F-33600 Pessac, France (5) ENSAM-ParisTech, I2M, UMR 5295, F-33400 Talence, France
(*) Corresponding author:[email protected]
Abstract
The flash method, known as the most used experimental technique to measure the thermal diffusivity of solids, has been adapted to cylindrical highly diffusive and heterogeneous multilayered samples. In order to overcome the heterogeneities issue and give a more accurate estimation of the sample thermal properties, the front face and rear face thermal responses have been simultaneously recorded using an infrared camera. A homogeneous monolithic SiC cylinder has been tested to validate this experimental method, which has finally been applied to 2D bi-layered SiCf/SiC cylinders used for nuclear fuel cladding.
Nomenclature
ɑ thermal diffusivity, m².s-1 S reduced sensitivity, K
A,B,C,D quadrupole matrix components Sext, Sint outer / inner surface, m² e sample thickness, m T Excess temperature, K
hext, hint outer / inner losses, W.m-2 t time, s
I,K Bessel’s functions a Pulse shape coefficient
L length, m l Heat conductivity, W.m-1.K-1 P flash shape function xext, xint scaled Laplace parameters p Laplace parameter rc thermal capacity, J.K-1.m-3
Q flash energy density, J.m-2 t time constant, s
Rext, Rint outer / inner radius, m j Heat flux, W
1. Introduction
The flash method was introduced by Parker et al. [1] and has become the most used experimental technique to measure the thermal diffusivity of solids. This method allows following the thermal behaviour of a sample by a pulse heating of the front surface of an opaque sample and observing the temperature evolution of the rear or front surface. During the last decades, numerous estimation techniques based on the flash method have been proposed for the thermal characterization of flat samples [2]. Recent advances [3-5] have led to the extension of the flash method to measure the thermal diffusivity of homogeneous cylindrical samples (lead foils). The validity of the analytical model [3,4] based on the quadrupoles formalism [6] and developed for flat samples has also been proved except for extremely curved samples [4]. The different existing thermal characterization methods [3-5,7-8] use either front face or rear face signals obtained after a flash and lead to estimate the material thermal effusivity or diffusivity. In the case of highly diffusive and heterogeneous materials, the estimation accuracy is impaired, even more if they are cylindrical.
In this study, we extend the flash method, as adapted to the characterization of cylindrical homogeneous samples, to cylindrical, highly diffusive and heterogeneous multilayered samples. In order to overcome the heterogeneity issue and give a better estimation of thermal properties, a new experimental approach, combining front and rear faces signals, is introduced. It gives access to equivalent thermal diffusivities by a combined analysis of the front face and rear face thermal responses over a large characteristic frequency range. The
objective consists here in illustrating this new experimental approach and to confirm the validity of the analytical model or of simplifications thereof. For this, flash measurements have been performed on homogeneous and on multilayered tubes made of ceramic matrix composite (SiCf/SiC) layers.
The paper will first address the theoretical approach. An analytical solution for the flash method – under certain hypotheses discussed in this section – using the combination of front and rear faces method, is presented and discussed. Then, an experimental set-up implemented for this combination of flashes is validated on a homogeneous monolithic SiC cylinder. Finally, results on a 2D bi-layered SiCf/SiC cylinder are detailed and
discussed.
2. Hypotheses and simplifications
The flash method applied on a cylindrical sample can be described using the thermal quadrupoles formalism [6]. This model allows the description of the entire physical process as it contains all the parameters that can interfere with the heat transfer (cylindrical geometry, heat losses, flash form and duration). The analytical solution in Laplace space is given by [4]:
(1)
where q is the Laplace transform of the excess temperature T with respect to the ambient, j is the Laplace transform of the heat flux F; A, B, C and D are described with combinations of the first and second order Bessel functions K0,1 and I0,1:
(2)
where xint;ext = (p/a)1/2Rint;ext are scaled Laplace space parameters. The specification of the solution is
completed by the expressions for the fluxes jint and jext :
(3)
Ideally, a perfect flash would have no physical duration and P(t) would be given by a Dirac distribution d(t) In reality, the flash length of our lamps has been measured to last between 3 and 5 ms. Taking this time t into account, a convenient time profile for the flash pulse is given in Laplace space by [4]:
(4)
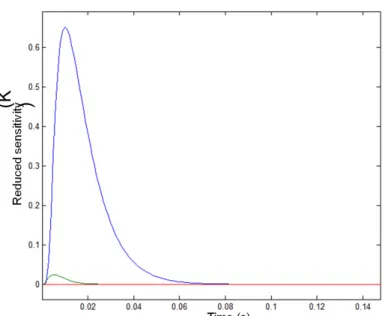
where a = ½ [4]. Using this model and Stehfest’s numerical procedure for the inverse Laplace transform [9] in the case of cylindrical homogeneous sample of SiC, we have determined the reduced sensitivities of the signal to heat losses, flash form and diffusivity of the material. For these three parameters noted X, the sensitivities are:
Computations have been made for the front face signal with the following parameters: Q = … W.m-2; h
int =
hext = … W.m-2.K-1; Sint = … m2; Sext = … m2; L = … m; a = … m2.s-1; l = … W.m-1.K-1. They are displayed on Fig.
1, from which it is clear that the flash shape and the heat losses do not interfere with the estimation of thermal
diffusivity. Therefore they will not be considered any more in our estimation model. Moreover, it has been shown [4,5] that when the inner radius is at least twice as large as the thickness of the studied sample, which is our case,
θ
intφ
int⎡
⎣
⎢
⎢
⎤
⎦
⎥
⎥
=
A
B
C
D
⎡
⎣
⎢
⎤
⎦
⎥
θ
extφ
ext⎡
⎣
⎢
⎢
⎤
⎦
⎥
⎥
A =
ξ
ext⎡⎣
K
1(
ξ
ext)
I
0( )
ξ
int+ I
1(
ξ
ext)
K
0( )
ξ
int⎤⎦
B =
1
2
πλ
L
⎡⎣
I
0(
ξ
ext)
K
0( )
ξ
int− K
0(
ξ
ext)
I
0( )
ξ
int⎤⎦
C =
ξ
int⎡⎣
K
0(
ξ
ext)
I
1( )
ξ
int+ I
0(
ξ
ext)
K
1( )
ξ
int⎤⎦
D = 2
πλ
L
ξ
extξ
int⎡⎣
I
1(
ξ
ext)
K
1( )
ξ
int− K
1(
ξ
ext)
I
1( )
ξ
int⎤⎦
⎧
⎨
⎪
⎪
⎪
⎩
⎪
⎪
⎪
φ
int= Q
L P t
(
( )
)
− h
intS
intθ
intφ
ext=
h
extS
extθ
ext⎧
⎨
⎪
⎩⎪
L P t
(
( )
)
=
1
1+ pτ
(
)
αS t
( )
= X
∂T t, X
(
)
∂X
heat transfer from part to part after a flash experiment can safely be described with plane equations (i.e. there is less than 1% difference).
Fig. 1. Reduced sensitivity with respect to the thermal diffusivity (blue curve), to the flash shape (green curve) and to the heat losses (red curve) over time.
The analytical solution, using these simplifications, can be obtained without the quadrupole formalism, in direct time space, as a series sum. The front face and rear face signals are:
(5)
(6) These equations will be exploited jointly in the next section.
3. Using combined front and rear face signals.
To improve the accuracy of the determination of the diffusivity – which is high in the present case – using a combination of the front and rear face signals is an interesting solution. A theoretical “two-temperatures” approach has already been described in [10], using the ratio of both signals. Here, from the structure of eqs. (5) and (6), it looks more natural to use their sum and difference, which are given by:
(7)
(8)
These analytical results are plotted in Fig. 2. Their asymptotic development for long time behaviour (t > e²/a) leads to the following equations:
(9)
(10)
The long time behaviour of the front and rear faces signals sum (Eq. 9) represents the front face response after a flash applied to an e/2-thick sample, with an adiabatic rear face. The long time behaviour of the difference (Eq.
T
0= T 0, t
( )
=
Q
ρ
ce
1+ 2
exp −
n
2π
2e
2at
⎛
⎝
⎜
⎞
⎠
⎟
n=1 ∞∑
⎡
⎣
⎢
⎤
⎦
⎥
T
1= T e, t
( )
=
Q
ρ
ce
1+ 2
( )
−1
nexp −
n
2π
2e
2at
⎛
⎝
⎜
⎞
⎠
⎟
n=1 ∞∑
⎡
⎣
⎢
⎤
⎦
⎥
T 0, t
( )
+ T e, t
( )
=
2Q
ρ
ce
1+ 2
exp −
4k
2π
2e
2at
⎛
⎝
⎜
⎞
⎠
⎟
k=1 ∞∑
⎡
⎣
⎢
⎤
⎦
⎥
T 0, t
( )
− T e, t
( )
=
4Q
ρ
ce
exp −
2k +1
(
)
2π
2e
2at
⎛
⎝
⎜
⎜
⎞
⎠
⎟
⎟
k=0 ∞∑
( ) ( )
ú
û
ù
ê
ë
é
÷÷
ø
ö
çç
è
æ
-+
@
+
at
e
ce
Q
t
e
T
t
T
2 24
exp
2
1
2
,
,
0
p
r
( ) ( )
÷÷
ø
ö
çç
è
æ
-=
-
at
e
ce
Q
t
e
T
t
T
2 2exp
4
,
,
0
p
r
(K
)
10.) represents a front face response after a flash applied to an e/2-thick sample, with an isothermal rear face at imposed ambient temperature.
Fig. 2. Analytical thermal responses over time for front (blue curve) and rear (green curve) face; sum (red curve) and difference (cyan curve) of these responses (with T0 = T(0,t) and T1 = T(e,t))
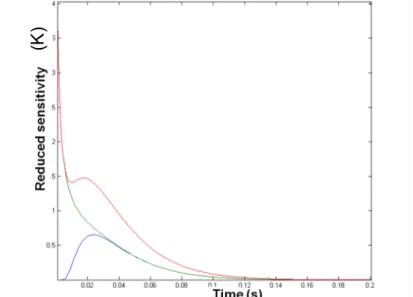
A sensitivity study of the combination of the signals with respect to the parameter ɑ only has been performed. As shown in Fig. 3., when working on the same time range, the sensitivity of the combination is better than the sensitivity using the front and rear face signals taken separately, as we have twice as much information. This validates our choice of processing both signals together.
Fig. 3. Reduced sensitivity with respect to the thermal diffusivity of the front (green) and rear (blue) faces and of the combination of the signals (red).
Here, the reduced sensitivity to the parameter “diffusivity” is exactly twice as large as the sensitivity from front and rear faces’ taken separately.
In order to show the impact of experimental error, a noise sensitivity study has been conducted. Several realizations of the front and rear faces’ signals are numerically constructed using equations (7) and (8) with an extra random noise of 2% amplitude. Identification of the diffusivity is performed by least squares minimization of the error between the modelled and input signals. Using 15 signals, it has been determined that the standard error of identification is less than 0.5%. When using 1000 signals, the error decreases to under 0.05%. So, when more thermograms are used, the error on the estimation diminishes approximately as the inverse square root of the number of experiments, as expected; however, all estimations are still scattered. We have also followed the dispersion of the identified values, defined as the root mean square of the deviations with respect to the reference value over N thermograms. Several versions of the model have been considered: the simplified axi-symmetric model, using either the front face signal, the rear face signal, the union of the front and rear face signals (i.e. eqs. (5) and (6) simultaneously fitted in a single procedure), their difference and their sum. The RMS deviation of the
(K
results on front and rear face signals, separately or jointly, and their sum and difference obtained with an increasing number of experiments is presented on Fig 4. In all cases, we verify that there is no measurable reduction of the bias by increasing the number of experiments; on the other hand, the type of method has an influence. The standard deviation (around the possibly biased average) obtained with the union of the front and rear faces’ signals is smaller than the half of the standard deviation of the results obtained with the front face and the rear faces. The difference of the signals, as shown on Fig.4, has comparable performances, while the sum is much less effective.
Fig. 4. RMS deviation of the results of thermal diffusivity estimation for front and rear face, for the sum and the difference and for the union of both signals. With increasing number of experiments, a convergence towards a
steady bias is observed for all methods.
Therefore, the method using the difference of the signals is shown to be as accurate as the method using their union, and it will be preferred for practical reasons that will be exposed later.
4. Experimental
A new experimental device has been developed in order to collect the exterior and interior face signals of a cylinder flashed from the exterior, as sketched in Fig. 5.
Fig. 5. Sketch of the experimental device for the combination of front (exterior) and rear (interior) faces signals
The temperature monitoring is provided by an InSb infrared camera (FLIR SC7000, detection window: 2.5 -5.5 μm). The precision of the IR camera is about 2%. Four external flash lamps (Elinchrom: 300J zoom action lamps -
RMS $d ev ia* on $(10 06$m 2/s)$ 45°$%lted$gold$mirror$ placed$inside$tube$
Digital 600RX power generators) are settled around the cylinder to ensure a quasi-uniform heating. The front (exterior) face response is directly available by camera recording. On the other hand, since the rear face is in the interior, a mirror has to be settled inside the tube, with an angle of 45° with respect to the tube axis. This allows recording the signals by aligning the camera along the tube axis. A gold mirror has been selected because it ensures a better reflection coefficient (it reflects over 98% in the infrared spectrum whereas a silver mirror only reflects 90%). The direct influence of the heat pulse on the sensor is minimized by adding infrared filters (bandwidth: 315 to 710 µm). The temporal response of the flash is accurately measured using a photodiode (Thorlabs: PDA36A-EC) that allows catching the initial pulse heating instant. Moreover, the experimental device has been set up in a way to make a fast and user-friendly rotation between front (equatorial) and rear (apical) face positions, as shown in Figs. 5. and 6.
Fig. 6. Picture of the experimental setup for (a) exterior face and (b) interior face monitoring
The front and rear faces thermal responses have been recorded sequentially using the infrared camera, at 2500 frames per second on a 64x8 pixels area. Only the average of temperature on pixels at the center of this area has been recorded for the front and rear faces, in order to avoid artefacts due to the curvature of the sample.
5. Application to SiC-based tubes
This study focuses on developing measurement methods for thermophysical properties of multilayered tubes, made of composites (SiCf/SiC), used for nuclear fuel cladding. For leak-tightness, mechanical and dimensional
reasons, these tubes are highly heterogeneous. Global transverse and local variations of thermal properties of such a structure have to be identified, since they are essential to their final use – heat transfer in future nuclear power plants of next generation.
A validation of the experimental set-up for the combination of front and rear faces signals on a homogeneous “test” material is performed. Then, results on 2D bi-layered heterogeneous SiCf/SiC tubes are presented and
discussed.
5.1. Samples
The samples used for the validation of the method are tubular and made of a homogeneous monolithic SiC material (Boostec® from Mersen) 2.1 mm in thickness and 5.4 mm internal radius. The manufacturer data for heat diffusivity is 7.10-5 m2.s-1. The samples for which the proposed method has been designed are cylinders made of
a 2D bi-layered structure composed of ceramic matrix composite (SiCf/SiC) layers. They are prepared by braiding
and filament winding techniques followed by matrix vapor-phase infiltration; their inner radius Rint is 3 mm and they
have ~ 1mm thickness. All samples verify e/Rint < 0.5, ensuring that the difference between cylindrical and plane
5.2. Validation on tubular homogeneous monolithic SiC material
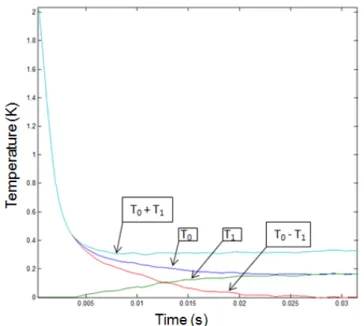
The sum and the difference of experimental front and rear face signals for a homogeneous monolithic SiC pipe are summarized in the following figure (Fig. 7):
Fig. 7. Front (blue) and rear (green curve) faces signals; sum (cyan curve) and difference (red curve) of these signals over time
Regarding Eq. 10, we assume that when the material semi-infinite behaviour is over, the signal follows a pure exponential decay curve. Therefore, its logarithm is linear with time:
(11)
Thus, outside the semi-infinite environment, the logarithm of the signal can be easily minimized by a linear function with slope . This linear regression leads directly to an estimation of the thermal diffusivity ɑ, as depicted in Fig. 8.
Fig. 8. Left: Fit of eq. (11) to the front and rear faces difference’s logarithm over time, as given by eq. (8), for an ideal material. Right: Experimental thermogram for a tubular homogeneous monolithic SiC sample
By repeating 15 times the experiment, we have collected data for a study of the accuracy and dispersion of the method associated to different identification procedures. Fig.9 summarizes the results obtained, under the form of
lim
t→∞ln T 0, t
(
( )
− T e, t
( )
)
⎡
⎣
⎤
⎦ = ln
ρce
4Q
⎛
⎝
⎜
⎞
⎠
⎟ − a
π
2e
2t
−aπ
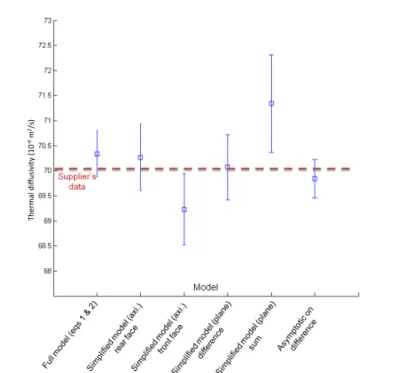
2 e2averages plus or minus one standard deviation, as compared to the furnisher’s data. We can see again that the difference of signals (eq. (8)) has a very good performance, while the sum has not. Moreover, using eq. (11) even leads to surprisingly good results.
All methods except the signals sum have dispersions of less than 1.5% of the average value. As shown in fig. 4, using a 2% camera noise added to a theoretical signal, the obtained dispersion in the same conditions is 0.4%. We conclude that the source of experimental uncertainty is not only linked to the identification method combined to the camera noise: approximately 2/3 of the dispersion width remains unexplained.
Fig.9. Average and standard deviation of the estimation with the different models, compared to the supplier’s data
One of the additional sources of uncertainty that has not been addressed until this point is that the illumination may differ from a purely axi-symmetrical pattern. To quantify this error source, a rear face estimation of the thermal diffusivity has been done all around the tubular monolithic SiC sample every 10° by rotating the inner mirror. Fig. 10 shows the experimental results. The average error on estimation is about 1.3%; accordingly, the heat transfer may be considered unidirectional as soon as a better precision than 1.3% is not looked for.
Fig. 10. : Estimation of the thermal diffusivity all around the tubular SiC sample (red crosses) as compared to supplier’s data (70. 10-6 m²/s, green circle)
Another source of dispersion is the non-reproducibility of the flash energy density from one experiment to another – this may give a possible bias to every determination involving the sum and the difference of the signals, hence increasing the dispersion. Fig. 9 tends to show that the dispersions for the “sum” and the “difference” methods are
Th er m al (d iff us iv ity ((10 46(m 2/s)(
not appreciably increased with respect to the pure “front face” and “rear face” methods, showing that this source of dispersion has a low impact on the methods precision.
5.3. Experimental results for 2D bi-layered heterogeneous SiCf/SiC
Once the experimental approach has been validated, the next step consisted in applying it to a cylindrical bi-layered heterogeneous sample of interest. The problem is that the sample is not homogeneous through the thickness: the models presented above should therefore fail to describe in detail the material response. However, using them on the thermograms should lead to the identification of some “apparent averages” of the thermal diffusivities of the separate layers. Naturally, it is expected that the front face signal will give an identified coefficient closer to the front face diffusivity, whereas the back face signal will give an identified coefficient closer to the back face diffusivity. On the other hand, the combinations of the signal (sum and difference) are expected to lead to identifying some intermediate value between the front and rear face diffusivities.
Fig. 11. Thermal response over time after a flash for front (blue curve) and rear (green curve) faces
The experimental set-up is used in order to obtain front and rear faces thermal responses (Fig. 11). Equation (7) has been used to fit the experimental sum of the thermal signals, whereas equation (11) has been used to fit the experimental difference signals during intermediate times (Fig. 12.).
Based on 15 experiments, the thermal diffusivity is estimated at (11.4±0.5).10-6 m²/s from the front face response
and at (9.4±0.19).10-6 m²/s from the rear face response, at (9.7±0.6).10-6 m²/s from the signals sum and at
(10.3±0.15).10-6 m²/s from the signals difference. As expected, the sum and the difference thermal diffusivities
estimations of the signals appear as averages of the front and rear faces estimations, the difference being closer to the front face and the sum closer to the back face. In any case, all results are lying close to literature values for this kind of material [11].
6. Conclusion and further work
A method for the estimation of the apparent radial thermal diffusivity for multi-layered tubular samples based on the combination of front and rear faces flash signals has been proposed. An experimental set-up has been developed and validated using a homogeneous monolithic tubular SiC test sample. Simplified models have been produced for an easy identification without major loss of accuracy (less than 2%). The best identification procedure makes use of an asymptotic development of the difference of front and rear face temperatures, under hypotheses of quasi-1D heat transfer without heat losses and with an ideal heat pulse shape. All simplifying hypotheses have been checked and validated.
Finally, this new approach has been applied to a real bi-layered SiCf/SiC tubular sample. The identified diffusivity
is not unique: four estimates are given from respectively the front face signal, the rear face signal, and their sum and difference. The four diffusivities, as they are given here, are what we would get if we were trying to apply this method, but they have no true physical meaning because the material is inhomogeneous. Nonetheless, the obtained values are close to previously reported data on the same class of materials.
The developed experimental set-up seems to be a suitable solution for the study of heterogeneous tubular materials, as soon as the theoretical model is extended to a multi-layer model – currently available for lock-in experiments [7,8] – or even to a more complex image-based model: this is the aim of current work in progress.
Fig. 12. Thermograms of the SiCf/SiC composite tube. Left: Front (red) and rear face (cyan) signals; their sum
(green) and a fit of eq. (7) (blue). Right: logarithm of the difference (blue) and a fit of eq. (11) (red).
REFERENCES
[1] W. J. Parker, R. J. Jenkins, C. P. Butler and G. L. Abbott, Flash Method of Determining Thermal Diffusivity, Heat Capacity, and Thermal Conductivity, Journal of Applied Physics, 32,1679, 1961.
[2] D.Balageas, Thickness or diffusivity measurements from front-face flash experiments using the TSR (thermographic signal reconstruction) approach, Procs. 10th QIRT conference, X. Maldague, ed., Editions du
CAO, Les Eboulements, QC, Canada, ref. QIRT 2010-011, 2010.
[3] A. Salazar and R. Celorrio, Application of the thermal quadrupole method to the propagation of thermal waves in multilayered cylinders, J. Appl. Phys. 100, 113535, 2006.
[4] A.Salazar, R.Fuente, E.Apiñaniz and A.Mendioroz, Thermal diffusivity of nonflat plates using flash method. Review of Scientific Instruments. 82, 014902; doi: 10.1063/1.3529431, 2011.
[5] Z. Chen, C. Wang and H. Qu, Characterization of curved composite structure using laser infrared photothermal radiometry, Proc. SPIE 6723, 3rd International Symposium on Advanced Optical Manufacturing and Testing Technologies: Optical Test and Measurement Technology and Equipment, 672341, doi:10.1117/12.783589, 2007.
[6] J-C. Batsale, D. Maillet, A. Degiovanni, S. André and C. Moyne, Thermal Quadrupoles: Solving the Heat Equation through Integral Transforms. Wiley, Chichester, 2000.
[7] R. Celorrio, A. Mendioroz, E. Apiñaniz, A. Salazar, C. Wang and A. Mandelis, Reconstruction of radial thermal conductivity depth profile in case hardened steel rods, J. Appl. Phys. 105, 083517, 2009 [8] G. Xie, J. Zhang, L. Liu, C. Wang and A. Mandelis, Thermal conductivity depth-profile reconstruction of
multilayered cylindrical solids using the thermal-wave Green function method, J. Appl. Phys. 109, 113534, 2011
[9] H.Stehfest, Numerical inversion of Laplace transforms. Communication of the ACM, 13, 10, 624, 1970. [10] M. Amazouz, C. Moyne and A. Degiovanni, Measurement of the thermal diffusivity of anisotropic materials,
High Temp., High Pressure, Vol. 19, p. 37-41, 1987.
[11] R. Yamada, N. Igawa, T. Taguchi and S. Jitsukawa, Highly thermal conductive, sintered SiC fiber-reinforced 3D-SiC/SiC composites: experiments and finite-element analysis of the thermal diffusivity/conductivity, J. Nucl. Mater. 307–311, 1215–1220, 2002.