From Crossing Boundaries in Park Management: Proceedings of the 11th Conference on Research and
Resource Management in Parks and on Public Lands, edited by David Harmon (Hancock, Michigan: The George
Wright Society, 2001). © 2001 The George Wright Society, Inc. All rights reserved.
12
Preserving paleontological resources using photo-
grammetry and geographic information systems
BRENT H. BREITHAUPT, Geological Museum, University of Wyoming, P.O. Box3006, Laramie, Wyoming 82071; uwgeoms@uwyo.edu
NEFFRA A. MATTHEWS, National Science and Technology Center, Bureau of Land
Management, P.O. Box 25047, Denver, Colorado 80225; neffra_matthews@blm.gov
Introduction
The American West is a storehouse of fascinating paleontological resources that include the footprints and skeletal remains of dinosaurs. These important scientific and educational resources are often on lands managed by government agencies for the benefit of the nation’s public. Land management agencies are challenged with providing public access to these resources, as well as preserving them for future gen-erations. Conservation includes the scientific identification, documentation, curation, and monitoring of these national treasures.
The natural process of weathering, combined with the effects of public visita-tion—including those of vandalism, unfortunately—can significantly affect a site. Documentation, collection (when appropriate), and retention of data and associated materials in a suitable public repository, where the information can be preserved into perpetuity, are vital. An excellent documentation tool is three-dimensional (3-D) data capture. Photogrammetry, conventional or global positioning systems (GPS) surveying methods, and ground-based laser imaging are techniques that can provide highly accurate 3-D representations of fossil resources.
Vertebrate ichnology at the Red Gulch Dinosaur Tracksite
The Red Gulch Dinosaur Tracksite (RGDT) is a newly reported (Breithaupt et al. in press) paleontological resource. Located near Shell, Wyoming, the RGDT is a 1,600-sq-m area of land administered by the Bureau of Land Management (BLM) in the eastern Bighorn Basin of northern Wyoming. This site is unique in North Amer-ica and represents a signifAmer-icant paleontologAmer-ical resource that is being developed for the educational benefit of the public. In a cooperative partnership with the BLM, investigators have supported development of the site as a unique tool for public edu-cation. To that end, the investigators have assisted in the creation of interpretive dis-plays and Web sites, as well as disseminating accurate information to the media.
Over the past three years, dinosaur tracks were located, mapped, measured, de-scribed, surveyed, photographed, and compared with other previously studied track assemblages. Analysis of this data is providing unique insights into the community structure and habitat of Middle Jurassic dinosaurs in northern Wyoming. Because of the density of tracks, degree of surface exposure, proximity to the road, and BLM development plans, the primary focus of research at the RGDT was an arroyo (“dry wash”) exposing a limestone unit of the lower Sundance Formation. This unit his-torically has been defined as open water marine in character (Darton 1899). How-ever, this discovery demonstrates an episode of subaerial exposure during regressive phases of the Sundance Sea. Geologic work in the area has assigned the track-bearing unit to the Middle Jurassic Bathonian-age (165 million years old) Canyon Springs Member of the Sundance Formation (Schmude 2000). Any evidence of dinosaur activity from the Middle Jurassic is significant, as this was a period worldwide which
preserves little terrestrial deposition, and a very limited vertebrate fossil record (Shubin and Sues 1991).
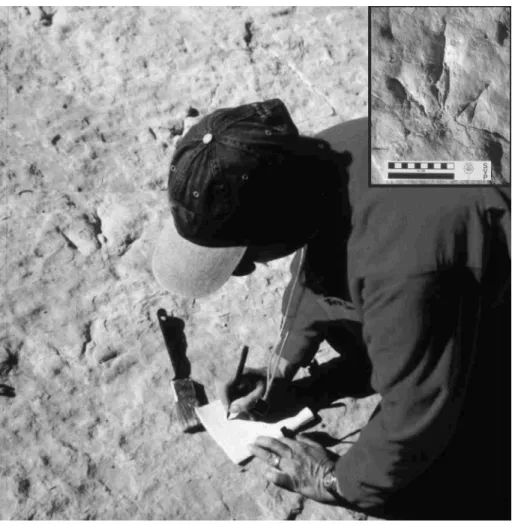
The dinosaur tracks at the RGDT are preserved as impressions in a gray, ripple-bedded, oolitic, peritidal limestone. All of the tracks are tridactyl pes impressions ranging in length from 8 to 30 cm (Figure 12.1). The majority of tracks have three distinct digits, a very faint “heel” imprint, sharp claws, and foot lengths greater than widths. This track morphology is consistent with those generally attributed to thero-pod (meat-eating) dinosaurs (Thulborn 1990). The tracks were all created by small-to medium-sized theropods ranging in weight from tens small-to hundreds of kilograms.
Figure 12.1. Beth Southwell measuring a dinosaur track at the RGDT. Close-up of a dinosaur track (inset upper right).
Over 1,000 theropod tracks have been discovered at the RGDT, making it the most extensive dinosaur tracksite known in Wyoming. Arranged into at least 125 discrete trackways (ranging from 2 to 45 steps), these tracks offer a unique glimpse of dinosaurs walking close to the shore of an inland seaway. Mapping efforts (Breithaupt et al. in press) documented over 630 tracks (representing 40 trackways) in the
southern part of the arroyo (known as the “Ballroom”) and approximately 280 tracks (representing 49 trackways) in the northern part of the arroyo (“Discovery Area”). The majority of the trackways show preferred orientations with trends of parallel to subparallel groupings to the south and southwest, suggesting gregarious behavior. However, several solitary trackways trend in opposite directions. Analyses of these various trackways with regard to time sequencing, origin, direction of travel, speed, and changes in morphology are currently in progress. Because of the large number of tracks and their extent, important morphological and preservational variations within and between trackways can be analyzed. Irregularities in track morphology, step length, straddle width, and trackway paths relate to variations in substrate microenvironments or to intracommunity dynamics (Breithaupt et al. in press).
Standard vertebrate ichnological field methods discussed by Thulborn (1990) and Lockley (1991) were incorporated during the study of the RGDT. The tracks were located and sketched onto a map with a scale of 1 in = 1 m. The 1-m grids for this map of the track-bearing horizon were laid out on the outcrop surface utilizing a Topcon standard two-person total station and a Geodimeter System 4000 one-per-son total station with remote positioning unit. Detailed descriptions and measure-ments were taken on each track. This information included identification number, size, shape, and arrangements of digits, with special attention being paid to the pres-ence of distinctive track features. Over 20,000 track attributes were recorded at the RGDT and entered into an Excel spreadsheet. In addition, the location of toe and heel points for the tracks in the Ballroom were captured using the Geodimeter System 4000 total station. An ArcView point theme was then generated from the surveyed coordinate data and linked to the data in the Excel spreadsheet and integrated with other geographic information systems (GIS) elements (Naus, Matthews, and Southwell 1999).
Photogrammetry at the RGDT
In addition to traditional vertebrate ichnology documentation techniques, photo-grammetry (i.e., making measurements from photographs or other remotely sensed images) was utilized at the RGDT. To preserve the data from this unique paleon-tological site, monitor weathering, and facilitate the scientific research, the RGDT was intensively photodocumented. Imagery of the tracksite ranged from 30-m-reso-lution satellite data to close-range (object-to-camera distance of less than 300 m) photogrammetric images of a single track. Large format (9x9-in) natural-color aerial photography (scales of 1:3000 and 1:1800) was used to produce digital terrain mod-els, digital orthophotos, and topographic contour maps of the entire 1,600-sq-m area.
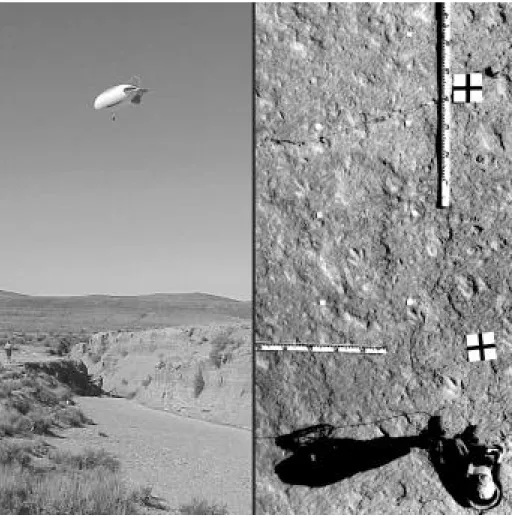
Large-format aerial photography, while suitable for developing management and recreation plans for the RGDT, did not provide the level of detail needed to illustrate track and trackway relationships. To fill the gap, a 35-mm camera was mounted on a low-altitude remote-controlled airplane and used to photograph the dry wash. The resulting photographs were scanned, mosaicked, and registered to the digital ortho-photo (Figure 12.2). In addition, the Ballroom was ortho-photographed from an ultralight aircraft. However, camera motion was a noticeable problem for pictures taken from the planes. To rectify this problem, a tethered blimp with a 50x70-mm-format camera and lightweight video camera was used at the RGDT. This system consisted of a 6-m-long, helium-filled blimp, which was capable of lifting a camera to 76 m above the ground. The on-board camera is electronically positioned from the ground and can be oriented to acquire photographs that are nearly vertical to the subject (Figure 12.3).
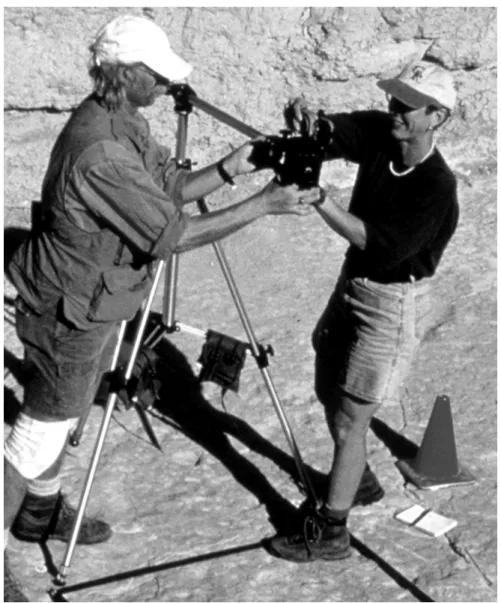
To further preserve and record the paleontological resources on the main track-bearing surface, close-range photographs (174 cm above the surface) were taken of each 1-m grid in the arroyo that contained a track (Figure 12.4). A Rollieflex 3003 metric 35-mm single-lens reflex surveying camera was utilized. These photographs were scanned, and rectified to the 1-m mapping grid.
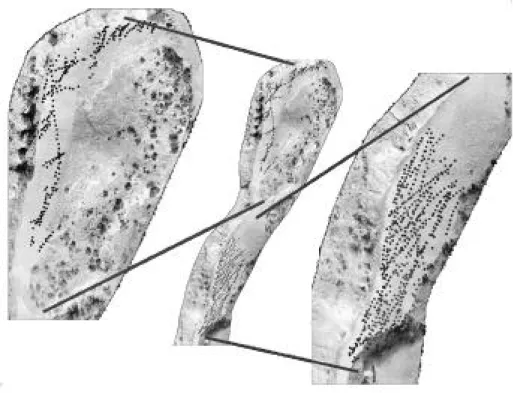
Figure 12.2. RGDT dry wash (photo from low-altitude remote-controlled air-plane) with track points located from total station. Left image: Discovery Area (north); center image: entire dry wash; right image: Ballroom (south).
Stereoscopic photogrammetry at the RGDT
Stereoscopic photogrammetry was used as a noninvasive strategy for collecting three-dimensional data about selected tracks (Matthews and Breithaupt in press). In order to provide horizontal and vertical control at the needed level of precision, and a 1.05-sq-m grid was used. Stereoscopic photographs were taken with the Rollieflex surveying camera. This camera has a matrix of fiducials that are imprinted on each frame and a calibrated lens. Three photographic stations were occupied for each subject set-up. These photographs were set up in on an analytical stereoplotter where an interior, relative, and absolute orientation were then performed. This procedure combines the camera calibration information, the location of the photographs in the instrument, with the ground-control coordinates. The result is a geometric reconstruction of the field subject in an analytical environment (Friedman 1980). In this environment, detailed x, y, and z information can be extracted. Surface data was collected at evenly spaced 10-mm intervals, producing a Digital Terrain Model (DTM). The DTM data were brought into ArcView, where a contour map with a
2-mm interval was produced. DTM data were also imported into EarthVision Geologic modeling software and a surface was generated. This surface was rotated in 3-D space and viewed from various perspectives (Figure 12.5). An image of the tracks was digitally draped over the surface, providing a virtual digital reproduction of a portion of the track surface. These images allow paleontologists to do detailed measurements and analyses in the lab. Valuable statistical comparisons of within-trackway and across-trackway variability in footprint shapes can be observed and calculated. Not only can important information be obtained about the track maker from detailed 3-D data, but also a clearer understanding of the preservational history of the tracks and the depositional environment can be attained.
Figure 12.3. Tethered blimp with mounted camera over the Ballroom (left). Low-level aerial photos from the blimp of tracks in the Ballroom (right). Documentation of a dinosaur bonebed
For the past two years, photodocumentation of a Late Jurassic Morrison Forma-tion dinosaur bonebed (Virginia Museum of Natural History Locality 186) in the eastern Bighorn Basin of northern Wyoming has been conducted. To capture the spatial relationships of the fossilized skeletal material, close-range photogrammetry
has been used. The camera blimp system was also used at this site to document the in
situ contextual relationships of articulated and disarticulated remains of Apatosaurus, Stegosaurus, Camptosaurus, Allosaurus, Diplodocus, and Camarasaurus.
Photo-graphs of the quarry provide a visual and spatial record of the location and relation-ships of the skeletal material extracted during each field season. A mosaic of photo-graphs from successive years can reveal associations which could only have been recognized if the entire bonebed was exposed at one time. These spatial relationships can be quantified and their 3-D relationships examined in greater detail, both spa-tially and temporally utilizing GIS.
Figure 12.4. The authors conduct photogrammetric documentation of a 1-m grid in the Ballroom.
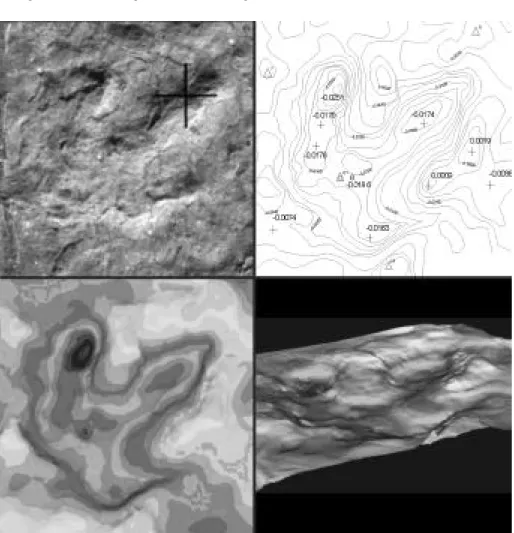
Figure 12.5. Photo of a RGDT footprint (upper Left); digital contour of track (upper right); DTM of track, planar view (lower left); and DTM of track, oblique view (lower right).
Three-dimensional laser data collection
State-of-the-art advances in the field of laser technology have changed the face of 3-D data collection. High-speed, high-accuracy laser radar scanning systems have made it possible to collect 800 x, y, and z data points per second. These data points have a positional accuracy of +/- 6 mm when scanning at distances of less than 50 m. This system returns a very precise and dense cloud of 3-D data. The laser system is a transportable, robust field unit that provides near-real-time access to the data. An advantage of this system is that measurements can be made directly from the point cloud data in the field. These data can be utilized in a variety of software packages for the production of 3-D surfaces, contours, and site visualization.
The value of laser technology to paleontology has only begun to be explored. Be-cause of the portability of the equipment, a variety of sites and specimens have been investigated. Variations in surface textures between bone and matrix can result in a difference in the intensity of the laser return. This property can be utilized to distin-guish the bone from matrix within the point cloud data. Manipulation of the data
within a digital environment allows for virtual reconstruction of quarry sites and skeletons. In addition, dinosaur footprints can be documented in this manner. Laser scans can be incorporated with other documentation methodologies, resulting in highly accurate data capture. The point cloud data can be utilized to generate a digital surface upon which images can be draped. Three-dimensional laser imaging technology shows great promise for the documentation, study, interpretation, and archiving of paleontological resources.
Conclusion
Close-range photogrammetry, as well as other scientific observations, has been integrated into a real-world, rectangular coordinate system that provides the frame-work for a GIS of the RGDT. The GIS is used to analyze the relationships of the scientific data in 3-D space, and to build 3-D models of select tracks found at the site. Detailed measurements, such as DTMs and topographic contours, can be produced for the individual tracks. These models preserve information about the footprints that may be lost through time as the result of illegal collection, vandalism, erosion, and human interaction, and can be used to monitor and manage the RGDT in the future. The 3-D data collected, whether from photogrammetric analysis or laser scanning techniques conducted systematically over a number of years, will provide insights into the effects of weathering, including a quantifiable volume of surface material removed (Inkpen 2000). As the data are in a digital format, they can be viewed at a variety of scales and rotated, allowing observation at any angle. In addition, the digital data file and the image-draped surface can be distributed over the Internet, where the virtual fossil tracks or bones can be made available to researchers around the world, as well as the public, to study and enjoy. In addition, 3-D data can be used for automated casting to produce solid models (Chapman 1997).
Incorporating GIS documentation with traditional ichnology research methods in the course of the study at the RGDT has resulted in one of the most precise ap-proaches ever for measuring, recording, and evaluating fossil tracks. In addition, various track documentation methodologies utilized at the RGDT are being com-pared as to their utility. State-of-the-art technology used at this site has resulted in the RGDT gradually becoming one of the most extensively documented dinosaur tracksites in the world.
Paleontological sites, although “withstanding the sands of time,” can be ephemeral due to erosion, vandalism, development, and casual human interest. In order to preserve the value of these important scientific and education resources, detailed 3-D data can be captured through the use of close-range photogrammetry. This imagery, combined with surveyed ground control, can be incorporated into a GIS for viewing and analysis. Close-range photogrammetry and GIS are being utilized at the RGDT and a Jurassic bonebed in northern Wyoming. In addition, 3-D laser imaging also shows exciting potential in the documentation, archiving, and research of paleon-tological resources.
Acknowledgments
Appreciation is extended to the students and volunteers who made these projects a success. Gratitude is extended to various BLM representatives, especially those of the Worland and Cody offices, for their help in arranging, funding, and participating in parts of this project. Beth Southwell and Thomas Adams (vertebrate ichnology), Nick Fraser (bonebed paleontology), Terry Lumme (blimp photography), and Roger Moore and Chess Neff (laser scans) were instrumental in the facilitation of various areas of this study.
References
Breithaupt, B.H., E.H. Southwell, T.L. Adams, and N.A. Matthews. In press. Inno-vative documentation methodologies in the study of the most extensive dinosaur tracksite in Wyoming. Sixth Conference on Fossil Resources Proceedings.
Chapman, R.E. 1997. Technology and the study of dinosaurs. Pp. 112-135 in The
Complete Dinosaur. J.O. Farlow and M.K. Brett-Surman, eds. Bloomington:
In-diana University Press.
Darton, N.H. 1899. Jurassic formations of the Black Hills of South Dakota.
Geologi-cal Society of America Bulletin 10, 383-396.
Friedman, S.J. 1980. Automation of the photogrammetric process. In Manual of
Photogrammetry. C .C. Slama, ed. Falls Church, Va.: American Society of
Pho-togrammetry.
Inkpen, R.J., P. Collier, and D. Fontana. 2000. Close-range photogrammetric analy-sis of rock surfaces. Zeitschrift für Geomorphologie 120, 67-81.
Lockley, M. 1991. Tracking Dinosaurs. Cambridge, U.K.: Cambridge University Press.
Matthews, N.A., and B.H. Breithaupt. In press. Close-range photogrammetric ex-periments at Dinosaur Ridge. The Mountain Geologist 38:3.
Naus, M.T., N.A. Matthews, and B. Southwell. 1999. Integrated digital spatial analysis methods applied to the study of a dinosaur track bearing horizon in the Middle Jurassic Lower Sundance Formation of the Bighorn Basin (abstract). Geological Society of America Meeting, Denver. Abstracts with Programs 31:7, A-80.
Schmude, D.E. 2000. Interplay of paleostructure, sedimentation and preservation of Middle Jurassic Rocks, Bighorn Basin, Wyoming. The Mountain Geologist 37:4, 145-155.
Shubin, N., and Sues, H. D. 1991. Biogeography of early Mesozoic continental tetrapods: patterns and implications. Paleobiology 17, 214-230.