HAL Id: hal-01837505
https://hal.archives-ouvertes.fr/hal-01837505
Submitted on 26 May 2020
HAL is a multi-disciplinary open access
archive for the deposit and dissemination of sci-entific research documents, whether they are pub-lished or not. The documents may come from teaching and research institutions in France or abroad, or from public or private research centers.
L’archive ouverte pluridisciplinaire HAL, est destinée au dépôt et à la diffusion de documents scientifiques de niveau recherche, publiés ou non, émanant des établissements d’enseignement et de recherche français ou étrangers, des laboratoires publics ou privés.
Size-characterization of natural and synthetic
polyisoprenes by Taylor dispersion analysis
Jean-Philippe Biron, Frédéric Bonfils, Luca Cipelletti, Hervé Cottet
To cite this version:
Jean-Philippe Biron, Frédéric Bonfils, Luca Cipelletti, Hervé Cottet. Size-characterization of natural and synthetic polyisoprenes by Taylor dispersion analysis. Polymer Testing, Elsevier, 2018, 66, pp.244-250. �10.1016/j.polymertesting.2018.01.017�. �hal-01837505�
Version postprint
Accepted Manuscript
Size-characterization of natural and synthetic polyisoprenes by Taylor dispersion analysis
Jean-Philippe Biron, Frédéric Bonfils, Luca Cipelletti, Hervé Cottet PII: S0142-9418(17)31611-2
DOI: 10.1016/j.polymertesting.2018.01.017
Reference: POTE 5303 To appear in: Polymer Testing
Received Date: 12 November 2017 Accepted Date: 22 January 2018
Please cite this article as: J.-P. Biron, Fréé. Bonfils, L. Cipelletti, Hervé. Cottet, Size-characterization of natural and synthetic polyisoprenes by Taylor dispersion analysis, Polymer Testing (2018), doi: 10.1016/ j.polymertesting.2018.01.017.
This is a PDF file of an unedited manuscript that has been accepted for publication. As a service to our customers we are providing this early version of the manuscript. The manuscript will undergo copyediting, typesetting, and review of the resulting proof before it is published in its final form. Please note that during the production process errors may be discovered which could affect the content, and all legal disclaimers that apply to the journal pertain.
Version postprint
M
AN
US
CR
IP
T
AC
CE
PT
ED
ACCEPTED MANUSCRIPT
Analysis MethodSize-characterization of natural and synthetic polyisoprenes by Taylor
dispersion analysis
Jean-Philippe Biron1, Frédéric Bonfils2, Luca Cipelletti3 and Hervé Cottet1*
1
IBMM, University of Montpellier, CNRS, ENSCM, Montpellier, France
2
IATE, University of Montpellier, CIRAD, INRA, Montpellier Sup Agro, Montpellier, France
3
L2C, University of Montpellier, CNRS, Montpellier, France
*
CORRESPONDING AUTHOR: Prof. Hervé Cottet
Version postprint
M
AN
US
CR
IP
T
AC
CE
PT
ED
ACCEPTED MANUSCRIPT
ABSTRACT: Non-aqueous Taylor dispersion analysis (TDA) was used for the
size-characterization of natural and synthetic polyisoprenes (4×10³ - 2×10⁶ g/mol molar mass). Not only the weight-average hydrodynamic radius (Rh), but also the probability distribution of
the hydrodynamic radius, were both derived from the Taylorgrams by a simple integration of the elution profile and by a more sophisticated constrained regularized linear inversion of the Taylorgram, respectively. Results in terms of size characterization (hydrodynamic radii between 2 and 100 nm) were compared to size exclusion chromatography coupled to a refractive index-based mass detector. Multimodal size distributions were resolved by TDA for industrial and natural polyisoprenes, with the advantage over the chromatographic technique that, in TDA, there is no abnormal elution of microaggregates (hydrodynamic radii ~ 40-50 nm). Considering the importance and the difficulty of characterizing polyisoprene microaggregates, TDA appears as a promising and simple technique for the characterization of synthetic and natural rubber.
Key Words: polyisoprene; natural rubber; Taylor dispersion analysis; hydrodynamic radius;
diffusion coefficient; size distribution.
Version postprint
M
AN
US
CR
IP
T
AC
CE
PT
ED
ACCEPTED MANUSCRIPT
1
Introduction
Natural rubber (NR) is a biopolymer produced from latex of Hevea brasiliensis trees. NR is used to prepare many goods, the main one being tires that absorb nearly 70 % of the 12 million tons annually worldwide. As an agro-material produced by a tree, NR exhibits rather variable properties for many reasons (genotype of the tree [1-2], season [3], maturation of coagula [4-6], etc.). Thus, as for other polymeric materials used in industrial applications, it is important to characterize the NR macromolecular structure as a prelude to predicting NR end-use properties [7-8].
Natural rubber has a very specific associative structure. When dispersed in good solvents for polyisoprene, NR presents a soluble fraction and an insoluble fraction, often referred to as “macrogel” [9-10] or “gel phase” [11-12]. The composition of the soluble part is also specific as it contains two main entities: (i) polyisoprene linear macromolecules of different lengths, with a random coil structure, and (ii) very compact microaggregates or microgels (sphere-like structure) [13-15]. Links between non-isoprene compounds (lipids, proteins, and/or mineral elements) and the polyisoprene chains are thought to be the main reason for the macrogel formation in NR [12, 16-17]. Although an international standard (ISO 16564) exists to characterize the NR macromolecular structure by size exclusion chromatography (SEC) or gel permeation chromatography (GPC), the development of new analytical techniques is still required to improve the characterization of NR using orthogonal or complementary methods.
This paper describes a novel method to characterize the NR macromolecular structure: Taylor dispersion analysis in organic solvent. Taylor Dispersion Analysis (TDA) is an absolute sizing method requiring no calibration and allowing the determination of the diffusion coefficient (or, equivalently, the hydrodynamic radius) of solutes of any size between one angstrom and a few hundred nanometers. TDA is based on the dispersion of a sample band in an open tubular column under Poiseuille flow. The combination of the dispersive parabolic velocity profile with the molecular diffusion of the solute leads to a specific dispersion, called Taylor dispersion. Started with the pioneering work of Taylor on macroscopic tubing [18], TDA is now implemented in narrow capillaries (typically 50 µm internal diameter), leading to much faster analysis (a few min) and requiring only tiny sample amounts (a few nL)
[19-22]. In its modern miniaturized version, TDA can be very easily implemented on commercial
capillary electrophoresis apparatus. Alternatively, fast TDA can be performed on HPLC equipment at a high linear velocity (~30 cm s-1) in a coiled open capillary tube of 250 µm i.d. × 30 m typical dimensions, as recently introduced by the Holyst group [23]. In the latter
Version postprint
M
AN
US
CR
IP
T
AC
CE
PT
ED
ACCEPTED MANUSCRIPT
configuration, the genuine conditions for the applicability of TDA are not fulfilled [24], however, an empirical correction can be used to get the correct diffusion coefficient [23]. TDA was applied to the characterization of proteins [25-27], macromolecules [28-30], drug delivery systems [31, 32], nanoparticles [21, 33, 34], polyelectrolyte complexes and polyplexes [35], pharmaceutical compounds [36, 37], and micelles or microemulsions [38,
39]. It can also be used for the study of molecular interactions [40, 41]. The application of
TDA is not limited to water-soluble solutes, as demonstrated by the size characterization of polystyrenes in THF [28], asphaltenes/bitumen in hexane or THF/acetonitrile mixtures [42,
43], and drugs in pharmaceutical solvents [36]. Basically, TDA yields the weight average
hydrodynamic radius when using a mass sensitive detector, such as a UV detector, for a polymer absorbing via the repeating unit [44]. This information is obtained by simple integration of the elution temporal profile (also called Taylorgram). However, we recently demonstrated that more sophisticated data analyses allow one to determine the full hydrodynamic radius distribution, thus providing valuable information on the sample polydispersity [45, 46].
In this work, we demonstrate that TDA can be used to get, within a few minutes, the hydrodynamic radius distributions of commercial natural and synthetic polyisoprenes. The data obtained by TDA are compared to those derived from size exclusion chromatography (SEC) coupled to multi-angle static light scattering (MALS).
2
Experimental
2.1
Materials
The two NR samples used for this study were all TSR (Technically Specified Rubber). Sample NR1 was industrial TSR10 grade prepared by natural coagulation of latex followed by several days of coagulum maturation before processing. This sample was treated with neutral hydroxylamine sulfate (NHS) to stabilize its properties during storage, yielding a TSR10CV grade (CV stands for constant viscosity), a special grade not prone to storage hardening. Sample NR2 was prepared by acid coagulation (formic acid) of fresh field latex. Neutral hydroxylamine sulfate (NHS) was added to the latex prior to coagulation to inhibit storage hardening of rubber [47]. Sample NR2 was TSR5CV grade. Three synthetic industrial cis-1,4-polyisoprenes (PI) were used directly as received: IR2200 (NatSyn 2200, Goodyear chemical), IR307 and IR309 (Kraton polymers). Standard linear polyisoprene (PI) of 4.5, 22, 111, 307, 361, 608 and 766 × 103 g/mol weight-average molar masses were obtained from Polymer Standard Service (PSS, Germany) and were used as received.
Version postprint
M
AN
US
CR
IP
T
AC
CE
PT
ED
ACCEPTED MANUSCRIPT
2.2
Determination of the number- and weight-average molar
mass by size exclusion chromatography coupled to multi-angle
light scattering (SEC-MALS)
For all samples, the macromolecular structure was characterized by SEC-MALS, except for standard polyisoprene, for which the number average, Mn, and mass-average, Mw, molar
mass were given by the supplier. The samples (30 ± 5 mg), from NR pellets, were dissolved in tetrahydrofuran (THF, 30 mL, HPLC grade, VWR France) stabilized with 2,6-di-tert-butyl-4-methylphenol (BHT). The solutions were stored for 7 days in the dark at 30°C (during storage, the samples were stirred for 1 h/day), they were then filtered (Acrodisc 1 µm, glass fiber, Pall France) and finally injected into the SEC-MALS apparatus. For each sample, three solutions were independently prepared and measured. The SEC equipment comprises an online degasser (EliteTM, Alltech), a Waters 515 pump, a refractive index detector (Waters 2410) and a multi-angle light scattering detector (Dawn DSP, Wyatt Technology). Two Waters HMW6E columns (Styragel HMW columns packed 20 µm particles, 300 mm x 7.8 mm I.D.), maintained at 45°C, and a guard column (same stationary phase as the two separation columns) were used. The mobile phase was stabilized THF injected at a flow rate of 0.65 mL.min-1; the injected volume was 150 µL. The MALS detectors at all 18 angles were calibrated using a THF solution of a polystyrene standard with low polydispersity (Mw = 30.3
kg.mol-1, Wyatt technology). The same solution was used to determine the interconnection volume between the two detectors (0.235 mL). The basic theory of determining the weight-average molar mass and radius of gyration for a dilute solution of a macromolecule is well known and described in numerous papers in the literature [48, 49]. The weight average molar masses and radius of gyration at each slice of the chromatogram were calculated using the Berry method for extrapolation, as implemented in ASTRA software (version 5.3.1, Wyatt technology). The order of polynomial fit for the Berry analysis was two. Twelve angles, from 38.8° to 138.8°, were used for the analysis. The differential refractive index increment at λ = 633 nm was dn/dc = 0.130 mL.g-1 [50].
2.3
Determination of the weight-average hydrodynamic radius
R
hand of the
R
hdistribution by Taylor dispersion analysis
TDA experiments were performed on a PACE MDQ Beckman Coulter (Fullerton, CA) apparatus. Capillaries were prepared from bare silica tubing purchased from Composite Metal Services (Worcester, United Kingdom). The capillary dimensions were 40 cm (30 cm to the detector) × 50 µm I.D. New capillaries were conditioned with the following flushes: 1 M
Version postprint
M
AN
US
CR
IP
T
AC
CE
PT
ED
ACCEPTED MANUSCRIPT
NaOH for 30 min and water for 10 min. Before sample injection, the capillary was filled with cyclohexane (8.62 × 10⁻⁴ Pa.s viscosity). Between two TDA analyses, the capillary was flushed with cyclohexane (30 psi for 2 min). A mobilization pressure of 1 psi (~71 mbar) was applied with cyclohexane vials at both ends of the capillary, resulting in a flow rate of 184 nL.min-1. Samples were dissolved in cyclohexane at a concentration of 1 g/L. Sample injection (2.8 nL) was performed hydrodynamically on the inlet side of the capillary (0.3 psi for 3 s; ~1% of the capillary volume). Solutes were monitored by UV absorbance at a wavelength of 200 nm. The elution time was systematically corrected for the delay in the application of the pressure (pressure ramp time, 15 s) by subtracting 7.5 s (half-time of the pressure ramp) to the recorded elution time. The temperature of the capillary cartridge was set at 25 °C.
Two different methods were used to determine the weight-average hydrodynamic radius by TDA. The first method (method 1) is based on the integration of the Taylorgram [22], and the second method (method 2) is based on a deconvolution of the Taylorgram using a recently published Constrained Regularized Linear Inversion (CRLI) method [45].
In method 1, the average diffusion coefficient D is obtained by integration of the Taylorgram (or temporal elution profile) in order to calculate the temporal variance of the Taylorgram,
2
σ
. The integration of the elution profile was performed using the discrete form of the following equation [22]:(
) (
)
(
)
2 2 0 0 1 2 1 ( )( ) ( ) m i i i i i n m i i i i n S t t t dt S t t t t S t dt S t tσ
= + + = − − − = = −∑
∫
∑
∫
(1)where S(t) is the detector response, tiis the elution time for a given point i of the Taylorgram
and t0 is the average elution time. n and m are the starting and ending points that are
considered for the integration of the Taylorgram.
The integration of the Taylorgram was only performed on the left part of the elution profile (the end point was t0), before and after subtracting the Gaussian contribution due to the
small molecules (see results and discussion section). Corrections of the temporal variance and average detection time due to the injected volume were also taken into account, as described elsewhere [29], but these corrections are negligible when the injected volume is ≤ 1% of the capillary volume to the detection point [22], as is the case here. Finally, the so called Taylor average diffusion coefficient
TDA
D
is obtained from: 2 o 2 24 c TDA R t Dσ
= (2)Version postprint
M
AN
US
CR
IP
T
AC
CE
PT
ED
ACCEPTED MANUSCRIPT
Equation (2) is valid as far as 0
2 1 25
C
TDA
D t
.
R ≥ [18, 24] to ensure that the analysis time is
larger than the characteristic diffusion time of the solutes over the capillary cross section. Equation (2) is also only valid if the axial diffusion can be neglected compared to the Taylor dispersion contribution. This latter condition is fulfilled if C
40
TDA
R u
D
≥
, where u is the linearvelocity of the mobile phase [18, 24]. It is worth noting that the Taylor average diffusion coefficient obtained by integration of the Taylorgram (method 1) is a weight harmonic average diffusion coefficient defined by:
( )
1 1 1 1 0 D TDAD
D
P D D dD
− − ∞ −
−
=
=
∫
(3)where
P D
D( )
is the (mass-weighted) probability distribution function (PDF) of the diffusion coefficient. The TDA weight-average hydrodynamic radius <Rh>TDA is finally determinedusing the Stokes-Einstein relationship:
6
B h TDA TDAk T
R
D
πη
=
(4)where kB is the Boltzmann constant, T the temperature (K) and η the viscosity of the carrier
liquid (Pa.s).
Method 2 is based on a recently developed Constrained Regularized Linear Inversion (CRLI) approach [45]. This method allows the PDF of the hydrodynamic radius to be extracted from the experimental Taylorgrams. In brief, this method consists of introducing additional constraints in the usual least-squares fitting of the Taylorgram (“regularization”), in order to reject non-physical solutions, finally converging to the desired PDF of the hydrodynamic radius,
P
R( )
R
h . Typically, the constraints penalize those solutions for which∂
2P
R∂
R
2 is, on average, too large, i.e. those PDFs that exhibit too detailed a structure, see Ref. [45] for more details.The CRLI algorithm inverts the following relationship relating the Taylorgram to PR(Rh) [45]:
( )
( )
(
0)
2 0 exp d π R h R R tot R h h h P R t t k m S t R Q R Rλ
λ
∞ − = − ∫
(5)where kR is the detector response factor, mtot the total sample mass injected, Q the carrier
liquid flow-rate and with 2 0
2
π
B R ck T
R t
λ
η
=
(6)Version postprint
M
AN
US
CR
IP
T
AC
CE
PT
ED
ACCEPTED MANUSCRIPT
After normalization, eq. (5) reduces to:
( )
( )
( )
( )
(
0)
2 0 0 exp d R h R R h h h P R t t S t s t c R S t R Rλ
∞ − = = − ∫
(7) with( )
1 1 1 2 0d
R h R h h hP
R
c
R
R
R
− ∞ − −
=
=
∫
(8)The PDFs of Rhreported in the following are obtained by averaging individual distributions
measured in 2 to 5 independent repetitions. For each sample, a mass-average Rh value was
calculated from
P
R( )
R
h , via:( )
( )
0 0d
d
h R h h h CRLI R h hR
P
R
R
R
P
R
R
∞ ∞×
=
∫
∫
(9)3
Results and discussion
Our main objective is to compare the average radii and the Rh PDFs obtained by SEC and by
TDA on different PI standards, industrial PI and natural rubbers (NR).
3.1
Determination of the average hydrodynamic radius by TDA
Examples of raw Taylorgrams obtained for the polyisoprene (PI) standards are displayed in Figure 1A. Each Taylorgram has been normalized by the maximum absorbance at t=t0. A
quite good baseline return and peak symmetry is seen in Figure 1A. It is clearly observed that the higher the molar mass, the broader the Taylorgram, due to the higher Taylor dispersion for the species with lower diffusion coefficient. Nevertheless, some PI standards contain a tiny amount of small molecules (possibly monomers, residual solvent) absorbing at the detection wavelength (200 nm). This small molecule contribution appears as a thin peak, most notable for the 361 and 766 × 103 g/mol PI standards (blue and green lines in Figure 1A). The contribution due to the small molecules should not be taken into account in the data analysis. Accordingly, we systematically corrected for it by subtracting the corresponding Gaussian peak from the raw data, leading to the Taylorgrams presented in
Version postprint
M
AN
US
CR
IP
T
AC
CE
PT
ED
ACCEPTED MANUSCRIPT
Figure 1B [51]. The corresponding weight-average hydrodynamic radii obtained by integration of the Taylorgrams presented in Figure 1B (method 1,
R
h TDA) are gathered in Table 1. For the sake of comparison, the Rh values obtained without subtraction of the smallmolecule contribution are also given in Table 1. The impact of the small molecule contribution on the average Rh value is less than 3%.
<Figure 1>
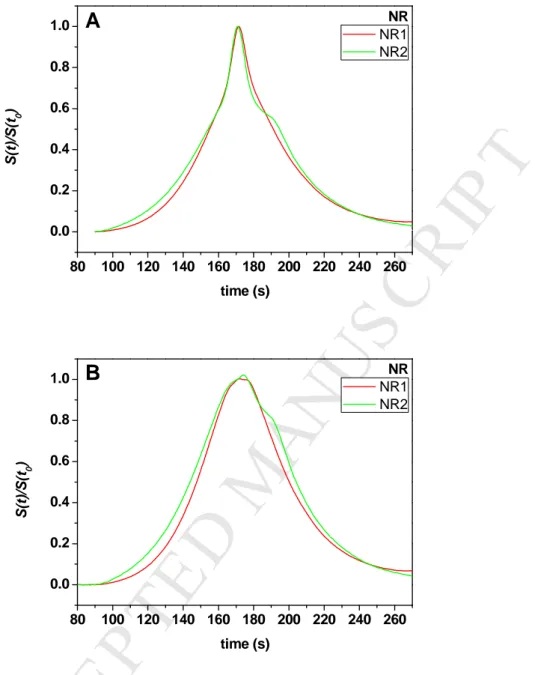
The same data processing was applied to the industrial PI samples (IR2200, IR307 and IR309) and the natural rubber samples (NR1 and NR2). The raw Taylorgrams and the corrected ones are displayed in Figures 2A and 2B for industrial PI, and Figures 3A and 3B for NR, respectively. It should be noticed that the symmetry of the Taylorgrams was not perfect, especially in the case of NR. This may be due to some polymer adsorption onto the capillary surface. This is why the Taylorgrams were analyzed on the left part, where adsorption has a much lower impact. The contribution of the small molecules to the average Rh value is less than 6% (see Table 1). The correlation between the hydrodynamic radius
(method 1,
R
h TDA) and the PI weight average molar mass (Mw, SEC) is given in Figure 4.For a random coil in a good solvent, the theoretical value of the exponent b of the power law b
h w
R
=
aM
is predicted to be 0.588 [52]. This value was confirmed experimentally using light scattering, for PI in cyclohexane (Fetters et al., b=0.592 [53]) and in tetrahydrofuran (Kim et al., b = 0.606 [14]). In our experiments, we find an exponent b=0.54+/-0.06 (confidence interval at 95%) for the seven PI standards, slightly lower than the expected theoretical value. Industrial PI grades and NR samples are close to the scaling law obtained for the PI standards (see Figure 4).<Table 1> <Figure 2> <Figure 3> <Figure 4>
3.2
Hydrodynamic radius distributions obtained by TDA and
comparison with SEC
The elution profile in SEC gives access to the size distribution of the polymers, since the separation parameter in SEC is the hydrodynamic volume of the solute. For the SEC
Version postprint
M
AN
US
CR
IP
T
AC
CE
PT
ED
ACCEPTED MANUSCRIPT
measurements, THF was used as the eluent. THF gives a higher signal for the LS and refractive index analysis, thanks to a higher dn/dc compared to cyclohexane. For the TDA analysis, by contrast, cyclohexane is the best choice, since THF is incompatible with UV detection and with the TDA setup (THF dissolves the MDQ Beckman Coulter plastic interface in contact with the sample and eluent vials). In spite of the need to use different solvents, the comparison between the TDA and SEC-MALS results for the same PI and rubber samples sheds light on the strengths and limitations of each method.
In SEC, the logarithm of the hydrodynamic radius is a decreasing linear function of the elution volume. In the elution profile, the refractive index (RI) detector yields a signal proportional to the polymer mass concentration. The MALS detector combined with the RI detector allows the polymer molar mass to be measured. All the 3 industrial PI analyzed by SEC-MALS exhibited a main peak eluting at about 16-17 min, followed by one or two other modes eluting between 18-22 min, which were more or less separated depending on the sample. IR309 appeared as a tri-modal elution profile (see Figure 5A), while the two other samples (IR307 and IR2200) presented unresolved shoulders. Figure 5B shows hydrodynamic radius (Rh) mass-distributions obtained by SEC assuming that Rg/Rh = 1.78, as
expected for monodisperse random coils in good solvent [52]. Indeed, SEC coupled to a MALS detector allows determining, for each slice of the chromatogram, both the molar mass (Mi) and the radius of gyration (Rgi). The Rhi were calculated from the Rgifor each slice of the
chromatogram using Rg/Rh = 1.78 relationship. In the SEC analysis, all samples display
rather broad distributions with an unresolved shoulder for IR2200 and IR307, and three partially resolved modes for IR309. The Rh corresponding to the peak maximum for the
mass-distribution of Rh determined from the SEC data (Figure 5B) were 32 nm for IR2200,
45 nm for IR309 and 47 nm for IR307.
Figure 5C displays the hydrodynamic radius distributions obtained by TDA after data processing of the Taylorgrams from Figure 2A according to method 2 (CRLI, see section 2.3). Size distributions obtained by TDA display two well-defined main modes, and a less important (minor) third mode (see inset of Figure 5C), corresponding to low molar mass polymers (oligomers) or monomers with Rhbelow 3 nm. These oligomers/monomers appear
as a sharp peak in the Taylorgrams presented in Figure 2A. All IR samples display a main mode at Rh ranking between 30 and 50 nm (peak apex at 34.8 nm for IR 2200, 41.4 nm for
IR 309 and 42.3 for IR 307). These Rh values are in reasonably good agreement with SEC
analysis, given that the solvents are different and taking into account the uncertainty in the actual value of Rg/Rh required to calculate the RhPDF from the SEC data. A second mode in
the Rh distribution was observed by TDA, corresponding to sizes between 5 and 11 nm (peak
Version postprint
M
AN
US
CR
IP
T
AC
CE
PT
ED
ACCEPTED MANUSCRIPT
resolved in the PDF calculated from the SEC data, except perhaps for the IR 309 sample, which exhibits a pronounced shoulder in the 10-20 nm range. Overall, TDA showed was better resolution for the size characterization of the IR samples compared to SEC.
<Figure 5>
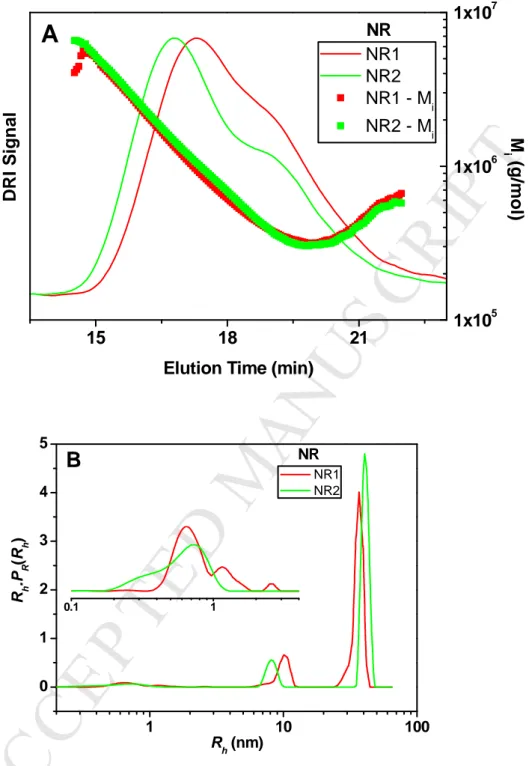
For natural rubber (NR) samples, the TDA analysis again gave Rh profiles with better size
resolution than those retrieved from the SEC elution profiles (Figure 6). The SEC data exhibited elution profiles rather unimodal, with a more or less pronounced shoulder. Unlike the PI industrial samples, for the NR samples, it is not possible to assume that each slice of the chromatogram is only composed of monodisperse random coils, because of the co-elution of microaggregates and random coil macromolecules [13]. For this reason, it was not possible to calculate the Rh PDF. By contrast, in TDA, Rh is directly determined, with no
need of making any assumptions on the nature of the sample (e.g. on the presence of aggregates). As displayed in Figure 6B, the NR samples had trimodal Rh profiles with small
oligomers (Rh below 2-3 nm) and two larger polymer modes at 7–10 nm and 20–60 nm,
respectively. Remarkably, the TDA analysis reveals unambiguous differences in the position and the width of the peaks for the two samples, not captured by SEC. In particular, the peak for the largest sizes shifts from 37 nm for NR1 to 40 nm for NR2. As explained above, it was not possible to determine the Rh PDF from the SEC data. However, we note that the ranking
in the SEC elution curves is consistent with the TDA data, since NR2 is eluted before NR1, indicative of a larger size.
From the Rh distribution obtained by method 2, it is also possible to determine a
weight-average Rh by integration on the whole distribution (see Eq. 9). We exclude the contribution
of the small molecules, Rh < 3 nm, consistentl with the subtraction performed in method 1.
The results are presented in Table 1: we find a difference of less than 3% between the two methods. This demonstrates the excellent agreement between the two different ways to process the Taylorgrams, thereby confirming the robustness of the methods of analysis presented here.
<Figure 6>
4
Conclusions
We have demonstrated that TDA can be used in non-aqueous media (cyclohexane in the present study) for the analysis of PI in industrial and natural rubbers. Because TDA is implemented in open capillary tubes, it is much less influenced by undesirable interactions as compared to SEC, where microaggregates from NR samples (hydrodynamic radii ~40-50 nm)
Version postprint
M
AN
US
CR
IP
T
AC
CE
PT
ED
ACCEPTED MANUSCRIPT
may result in abnormal elution curves at large elution times. By leveraging on the constrained regularized linear inversion (CRLI) method, not only does TDA give access to the weight average hydrodynamic radius, it also provides the full hydrodynamic radius distribution. While under some conditions SEC data can yield the PDF of Rh, the present work shows that TDA has a broader applicability and a superior ability to resolve the various modes contributing to the sample size distribution in a large range of hydrodynamic radii from ~1 to 100 nm. Given the strengths of the method and the advantages of modern TDA in its miniaturized version (low sample volume ~nL, low solvent consumption, fast analysis (a few min), absolute determination, simple instrumentation and straightforward methodology), there is no doubt that TDA holds great potential for quality control and production monitoring of PI in the rubber industry. Possible future work could be to investigate new capillary coatings and/or capillary i.d. to improve the peak symmetry, especially in the case of NR analysis.
References
[1] C. Kim, M. Morel, J. Sainte Beuve, S. Guilbert, F. Bonfils, Better Characterization of Raw Natural Rubber by Decreasing the Rotor Speed of Mooney Viscometer: Role of Macromolecular Structure, Polym Eng Sci, 50 (2010) 240-248.
[2] C.M. Lotti, R.M.B. Moreno, P.S. Gonçalves, S. Bhattacharya, L.H.C. Mattoso, Extensional Rheology of Raw Natural Rubber From New Clones of Hevea brasiliensis, Polym Eng Sci, 52 (2012) 139-148.
[3] M. Ferreira, R.M.B. Moreno, P.S. Gonçalves, L.H.C. Mattoso, Evaluation of natural rubber clones of Hevea brasiliensis, Rubb Chem Technol, 75 (2002) 171-178.
[4] E.E. Ehabe, Y. Leroux, F. Ngolemasango, F. Bonfils, G. Nkeng, B. Nkouonkam, J. Sainte Beuve, Effect of the maturation on the bulk viscosity and molecular chain length of cuplump NR, J Appl Polym Sci, 86 (2002) 703-708.
[5] Jie-Ping Zhong, Si-Dong Li, Ling-Xue Kong, Lei Yang, Shuang-Quan Liao, Xiao-Dong She, Study on the Properties of Natural Rubber during Maturation, J Polym Mater, 26 (2009) 351-360.
[6] J. Intapun, J. Sainte Beuve, F. Bonfils, V. Tanrattanakul, E. Dubreucq, L. Vaysse, Effect of micro-organisms during initial coagula maturation of Hevea natural rubber, J Appl Polym Sci, 118 (2010) 1341-1348.
[7] K.N.G. Fuller, Rheology of raw rubber, in: A. Roberts (Ed.) Natural Rubber Science and Technology, Oxford University Press, Oxford, 1988, pp. 141-176.
[8] L. Vaysse, F. Bonfils, J. Sainte-Beuve, M. Cartault, Natural Rubber, in: K. Matyjaszewski, M. Möller (Eds.) Polymer Science, A Comprehensive Reference, Elsevier BV, Amsterdam, 2012, pp. 281-293.
[9] P.W. Allen, G.M. Bristow, The gel phase in natural rubber, Rubb Chem Technol, 36 (1963) 1024-1034.
[10] E.E. Ehabe, F. Bonfils, Novel insight into the gel phase of hevea natural rubber, J Rubb Res, 14 (2011) 1-10.
[11] S. Amnuaypornsri, J. Sakdapipanich, S. Toki, B. Hsiao, N. Ichikawa, Y. Tanaka, Strain-induced crystallization of natural rubber: Effect of proteins and phospholipids, Rubb Chem Technol, 81 (2008) 753-766.
[12] Y. Tanaka, L. Tarachiwin, Recent advances in structural characterization of natural rubber, Rubb Chem Technol, 82 (2009) 283-314.
Version postprint
M
AN
US
CR
IP
T
AC
CE
PT
ED
ACCEPTED MANUSCRIPT
[13] C. Kim, M. Morel, J. Sainte Beuve, A. Collet, S. Guilbert, F. Bonfils, Characterization of natural rubber using size-exclusion chromatography with online multi-angle light scattering Study of the phenomenon behind the abnormal elution profile, J Chromato A, 1213 (2008) 181-188.
[14] C. Kim, J. Sainte Beuve, S. Guilbert, F. Bonfils, Study of chain branching in natural rubber using size-exclusion chromatography coupled with a multi-angle light scattering detector (SEC-MALS), Eur. Polym. J., 45 (2009) 2249–2259.
[15] S. Dubascoux, C. Thepchalerm, E. Dubreucq, S. Wisunthorn, L. Vaysse, S. Kiatkamjornwong, C. Nakason, F. Bonfils, Comparative study of mesostructure of natural and synthetic polyisoprene by SEC-MALS and AF4-MALS, J Chromato A, 1224 (2012) 27-34. [16] V.A. Grechanovskii, I.P. Dmitrieva, N.B. Zaitsev, Separation and preliminary characterisation of the protein component from commercial varieties of hevea rubber, International polymer science and technology, 14 (1987) 1-4.
[17] S.N. Gan, Storage hardening of Natural Rubber, J Membrane Sci, Pure Appl Chem, A33 (1996) 1939-1948.
[18] G. Taylor, Dispersion of Soluble Matter in Solvent Flowing Slowly through a Tube, Proceeding of the Royal Society of London Series A, 219 (1953) 186-203.
[19] M. Bello, R. Rezzonico,P. Righetti, Use of Taylor-Aris Dispersion for Measurement of a Solute Diffusion Coefficient in Thin Capillaries, Science, 226 (1994) 773-778.
[20] U.G. Sharma, N; Carbeck, J, Diffusivity of Solutes Measured in Glass Capillaries Using Taylor's Analysis of Dispersion and a Commercial CE Instrument , Anal Chem, 77 (2005) 806-813.
[21] F.V. d'Orlye, A. Varenne; P. Gareil, Determination of nanoparticle diffusion coefficients by Taylor dispersion analysis using a capillary electrophoresis instrument, J Chromatogr A, 1204 (2008) 226-232.
[22] H. Cottet, J. Chamieh, Comparison of Single and Double Detection Points of Taylor Dispersion Analysis for Monodisperse and Polydisperse Samples, J Chromatogr A, 1241 (2012) 123-127.
[23] A.M. Lewandrowska, A. Majchere, A. Ochab-Marcinek, et al. Taylor Dispersion Analysis in Coiled Capillaries at High Flow Rates, Anal Chem, 85 (2013) 4051-4056.
[24] H. Cottet, J-P Biron, M. Martin, On the optimization of operating conditions for Taylor dispersion analysis of mixtures, Analyst, 139 (2014) 3552-3562.
[25] W.L. Hulse, J. Gray, R.T. Forbes, Evaluating the inter and intra batch variability of protein aggregation behaviour using Taylor dispersion analysis and dynamic light scattering, International Journal of Pharmaceutics, 453 (2013) 351-357.
[26] W.L. Hulse, R.T. Forbes, A Taylor dispersion analysis method for the sizing of therapeutic proteins and their aggregates using nanolitre sample quantities, International Journal of Pharmaceutics, 416 (2011) 394-397.
[27] A. Lavoisier, J-M. Schlaeppi, Early developability screen of therapeutic antibody candidates using Taylor dispersion analysis and UV area imaging detection, mAbs, 7 (2015) 77-83.
[28] E.P.C. Mes, W.T. Kok, H. Poppe, et al., Comparison of methods for the determination of diffusion coefficients of polymers in dilute solutions: The influence of polydispersity, J Polym Sci, Part B Polym Physics, 37 (1999) 593-603.
[29] H. Cottet, M. Martin, A. Papillaud, et al. , Determination of dendrigraft poly-L-lysine diffusion coefficients by Taylor dispersion analysis, Biomacromolecules, 8 (2007) 3235-3243. [30] J. Deschamps, S.G. Dutremez, B. Boury, et al. , Size-Based Characterization of an Ionic Polydiacetylene by Taylor Dispersion Analysis and Capillary Electrophoresis, Macromolecules, 42 (2009) 2679-2685.
[31] F. Oukacine, S. Bernard, I. Bobe, et al., Physico-chemical characterization of polymeric micelles loaded with platinum derivatives by capillary electrophoresis and related methods, J Control Release, 196 (2014) 139-145.
Version postprint
M
AN
US
CR
IP
T
AC
CE
PT
ED
ACCEPTED MANUSCRIPT
[32] A. Ibrahim, R. Meyrueis, G. Pouliquen, et al., Size and charge characterization of polymeric drug delivery systems by Taylor dispersion analysis and capillary electrophoresis, Anal Bioanal Chem, 405 (2013) 5369-5379.
[33] B. Belongia, J. Baygents, Measurements on the Diffusion Coefficient of Colloidal Particles by Taylor-Aris Dispersion, J Colloid Interf Sci, 195 (1997) 19-31.
[34] F. Oukacine, A. Morel, I. Desvignes, et al. , Size-based characterization of nanoparticle mixtures by the inline coupling of capillary electrophoresis to Taylor dispersion analysis, J Chromatogr A, 1426 (2015) 220-225.
[35] L. Leclercq, S. Reinhard, J. Chamieh, et al., Fast Characterization of Polyplexes by Taylor Dispersion Analysis, Macromolecules, 48 (2015) 7216-7221.
[36] F. Ye, H. Jensen, S.W. Larsen, et al., Measurement of drug diffusivities in pharmaceutical solvents using Taylor dispersion analysis, J Pharmaceut Biomed Analysis, 61 (2012) 176-183.
[37] H. Jensen, S.W. Larsen, C. Larsen, et al., Physicochemical profiling of drug candidates using capillary-based techniques J Drug Deliv Sci Tec, 23 (2013) 333-345.
[38] J. Chamieh, F. Davanier, V. Jannin, et al., Size characterization of commercial micelles and microemulsions by Taylor dispersion analysis, Int J Pharmaceu, 492 (2015) 46-54. [39] K. MacEwan, D.G. Leaist, Quaternary mutual diffusion coefficients for aqueous solutions of a cationic-anionic mixed surfactant from moments analysis of Taylor dispersion profiles, Physical Chemistry Chemical Physics, 5 (2003) 3951-3958.
[40] N.N. Poulsen, N.Z. Andersen, J. Ostergaard, et al. , Flow induced dispersion analysis rapidly quantifies proteins in human plasma samples, Analyst, 140 (2015) 4365-4369.
[41] S. Latunde-Dada, R. Bott, D. Barker, et al., Methodologies for the rapid determination of the diffusion interaction parameter using Taylor dispersion analysis, Anal Methods, 8 (2016) 386-392.
[42] W.T. Kok, A.J. Tudos, M. Grutters, et al. , Characterization of Asphaltenes by Nonaqueous Capillary Electrophoresis, Energy & Fuels, 25 (2011) 208-214.
[43] M. Ghanavati, H. Hassanzadeh, J. Abedi, Application of taylor dispersion technique to measure mutual diffusion coefficient in hexane plus bitumen system, AIChE Journal, 60 (2014) 2670-2682.
[44] H. Cottet, J-P Biron, M. Martin, Taylor dispersion Analysis of mixtures, Anal Chem, 79 (2007) 9066-9073.
[45] L. Cipelletti, J-P Biron, M. Martin, et al., Measuring Arbitrary Diffusion Coefficient Distributions of Nano-Objects by Taylor Dispersion Analysis, Anal Chem, 87 (2015) 8489-8496.
[46] L. Cipelletti, J-P Biron, M. Martin, et al., Polydispersity Analysis of Taylor Dispersion Data: The Cumulant Method, Anal Chem, 86 (2014) 6471-6478.
[47] B.C. Sekhar, Inhibition of hardening in natural rubber, Rubb Chem Technol, 35 (1962) 889-895.
[48] P. Wyatt, Light scattering and the absolute characterization of macromolecules, Anal Chim Acta, 272 (1993) 1-40.
[49] Y. Yu, P. DesLauriers, D.C. Rohlfing, SEC-MALS method for the determination of long-chain branching and long-long-chain branching distribution in polyethylene, Polymer, 46 (2005) 5165-5182.
[50] C. Kim, A. Deratani, F. Bonfils, Determination of the refractive index increment of natural and synthetic poly(cis-1,4-isoprene) solutions and its effect on structural parameters, J Liq Chromatogr Related Technol, 33 (2010) 37-45.
[51] H. Cottet, J-P Biron, L. Cipelletti, et al. , Determination of Individual Diffusion Coefficients in Evolving Binary Mixtures by Taylor Dispersion Analysis: Application to the Monitoring of Polymer Reaction, Anal Chem, 82 (2010) 1793-1802.
[52] W. Burchard, Solution Properties of Branched Macromolecules, Adv Polym Sci, 143 (1999) 113.
Version postprint
M
AN
US
CR
IP
T
AC
CE
PT
ED
ACCEPTED MANUSCRIPT
[53] L.J. Fetters, N. Hadjichristidis, J.S. Lindner, J.W. Mays, Molecular Weight Dependence of Hydrodynamic and Thermodynamic Properties for Well-Defined Linear Polymers in Solution, J Phys Chem Ref Data, 23 (1994) 619-640.
Version postprint
M
AN
US
CR
IP
T
AC
CE
PT
ED
ACCEPTED MANUSCRIPT
Figures and Captions100 120 140 160 180 200 220 240 260 0.0 0.2 0.4 0.6 0.8 1.0 S (t )/ S (t 0 )
A
time (s) PI Standard PI Std 4.5 PI Std 111 PI Std 361 PI Std 766 100 120 140 160 180 200 220 240 260 0.0 0.2 0.4 0.6 0.8 1.0 S (t )/ S (t 0 ) PI StandardB
time (s) PI Std 4.5 PI Std 111 PI Std 361 PI Std 766Figure 1. Taylorgrams obtained for PI standards in cyclohexane before (A) and after
substraction of the contribution due to small molecules (B). Experimental conditions: fused silica capillary 40 cm (30 cm to the detector) x 50 µm i.d. Mobile phase: cyclohexane. Hydrodynamic injection: 0.3 psi, 3 s. Mobilization pressure: 1.0 psi. Temperature: 25 °C. Samples: PI standards 4.5, 111, 361, and 766 × 103 g/mol at 1 g/L in cyclohexane. Detection at 200 nm. The normalized taylorgram is presented (S(t)/S(t0)).
Version postprint
M
AN
US
CR
IP
T
AC
CE
PT
ED
ACCEPTED MANUSCRIPT
80 100 120 140 160 180 200 220 240 260 0.0 0.2 0.4 0.6 0.8 1.0A
S (t )/ S (t 0 ) time (s) IR307 IR309 IR2200 PI Industrial 80 100 120 140 160 180 200 220 240 260 0.0 0.2 0.4 0.6 0.8 1.0 S (t )/ S (t 0 ) PI Industrial IR307B
time (s) IR307 IR309 IR2200Figure 2: Taylorgrams obtained for industrial PI in cyclohexane before (A) and after
Version postprint
M
AN
US
CR
IP
T
AC
CE
PT
ED
ACCEPTED MANUSCRIPT
80 100 120 140 160 180 200 220 240 260 0.0 0.2 0.4 0.6 0.8 1.0 S (t )/ S (t 0 )A
time (s) NR1 NR2 NR 80 100 120 140 160 180 200 220 240 260 0.0 0.2 0.4 0.6 0.8 1.0 NR NR1 NR2B
S (t )/ S (t 0 ) time (s)Figure 3. Taylorgrams obtained for natural rubbers (NR) in cyclohexane before (A) and
after substraction of the contribution due to small molecules (B). Same conditions as in Figure 1.
Version postprint
M
AN
US
CR
IP
T
AC
CE
PT
ED
ACCEPTED MANUSCRIPT
Figure 4: Log-log plot of the TDA hydrodynamic radius (method 1, after subtraction of the
small molecule contribution) versus the molar mass for the PI standards, PI industrial and for NR. The dotted line is a power law fit for the PI standards. See Table 1 for the numerical values. y = 0.7984x0.5353 R² = 0.9919 1 10 100 1 10 100 1000 10000
R
h(n
m
)
M
w(10
3g/mol)
PI standard PI industriel NRVersion postprint
M
AN
US
CR
IP
T
AC
CE
PT
ED
ACCEPTED MANUSCRIPT
14 16 18 20 22 IR307 IR309 IR2200Elution Time (min)
D R I S ig n a l 1.0x10⁴ 1.0x10⁵ 1.0x10⁶ 1.0x10⁷ 1.0x10⁸ Industrial PI
A
0.1 1 10 100 0.0 0.2 0.4 0.6 0.8 1.0 R h .P R (R h ) Rh (nm) IR307 IR309 IR2200 Industrial PIB
0.1 1 10 100 -1 0 1 2 3 4 5 6 7 0.1 1 Industrial PIC
Rh (nm) R h .P R (R h ) IR 307 IR 309 IR 2200Version postprint
M
AN
US
CR
IP
T
AC
CE
PT
ED
ACCEPTED MANUSCRIPT
Figure 5: Elution profiles obtained by SEC (RI signal, A) and Rh distributions obtained by
SEC-MALS (B) or TDA using method 2 (C), for the 3 industrial PI samples. Experimental conditions: SEC in tetrahydrofuran, two Waters HMW6E columns (20 µm, 300 mm x 7.8 mm I.D.) maintained at 45°C, flow rate of 0.65 mL.min-1; TDA conditions as in Figure 2. The insert in Figure 2C is an expanded view. Rh distributions obtained by SEC-MALS are based on
Version postprint
M
AN
US
CR
IP
T
AC
CE
PT
ED
ACCEPTED MANUSCRIPT
15 18 21 NR1 NR2 NR1 - Mi NR2 - MiA
D R I S ig n a lElution Time (min)
NR 1x10⁵ 1x10⁶ 1x10⁷ M i ( g /m o l) 1 10 100 0 1 2 3 4 5 0.1 1 R h .P R (R h ) R h (nm) NR1 NR2
B
NRFigure 6: Elution profiles obtained by SEC (RI signal, A) and Rh distributions obtained by
TDA using method 2 (B) for two NR samples. Experimental conditions: SEC, see Figure 5; TDA, as in Figure 3. Insert in Figure 6B is an expanded view.
Version postprint
M
AN
US
CR
IP
T
AC
CE
PT
ED
ACCEPTED MANUSCRIPT
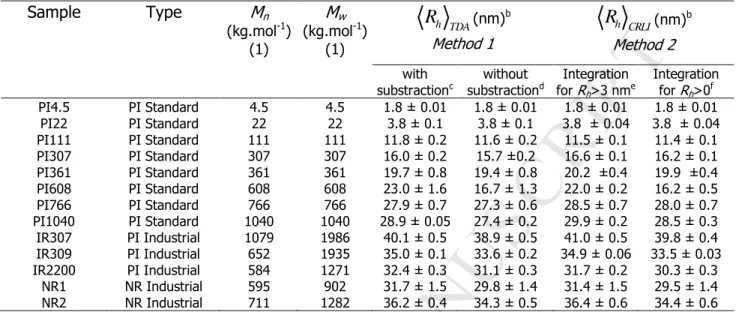
Table 1: Number- and weight-average molar masses (Mn, Mw), hydrodynamic radius (Rh +/-
one standard deviation) for natural and synthetic PI. Mn, Mw are determined by SEC-MALS,
except for the PI standardsa. Rh is determined by TDA, using both method.
a
For standard polyisoprene, all Mn and Mw were given by the supplier.
b
Three repetitions in average
c
Average Rh obtained by integration of the taylorgram after subtraction of the small molecule
contribution (method 1 applied to Figures 1B, 2B, 3B).
d
Average Rh obtained by integration from the whole taylorgrams including the small molecule
contribution (method 1 applied to Figures 1A, 2A, 3A).
e Average R
h obtained by method 2 (CRLI, eq. (9)) by integration of the PR(Rh) distribution for Rh
higher than 3 nm.
f
Average Rh obtained by method 2 (CRLI, eq. (9)) by integration of the whole PR(Rh) distribution.
Sample Type Mn (kg.mol-1) (1) Mw (kg.mol-1) (1) h TDA
R
(nm)b Method 1 (nm)b Method 2 with substractionc without substractiond Integration for Rh>3 nme Integration for Rh>0f PI4.5 PI Standard 4.5 4.5 1.8 ± 0.01 1.8 ± 0.01 1.8 ± 0.01 1.8 ± 0.01 PI22 PI Standard 22 22 3.8 ± 0.1 3.8 ± 0.1 3.8 ± 0.04 3.8 ± 0.04 PI111 PI Standard 111 111 11.8 ± 0.2 11.6 ± 0.2 11.5 ± 0.1 11.4 ± 0.1 PI307 PI Standard 307 307 16.0 ± 0.2 15.7 ±0.2 16.6 ± 0.1 16.2 ± 0.1 PI361 PI Standard 361 361 19.7 ± 0.8 19.4 ± 0.8 20.2 ±0.4 19.9 ±0.4 PI608 PI Standard 608 608 23.0 ± 1.6 16.7 ± 1.3 22.0 ± 0.2 16.2 ± 0.5 PI766 PI Standard 766 766 27.9 ± 0.7 27.3 ± 0.6 28.5 ± 0.7 28.0 ± 0.7 PI1040 PI Standard 1040 1040 28.9 ± 0.05 27.4 ± 0.2 29.9 ± 0.2 28.5 ± 0.3 IR307 PI Industrial 1079 1986 40.1 ± 0.5 38.9 ± 0.5 41.0 ± 0.5 39.8 ± 0.4 IR309 PI Industrial 652 1935 35.0 ± 0.1 33.6 ± 0.2 34.9 ± 0.06 33.5 ± 0.03 IR2200 PI Industrial 584 1271 32.4 ± 0.3 31.1 ± 0.3 31.7 ± 0.2 30.3 ± 0.3 NR1 NR Industrial 595 902 31.7 ± 1.5 29.8 ± 1.4 31.4 ± 1.5 29.5 ± 1.4 NR2 NR Industrial 711 1282 36.2 ± 0.4 34.3 ± 0.5 36.4 ± 0.6 34.4 ± 0.6 h CRLIR
Version postprint
M
AN
US
CR
IP
T
AC
CE
PT
ED
ACCEPTED MANUSCRIPT
1 2 Highlights 3• Sizing natural or synthetic polyisoprenes by miniaturized Taylor dispersion analysis 4
• Full hydrodynamic radius distribution of polyisoprenes from Taylor dispersion analysis 5
• Taylor dispersion analysis has a better size-resolution compared to SEC 6
• No abnormal elution of the microaggregates in Taylor dispersion analysis 7
• Short analysis time (a few min) and low sample and solvent consumption 8
9 10 11