HAL Id: hal-02411071
https://hal.archives-ouvertes.fr/hal-02411071
Submitted on 1 Apr 2020HAL is a multi-disciplinary open access archive for the deposit and dissemination of sci-entific research documents, whether they are pub-lished or not. The documents may come from teaching and research institutions in France or abroad, or from public or private research centers.
L’archive ouverte pluridisciplinaire HAL, est destinée au dépôt et à la diffusion de documents scientifiques de niveau recherche, publiés ou non, émanant des établissements d’enseignement et de recherche français ou étrangers, des laboratoires publics ou privés.
Prospects for a CEA and ROSATOM/IPPE
collaborative program on Na boiling for GEN IV SFRs
safety rationale and thermal-hydraulic preparatory work
M. Anderhuber, A. Gerschenfeld, Y. Gorsse, N. Alpy, Latge Christian, J.
Perez-Manes, Y. Kuzina, A. Sorokin, L. Berensky, A. Volkov, et al.
To cite this version:
M. Anderhuber, A. Gerschenfeld, Y. Gorsse, N. Alpy, Latge Christian, et al.. Prospects for a CEA and ROSATOM/IPPE collaborative program on Na boiling for GEN IV SFRs safety rationale and thermal-hydraulic preparatory work. NURETH-18, Aug 2019, Portland, United States. �hal-02411071�
PROSPECTS FOR A CEA & ROSATOM/IPPE COLLABORATIVE
PROGRAM ON NA BOILING FOR GEN IV SFRS SAFETY:
RATIONALE & THERMAL-HYDRAULIC PREPARATORY WORK
M. Anderhuber, A. Gerschenfeld, Y. Gorsse
Atomic and Alternative Energies Commission, Nuclear Energy Division, CEA Saclay
Université Paris-Saclay, F-91191 Gif-sur-Yvette, France
marine.anderhuber@cea.fr; antoine.gerschenfeld@cea.fr; yannick.gorsse@cea.fr
N. Alpy, C. Latge, J. Perez-Manes
Atomic and Alternative Energies Commission, Nuclear Energy Division, CEA Cadarache
F-13108 Saint-Paul-Lez-Durance, France
nicolas.alpy@cea.fr; christian.latge@cea.fr; jorge.perezmanes@cea.fr
Yu. Kuzina, A. Sorokin, l. Berensky, A. Volkov, Yu. Chernukhina, K. Raskach
I.I. Leypunsky Institute of Physics and Power Engineering, JSC «SSC RF – IPPE»
Bondarenko sq., 1, Obninsk, Kaluga region 249033, Russia
ukyzina@ippe.ru; sorokin@ippe.ru; berensky@ippe.ru; volkov@ippe.ru;
yuchernukhina@ippe.ru; kraskach@ippe.ru
ABSTRACT
The phenomenology of coolant boiling in the core of a Gen IV Sodium Cooled Fast Reactor (SFR) during an Unprotected Loss Of Flow transient (ULOF), has been the topic of regular exchanges between ROSATOM/IPPE and CEA since 2012. As an outcome, a new common experimental program (H
a
RIBO, which stands for Ha
ina
R-1 for BOiling) has been proposed to be performed on AR-1 facility in Obninsk.First, the paper reminds key motivations of the program together with connected scientific challenges. These are related to safety enhancements of innovative low void penalty cores that are under consideration by both institutes. Indeed, once boiling onset is reached along the transient, a limit cycle is calculated according to periodic changes from two-phase to single-phase states of the coolant. Accordingly, pin cladding temperatures remain close to sodium saturation, instead of rising up to the melting temperature of the steel. Then, the paper describes the rationale of the program: inline, expected advances compared to former programs, specifics of test section design and its challenging instrumentation as well as tests organization logic are presented. Finally, some outcomes from the thermal-hydraulic preparatory work are reported: temperature peaks, which were monitored along preceding tests on a 7-pins bundle, have been analyzed to study the possibility of Na superheating; simulations of typical tests have been additionally performed to support definition of the HaRIBO test matrix as well as the location and span of the instrumentation. This work finally presents an ongoing benchmark, providing a first comparison of COREMELT-3D (IPPE)/CATHARE-3 (CEA) models for Na boiling.
KEYWORDS CEA, ROSATOM/IPPE, SFR, AR-1, Sodium boiling, CATHARE-3, COREMELT-3D
1. INTRODUCTION
This paper addresses the objectives, technical content, preparatory calculations and related analysis, for a CEA-IPPE experimental program on sodium boiling, which is proposed to be carried out in the AR-1 facility in Obninsk. This program aims at supporting the Sodium-cooled Fast Reactors (SFRs) safety related to an Unprotected Loss Of Flow (ULOF) transient. The technical material presented here is the outcome of the last two years’ reinforced efforts by both institutes to set up a scientific program of shared interest, which addresses the specifics of Gen IV SFRs concepts. To achieve so, the considered collaboration named HaRIBO, which stands for Ha (Cyrillic for Na) in
a
R-1 for Boiling, targets to valuably connect the expertise in the fields of high temperature liquid metal technology, which has been studied in France through GR-19 experiment, then recovered and upgraded from the 80’s by IPPE [1], with recent simulation and theoretical works undertaken by both Russian and French teams. The first steps of this latter task has consisted on CEA side in analyzing key experiments from French and Japanese 80‘s programs with CATHARE-3 ([2], [3]).
1.1. Na Boiling Flow Stability Under a ULOF for a Gen IV SFR System
R&D work on Gen IV SFRs concepts which is under progress in leading nuclearized countries ([4], [5], [6]) have renewed the 80’s strong interest about a deep experimental investigation of sodium two-phase flow pattern in a subassembly ([7], [8], [9]). Indeed, while with former concepts, a rapid entrance in a severe accident phase had to be considered in ULOF due to neutronic reactivity increase and flow blockage connected to boiling onset, it has been underlined that innovative core designs [10] which instead feature low neutronic void penalties [11], may also offer new margins in terms of two-phase flow thermal hydraulic stability [12].
Recently, the possibility that a density wave mechanism will actually replace the static Ledinegg instability discussed in [12], has been shown by means of CATHARE-2 & ERANOS simulations [13] as well as with COREMELT & RADAR [14]. On CEA side, the most advanced coupled calculations with CATHARE-3 and APOLLO-3 (neutron transport), still exhibits this pattern: a limit cycle, with periodic changes from diphasic to monophasic states of the coolant, is depicted while power at boiling onset is as high as 60% of nominal one [15]. Accordingly, the pin cladding temperatures remain close to the saturation temperature in those calculations [13], instead of rising up to steel melting temperature following their dry-out. These deep phenomenological changes, illustrated in Figure 1 and the subsequent possibilities offered in terms of safety demonstration enhancement for Gen IV SFRs, compared to 80’s concepts, constitute the roots of the IPPE-CEA joined effort.
Figure 1. Left: Time evolution of core inlet flow rate (purple), normalized power (red) and vapor volume (blue) along a ULOF transient with COREMELT [14], showing the development of a density wave at boiling onset, t = 40 s; Right: 1D axial profile of void fraction in the hottest subassembly with CATHARE-2 [13] along a ULOF, showing a limit
1.2. Scientific Scope of the IPPE-CEA Collaborative Program
The scientific scope of the program involves the boundary which sets a change of stability of the thermal-hydraulic system, either according to a loss of static stability (Ledinegg-like, [12]) or occurrence of a dynamic pattern (density waves, connected to a Hopf bifurcation which tags onset of a limit cycle [16], [17]) which could be again, stable or not [18]. In particular, compared to former programs on Na boiling from the 80’s, the main interest is to investigate the thermal-hydraulic specifics of Gen IV SFR designs, which feature for neutronic reasons (negative void effect, [10], [11]), a large hydraulic diameter plenum above the fuel bundle. This design modifies, compared to 80’s outcomes, the balance between wall friction, buoyancy and acceleration (with the interplay of interfacial friction). An increased buoyancy is known for instance to onset density waves at low thermodynamic qualities ([19], [20]) and may explain the periodic shift from liquid to two-phase flow. Definitely, neutronic negative void feedback is another main effect to be taken into account. However, it was shown through sensitivity calculations with a zero void neutronic effect [13] that thermal-hydraulics alone can produce a limit cycle during ULOF, depending on core power level. Inline, the out of pile HaRIBOexperimental program which will be described in the following sections, would mainly target to achieve some advances for the understanding of the limit cycle rationale on a thermal hydraulic point of view and accordingly would provide a database for codes thermal hydraulic qualification that suits the new Gen IV hydraulic design specifics. It is worth noticing some likely others valuable advantage of HaRIBOcollaborative program, compared to 80’s ones:
The numerical monitoring and treatment of the sensor signals should promote analysis of the dynamic phenomena, as illustrated in section 2.2.1. In addition, advances in the control logic should promote process operation stability and accuracy.
The optimization of the test grids analytics together with sensors number, location and accuracy that was carried out through preparatory simulations (see section 2.2.3), is seen to benefit from the highlights from past and recent programs review with CATHARE-3 ([2], [3], [6]). For instance, it was shown that heat losses along the channels could change the dynamics of the transient and therefore should be monitored accurately [2]. Moreover, the pressure change along the plenum above the fuel pins features specifics behavior (local effects of vortices) and makes it possible to estimate the void fraction. This pressure change should therefore be monitored accurately [6] by using differential pressure sensors, as presented in section 2.
On the other hand, one has to notice that the latter stages of the dry-out phenomenology (see cladding melting at about 1400 °C) will not be investigated. Instead, a wall temperature threshold will be set to trigger power shut-off, by so preventing the bundle from failure.
2. PROPOSITION OF A NEW EXPERIMENTAL PROGRAM 2.1. Scientific and Technological Approaches
The proposed program encompasses loss of flow tests at constant pin power such as in [21] as well as quasi-static tests with power or flow rate steps as a parameter (the latter being specifics from the GR-19 program [12], to the authors knowledge). As such, it is seen to combine usefully the complementary approaches that have been used in the 80’s. Two campaigns are proposed to be carried out in the AR-1 facility:
The first one would be performed on an existing 7-pins bundle [4]. This campaign, will aim at performing some experiments, which are seen as challenging from the technological point of view due to an increased risk of pins and instrumentation failure. This is the case for flashing boiling tests by depressurization, considered as very dynamic in Na due to the
combined large liquid to vapor density ratio and thermal performance of the liquid metal but expected to be very instructive for code validation (cf. separate effect). Tests at high pin power (close to current technological upper limit) will be also part of this risky grid, as well as tests with an increased temperature threshold to delay triggering a power shut-off in case of temporary dry-out, by so deepening the expected scientific lessons.
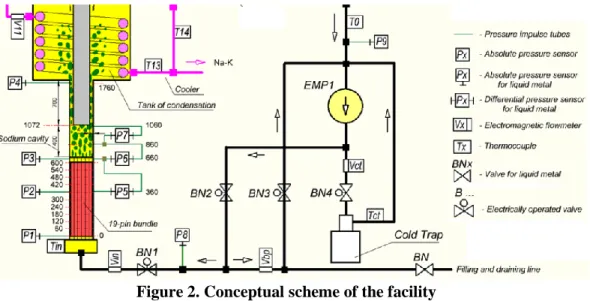
The second, central, campaign would be performed on a 19-pins bundle implemented on a upgraded test section1, whose conceptual layout is shown on Figure 2. Compared to the 7-pin campaign, this campaign would allow:
– Upgrading the facility design and control, e.g. by adding a bypass circuit, which will allow applying specific methodologies to promote flow stability and to mimic parallel channels asymmetrical effects.
– Upgrading the monitoring, e.g. by using higher-accuracy differential pressure sensors (see P5, P6, P7 on Figure 2), by optimizing the pins wall and sodium temperature mapping and by monitoring heat losses. The connected pre-calculations carried out to support the design are reported in section 2.2.3.
– Scaling up the 7-pins bundle: the 19-pins bundle will offer a more homogeneous radial temperature profile which interplays on local boiling phenomenology (local flow blockage/bypass and associated temporary dry-out which may have been the reason for the results discussed in section 2.2.1). One has to note that scaling up to 19-pins (rather than 37-pins for instance) is seen as a tradeoff between cost and scientific gain.
Figure 2. Conceptual scheme of the facility
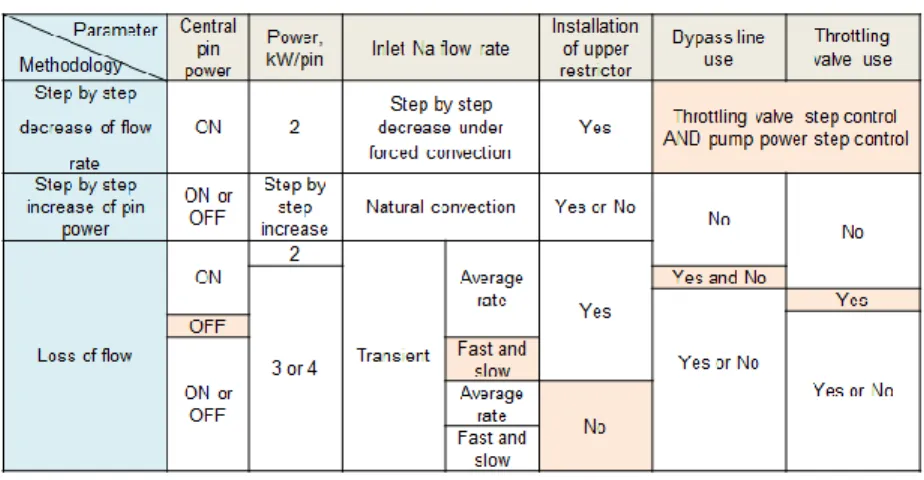
The experimental matrices of the two campaigns gather 60 tests. Parameters have been fully listed and their range defined, except for 9 of them to gain some flexibility. Table 1 reports a sample of grid, addressing low pin power. The main parameters can be listed as follows:
Pins power input; Test section bypass flow;
Flow-halving time to study thermal disequilibrium along loss of flow tests; Central pin power shut-off to flatten the temperature radial profile;
Inlet valve throttling to promote static stability;
Upper part hydraulic diameter, depending on the insertion or not of the restrictor (see the grey rod on Figure 2) to vary the two-phase flow phenomenology in the outlet channel.
1
Both 7-pins and 19-pins bundles feature 9 mm diameter electrically heated, wire-wrapped pins. The lattice
Table 1. Tests grid of the low pin power campaign
2.2. Thermal-hydraulic Preparatory Work
2.2.1 Balance of Na superheating concern: analysis of a former test on AR-1
An experimental campaign on Na boiling within a 7-pins bundle under natural and forced convection was carried out in 2014 on the AR-1 facility [4]. As reported on Figure 3, following a power step which was performed while sodium temperature was close to its saturation value at atmospheric pressure, some marked temperature peaks were monitored on a pin wall, reaching value as high as 980 °C. These peaks finally triggered a power shut-off.
At first, these crossings of the expected saturation temperature, reminded the sodium propensity to superheat prior to boiling inception, which indeed had been the topic of many studies in the 80’s [8]. This pattern is promoted by some specifics of liquid metal properties (eg. a surface tension about 10 times the one of water at 15 MPa, while vapor density is lower and saturation temperature is higher). Liquid superheat is a very complex phenomenon to model (many parameters can interplay [8]) so that codes prediction on this peculiar point could not be considered of high reliability (actually, they may not at all model it). Discarding, by a physical analysis, the possibility of liquid superheating has been therefore considered as relevant.
Accordingly, an analysis was performed with the following outcomes:
It has been balanced as very unlikely that liquid superheat could be the reason for the peaks. Indeed, in case of superheat, the liquid would still be in contact with the pin wall:–
If so, during the peaks, both wall and liquid temperatures should change accordingly since heat transfer in liquid metal is very efficient. This is clearly not the case on Figure 3. However, the reported sodium temperature is actually taken from a plenum topping the pins and its dynamics could therefore be somewhat damped by its thermal inertia. Hence, one cannot firmly conclude on this single basis.–
Duration of the wall temperature transient should also be consistent with the ones of power and/or flow rate change, which affect the thermal balance. On Figure 3, pin power is constant along a large time window while flow rate dynamics show no clear correlation over the course of the temperature transient (see for instance the temperature peak developed at time 10350 s, during which flow rate remains constant). Alternatively, temporary dry-outs of the pin wall following sodium boiling have been identified as much more likely than liquid superheat. Indeed, they would cause a
significant decrease of the heat transfer coefficient and then a sharp increase of the pin wall temperature. If one assumes an adiabatic behavior of the pins (see the low heat transfer coefficient with sodium vapor), the order of magnitude of the pin temperature rise can be estimated2 to 15 °C/s. This could roughly match what is observed on Figure 3. Rewetting of the pins could have been driven by local effects (release of a growing vapor pocket by buoyancy) or global effects connected to the chugging events (condensation induced by test section pressure increase or even inlet flowrate rise, as seen on Figure 3). These chugging pressure peaks could also raise a third hypothesis: temporary increases of the saturation temperature.
Figure 3. Experimental results from the AR-1 facility with a 7-pins bundle [4]
Finally, superheating was not identified as playing a key role along 2014 tests and - according to 80’s feedback - this could be the trend for a Na facility featuring a cover gas, as in AR-1. Indeed, due to gas solubility into the flowing liquid metal, some nucleation sites are actually provided. Superheating possibility remains however a possible issue in HaRIBO program and as such, special attention will be placed on roughness of the manufactured pins, which also interacts on nucleation sites availability.
2.2.2. Simulations of some key tests mimicking reactor case transient
During the preparatory work of the H
a
RIBO program, some pre-calculations have been performed with the CATHARE-3 code in order to check the relevancy of the two-phase flow patterns that should be experienced in the scale down mock-up, compared to the reactor case.These key investigations consisted in simulating some Loss Of Flow (LOF) transients which are planned on AR-1 (see Table 1), by applying a time flow rate law normalized from one of a ULOF calculation for a SFR concept. The calculations have been done considering the two configurations (7-pins and 19-pins, see first and second campaigns in section 2.1), with power and half-flow rate times as parameters (respectively 3, 4, 7 and 8 kW/pin and 5 s, 10 s, 30 s and 50 s).
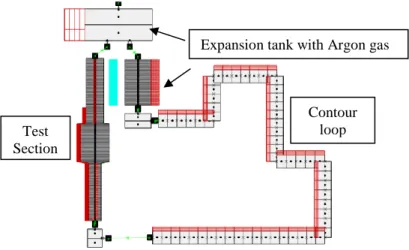
The CATHARE-3 modeling of AR-1 facility for the first campaign (7-pins bundle) is presented on Figure 4. The test section has been modeled with a 1-D hydraulic module coupled with four thermal modules representing the unheated and heated parts of the rod bundle, the test section box and the
restrictor rod. Some data about the test section box were missing, in particular the thickness and properties of the insulation. Previous studies on other experiments (as GR-19 [2] and SIENA-37 [3]) showed that heat losses and thermal inertia of the structures may affect the boiling transient (oscillations amplitude and frequency during chugging, and delay to dry-out). Therefore a sensibility study was carried out (but did not alter the conclusions below). The available data on the other parts of the loop were more scattered so that some assumptions had to be made: these are not expected to have much impact on the main trends. Note that a heat exchange between the end of the test section and the expansion tank, inside which it is inserted, is taken into account during the calculations. One can expect this heat exchange to have an impact on the chugging during sodium boiling.
Figure 4. CATHARE-3 model of existing AR-1 facility
The results reported in Figure 5 have shown that, by varying adequately power and flowrate halving time, a typical range of patterns could be achieved on the AR-1 mock-up as regard to reactor cases. Indeed, stable boiling (with chugging events as in [13]), unstable boiling (leading quickly to dry-out as with former concepts [12]), and finally an intermediate pattern (with a first step of stable boiling followed by an instability that leads to a final dry-out), can be observed.
Test Section
Expansion tank with Argon gas cover Contour loop
4.5 kW/pin
t
1/2= 10s
8 kW/pin
t
1/2= 10s
Figure 5. LOF calculations with CATHARE-3 related to the first campaign with power and flow halving time as parameters (Left: test section inlet liquid mass flow rate; Right: void
fraction axial map along test section)
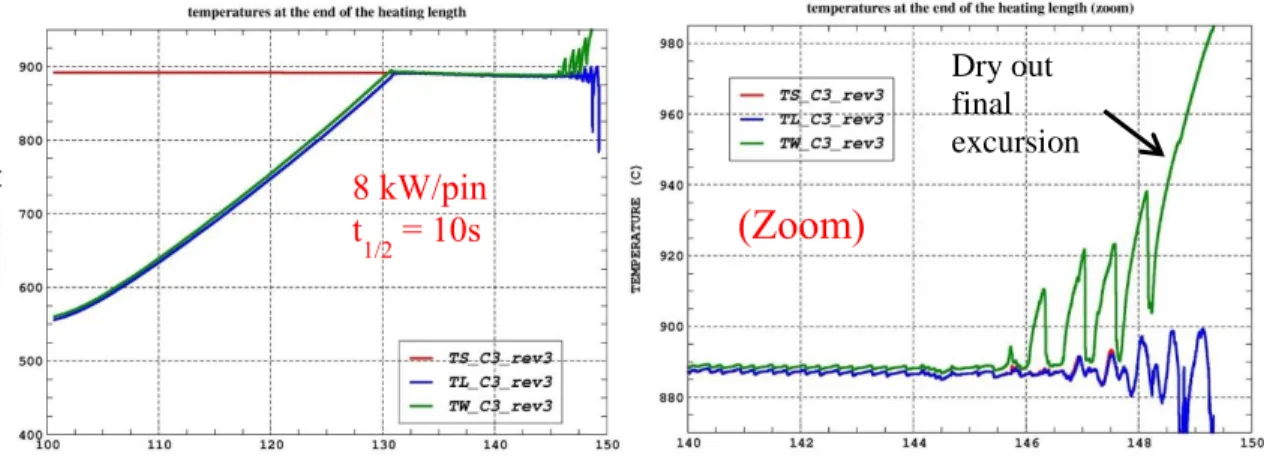
Figure 6 shows, for the 8 kW/pin case, the calculated temperatures at the end of the heated length of the rods (hottest part). The pin temperature features several peaks, which correspond to temporary dry-out (very similar to the ones mapped in section 2.2.1) connected to chugging phenomena (cf. Figure 5), before plainly rising up (irreversible dry-out).
Figure 6. Dry-out events of the pins wall for a 8 kW/pin LOF test, which is part of the first campaign on AR-1: saturation temperature (red line), liquid temperature (blue line), wall
temperature (green line).
The preparatory work was repeated with CATHARE-3 for the second campaign, featuring a 19-pins bundle. Same typical results were obtained, showing again the relevancy of the planned tests in regards to the phenomenology of the relevant reactor cases. Afterwards, additional calculations were conducted in order to support the definition of the instrumentation range and location dedicated to the second campaign.
2.2.3. Simulations in support to location and range of the instrumentation
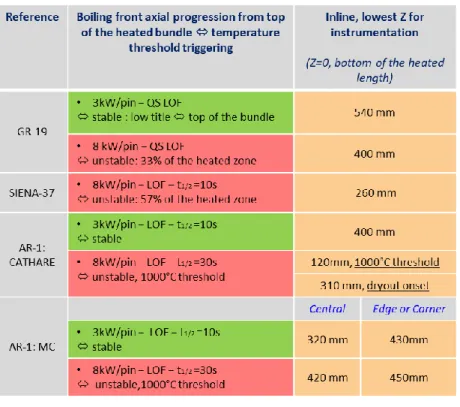
CATHARE-3 LOF pre-calculations, as well as TrioMC sub-channel code [2] simulations, have allowed estimating the boiling front progression during the tests planned for the second campaign. Figure 7 shows the void front evolution during a 8 kW/pin LOF transient, according to TrioMC. It predicts that if one assumes a 1000 °C temperature threshold for power shutdown triggering, the boiling zone should expand in the central sub-channels (in red, green and dark blue), down to Z = 420 mm from the bottom of the heated length and down to Z = 450 mm in edge and corner ones (in pink and light blue). Same analysis was done for a stable case at 3 kW/pin. It has been found that the lowest level reached by the boiling front was Z = 320 mm in central sub-channels and Z =
7 kW/pin
t
1/2= 50s
8 kW/pin
t
1/2= 10s
(Zoom)
Dry out final excursion420 mm in edge and corner sub-channels. These predictions are broadly compatible with those of 1D CATHARE calculations (considering that CATHARE performs a radial average). Those results as well as some additional data from former experiments (GR-19 and SIENA-37) are summarized in Table 2.
Figure 7. Void front evolution from pre-calculation of a LOF at 8 kW/pin in AR-1, with TrioMC sub-channel code (colors correspond to sub-channel types accordingly to right
graphical charter)
Table 2. Comparison of boiling front maximum penetration in the heated part (Z level) for LOF transients at 3 kW/pin (green) and 8 kW/pin (red), measured from GR-19 &
SIENA-37 experiments3 and predicted on AR-1 19-pins experiment
3 GR-19 and SIENA-37 heated length are respectively 600 and 450 mm long. “QS” means Quasi-Static.
LEV
EL
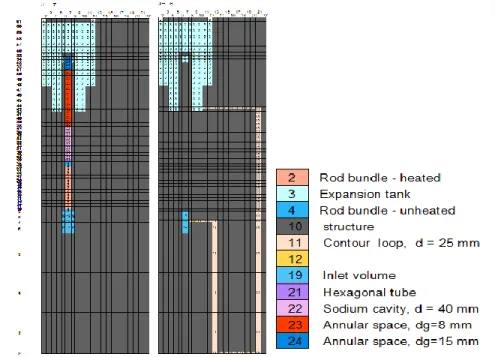
From the results, it has been possible to recommend a vertical and radial repartition of the thermocouples inside the rod bundle. As such, 76 pin wall thermocouples and 18 sodium thermocouples are proposed to be implemented, distributed on 9 planes from Z = 120 mm to Z = 600 mm. Two of them are presented in Figure 8. The top planes are more instrumented than the bottom ones since sodium boiling should appear first at the top of the heated length. However, the middle planes are still well furnished since the boiling front could reach those spots according to the pre-calculations reported in Table 2. In the proposed configuration, sodium and wall temperature measurements are facing each other on 7 cases so that wall to fluid temperature difference can be monitored. One has to note that sodium sensors are inserted horizontally and cannot be introduced closer to the bundle center since pins obstruct the way. Two sodium sensors are added at the 660 mm height, to monitor the top non-heated part of the bundle.
The rest of the test section and expansion tank would also be extensively instrumented: sodium thermocouples in line with thermocouples inside the wrapper and insulation layer will be located in the sodium cavity as well as along the restrictor part to estimate the heat losses and the occurrence of reverse sodium flow from the cooled expansion tank.
Figure 8. Two instrumented plans in AR-1 19-pins bundle at level 600mm and 300mm from the bottom of heated length (sodium thermocouples in yellow, the rest are wall
thermocouples)
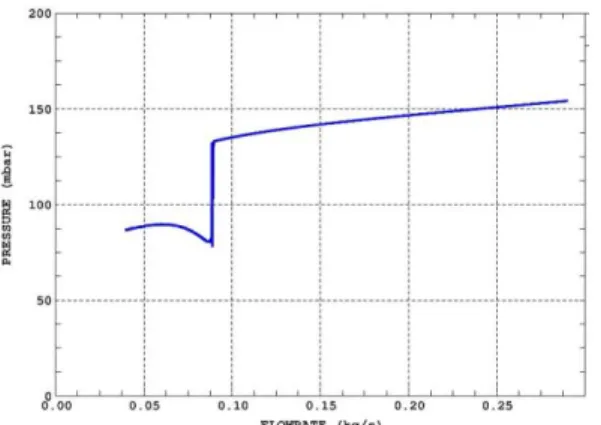
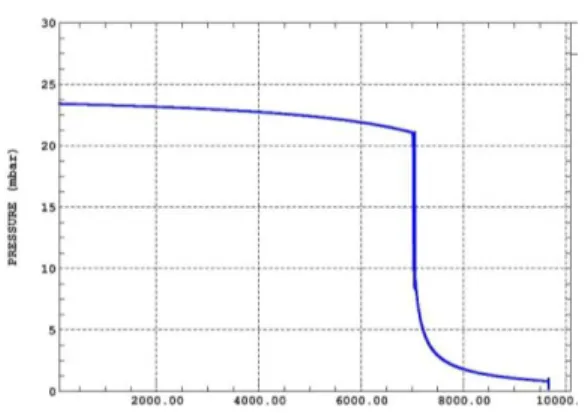
In addition, some CATHARE-3 calculations have been performed to estimate the expected head losses in the different parts of the test section, among a set of relevant boundary conditions from the test grids. From the results, it has been possible to make recommendations about the number, location, accuracy and span of the pressure sensors in the experiment. As such, it has been showed that pressure difference along the test section (see P1 to P4 in Figure 2) could be down to few tens of mbar (cf. Figure 9). Absolute pressure sensors accuracy would not be suitable since it could hardly be better than ± 10 mbar (as it was experienced in GR-19). Some differential pressure sensors were instead identified as relevant, with an accuracy of ± 0.5 mbar.
Figure 9. Predicted internal characteristic (P1-P4 pressure loss along test section function of inlet flow rate) during a quasi-static flow rate decrease test (with CATHARE-3)
It is also proposed to install two differential pressure sensors in the sodium cavity above the rod bundle (see P6 and P7 on Figure 2). P7 will allow estimating plenum void fraction (which is a relevant data since its drives part of the neutron leakage in reactor cases [10], [11]), while P6 should estimate eddies dissipation effects connected to the change of hydraulic diameters from bundle to sodium cavity. Such a path was successfully followed to analyze SENSAS program data [6]. According to CATHARE calculations (cf. Figure 10), the pressure loss range during a challenging run (quasi-static run at 3 kW/pin) would be approximately [2-25] mbar. In line, it has been proposed to use there a sensor with a particularly low range (in order to decrease the minimum span).
Figure 10. CATHARE-3 prediction of the differential pressure evolution in AR-1 sodium cavity during a quasi-static transient
Finally, chugging phenomena are likely to occur in the test section and may lead to pressure peaks. Beside, pressure peaks of several bars have already been experienced in former experiments as in SIENA-37 [3]. Monitoring of such events is part of the program target on AR-1. Thus, one absolute sensor in the test section is chosen in a higher pressure range: 17 bar. Other sensors are kept with smaller pressure range since increasing the pressure range of a sensor would be connected to a decrease of its accuracy.
3. ONGOING BENCHMARK BETWEEN CATHARE-3 1D AND COREMELT-3D 3.1. AR-1 Modeling With CATHARE-3 and COREMELT-3D
In the frame of the collaboration between CEA and IPPE, a benchmark between the Russian COREMELT-3D code and the French CATHARE-3 code has been initiated. It has been decided to start with the modeling of AR-1 facility in the current configuration (with the 7-pins bundle). The main goals are to consolidate the facility modeling (verify geometry, check modeling assumptions and simplifications, confront 1D against 3D approaches, etc.) and to compare the codes response.
Both codes model the whole experimental loop. While CATHARE-3 code uses only a 1D approach to model all the elements of the facility, COREMELT-3D code uses a 3D approach to model the volumes (expansion tank and the rod bundle inlet as shown in Figure 11) while the test section can be modelled either in 1D or in 3D.
For both codes, the pressure in the gas volume of the expansion tank is used as a boundary condition. Heat losses along the contour loop have not been accounted for: it is assumed to be at a constant temperature of 650 °C (the test section inlet temperature). For a first comparison, heat losses along the test section and heat exchange between the restrictor part and the expansion tank are also not accounted for. A local resistance is introduced in the circulation loop as pipe length and singular pressure losses are not known. Its value is automatically defined along the steady-state calculations as to provide a necessary value of the flow rate.
Figure 11. COREMELT-3D modeling of AR-1 facility in current configuration (test section in 1D representation)
3.2. Code to Code Comparison on Elementary Tests
A first code-to-code comparison has been conducted on elementary tests: one-power step transients at 2, 3, 3.5 and 4 kW/pin during natural circulation. Each transient begins with a single-phase steady state at 1.05 kW/pin. Then a power step is enforced starting the recording of the simulation results. It has been observed that the two codes were consistent regarding the limit of stable boiling : with both codes, stable boiling with chugging phenomena is predicted for the two smaller power steps while 3.5 and 4 kW/pin transients lead to dry-out. Figure 12 shows, for the 2 kW/pin case, the test section inlet liquid mass flow rate. One can observe that the amplitude and frequency of the oscillations (chugging) are quite similar between the two codes. Some sensibility studies have been conducted:
modifying the material inertia in the simulation (for example neglecting inert restrictor rod and unheated pins lengths inertia) impacts the oscillation frequency ;
modeling test section heat losses and heat exchanges with the expansion tank alters, at each oscillation, the initial rise in mass flow rate (small oscillations appear) ;
using a 3D approach to model test section (with COREMELT-3D) enlarges the positive mass flow rate peaks and regulates the oscillation frequency.
Figure 13 shows, for the 4 kW/pin case, the test section inlet liquid mass flow rate and the pin temperature at the end of heated length. One can observe discrepancies between the two codes: COREMELT-3D predicts a smooth decrease of flow rate during 90 s before reaching dry-out while CATHARE-3 predicts a quick decrease of flow rate (30 s) following by high chugging phenomena along with temporary dry-outs. Both situations have been encountered in former experiments: the first one in the KNS-37 N25 test [22] and the second one in GR-19 [2] and SIENA-37 [3] campaigns.
This preliminary code-to-code comparison has highlighted a definite interest in pursuing the benchmark. In the next steps, experimental data should be used in order to discriminate the lacks in modeling and models and contribute to the codes’validation processes.
Figure 12. CATHARE-3 (red) and COREMELT-3D (blue) comparison on a 2 kW/pin power step elementary test on AR-1 current configuration
Figure 13. CATHARE-3 (red) and COREMELT-3D (blue) comparison on a 4 kW/pin power step elementary test on AR-1 current configuration (Left: Test section inlet liquid flowrate; Right: temperature at the end of the heated pin length vs saturation temperature
in green) 4. CONCLUSIONS
The paper summarizes the key points of an experimental program, which could be carried out over about 4 years in the AR-1 facility in Obninsk. While regular exchanges between ROSATOM/IPPE and CEA started in 2012, this program is the outcome of both institutes’reinforced efforts over the last two years to set up a scientific collaboration, named HaRIBO. It addresses Na boiling specifics of Gen IV SFRs concepts and especially thermal hydraulic stability of the two-phase flow. Test section specifics, test grid rationale and preparatory calculations that were carried out with CATHARE-3 and TrioMC to support test section relevant modelling of the reactor case phenomenology as well as definition of sensors specifications, have been presented. A code-to-code comparison has been also initiated to balance the modeling approaches of the facility and to confront CATHARE-3 and COREMELT-3D two-phase flow models for sodium application. The next step could be comparisons to AR-1 experimental data, allowing progress in codes validation, prior to future SFR’s safety studies.
ACKNOWLEDGMENTS
Authors would like to acknowledge both ROSATOM and CEA SFRs projects for their joined efforts to promote the achievement of this very interesting scientific target in support to SFRs safety enhancement.
REFERENCES
1. I.M. Ashurko et al., “Activities on Experimental Substantiation of SFR Safety in Accidents with Sodium Boiling. International conference on Fast Reactors and Related Fuel Cycles: Safe
Technologies and Sustainable Scenarios”, Fast Reactors FR13 conference, Paris, France, March 4-7 (2013).
2. M. Anderhuber et al., “Simulation of GR19 sodium boiling experiments with CATHARE-2 system code and TRIO_U MC subchannel code”, NURETH-16 conference, Chicago, USA, Aug 30-Sept 4, paper 13017 (2015).
3. M. Anderhuber et al., “Validation of CATHARE 3 system code for sodium two phase flow application: R&D path and simulation of key test from the SIENA program”, NURETH-17 conference, Xi'an, China, Sept 3-8, paper 20708 (2017).
4. R.R. Khafizov et al., “Experimental Studies of Heat Exchange for Sodium Boiling in the Fuel Assembly Model: Safety Substantiation of a Promising Fast Reactor”, Thermal Engineering, 64(1), pp. 6-14 (2017).
5. Z. Qiu et al. “Experimental research on the thermal hydraulic characteristics of sodium boiling in an annulus”. Experimental Thermal and Fluid Science, 60, pp 263-274 (2015).
6. J. Perez et al. “CATHARE 2 simulations of steady state air/water tests performed in a 1:1 scale SFR sub-assembly mock-up”, Annals of Nuclear Energy, 83, pp. 283–297 (2015).
7. H. Ninokata. “Analysis of low heat flux sodium boiling test in a 37-pin bundle by the two liquid fluid model computer code Sabena”, Nuclear Engineering and Design, 97, pp 233-246 (1986) 8. H. Kottowski. “Fundamentals of liquid metal boiling thermalhydraulics”. Nuclear Engineering
and Design, 82 pp. 281-304 (1984).
9. P. Gnadt et al, “Sodium boiling experiments in the THORS facility”, Nuclear Engineering and Design, 82, pp 241-280 (1984).
10. M.S. Chenaud et al. “Status of the ASTRID core at the end of the preconceptual design phase 1”, Nuclear Engineering and Technology, 45, pp. 721-730 (2013).
11. Y. Ashurko, et al., “Investigation of the sodium bubble volume coefficient's influence on safety of high-power sodium fast reactors”, Nuclear Energy, 3, pp. 5-13 (2014).
12. J.M. Seiler, "Sodium boiling stabilisation in a fast breeder subassembly during an unprotected loss of flow accident", Nuclear Engineering and Design, 240, pp. 3329–3335 (2010).
13. N. Alpy et al., "Phenomenological Investigation of Sodium Boiling in a SFR Core during a postulated ULOF Transient with CATHARE 2 System Code: a Stabilized Boiling Case", Journal of Nuclear Science and Technology, 53, pp. 692-697 (2015).
14. A. Volkov et al., “Coremelt-2D Code for Analysis of Severe Accidents, Sodium Fast Reactor”, Fast Reactors FR13 conference, Paris, France, March 4-7 (2013).
15. V. Pascal et al., “Multiphysics modelisation of an unprotected loss of flow transient in a sodium cooled fast reactors using a neutronic/thermohydraulic coupling scheme”, PHYSOR 2020, to be published.
16. E. Bissen et al., “Stability and Bifurcation Analysis of Sodium Boiling in a GEN IV SFR Reactor Core”, Fast Reactor FR17 Conference, Iekaterinburg, Russia, paper 611 (2017). 17. E. Bissen et al., “Asymptotic Numerical Method applied to stability and bifurcation analysis of
a boiling flow at low pressure in a pipe”, NUTHOS-12 conference, Qingdao, China, 14 – 18 Oct (2018).
18. Rizwann Uddin et al., “A chaotic attractor in a periodically forced two phase flow system”, Nuclear Science and Engineering, 100, pp393-404 (1988).
19. D.D.B. van Bragt et al., “Nonlinear Analysis of a Natural Circulation Boiling Water Reactor", Nuclear Science and Engineering 131, pp. 23-44 (1999).
20. K. Fukuda et al. “Classification of Two-Phase Flow Instability by Density Wave Oscillation Model”. Journal of Nuclear Science and Technology, 16, pp. 95-108 (1979).
21. F. Huber, “LOF simulation experiments with the KNS 37-pin bundle”, 10th meeting of the Liquid Metal Boiling Working Group, Karlsruhe, Germany (1982).
22. A. Кaiser, “Sodium Boiling Experiments at Low Power Under Natural Convection Conditions”, Nuclear Engineering and Design, 100, pp. 367-376 (1987).
![Figure 1. Left: Time evolution of core inlet flow rate (purple), normalized power (red) and vapor volume (blue) along a ULOF transient with COREMELT [14], showing the development of a density wave at boiling onset, t = 40 s; Right: 1D axial profile of vo](https://thumb-eu.123doks.com/thumbv2/123doknet/12976937.378070/3.864.152.690.808.975/figure-evolution-normalized-transient-coremelt-showing-development-density.webp)
![Figure 3. Experimental results from the AR-1 facility with a 7-pins bundle [4]](https://thumb-eu.123doks.com/thumbv2/123doknet/12976937.378070/7.864.162.704.298.565/figure-experimental-results-ar-facility-pins-bundle.webp)