HAL Id: cea-01103580
https://hal-cea.archives-ouvertes.fr/cea-01103580
Submitted on 15 Jan 2015
HAL is a multi-disciplinary open access
archive for the deposit and dissemination of
sci-entific research documents, whether they are
pub-lished or not. The documents may come from
teaching and research institutions in France or
abroad, or from public or private research centers.
L’archive ouverte pluridisciplinaire HAL, est
destinée au dépôt et à la diffusion de documents
scientifiques de niveau recherche, publiés ou non,
émanant des établissements d’enseignement et de
recherche français ou étrangers, des laboratoires
publics ou privés.
Efficiency Optimization of Class G Amplifiers: Impact of
the Input Signals
Patrice Russo, Gaël Pillonnet, Nacer Abouchi, Sophie Taupin, Frederic Goutti
To cite this version:
Patrice Russo, Gaël Pillonnet, Nacer Abouchi, Sophie Taupin, Frederic Goutti. Efficiency
Optimiza-tion of Class G Amplifiers: Impact of the Input Signals. Audio Engineering Society ConvenOptimiza-tion, Audio
Engineering Society, Oct 2012, San Francisco, United States. pp.315-322. �cea-01103580�
Convention Paper
Presented at the 133rd Convention 2012 October 26–29 San Francisco, CA, USA
This paper was peer-reviewed as a complete manuscript for presentation at this Convention. Additional papers may be obtained by sending request and remittance to Audio Engineering Society, 60 East 42nd Street, New York, New York 10165-2520, USA; also see www.aes.org. All rights reserved. Reproduction of this paper, or any portion thereof, is not permitted without direct permission from the Journal of the Audio Engineering Society.
Efficiency Optimization of Class G
Amplifiers: Impact of the Input Signals
Patrice RUSSO1, Gael PILLONNET1, Nacer ABOUCHI1, Sophie TAUPIN2 and Frederic GOUTTI2
1
Lyon Institute of Nanotechnology, Heterogeneous System Design, Lyon, FRANCE [email protected], [email protected], [email protected]
2
ST Microelectronics, Analog & Power Management Business Unit, Grenoble, FRANCE [email protected], [email protected]
ABSTRACT
Class G amplifiers are an effective solution to increase the audio efficiency for headphone applications, but realistic operating conditions have to be taken into account to predict and optimize power efficiency. In fact, power supply tracking, which is a key factor for high efficiency, is poorly optimized with the classical design method, because the stimulus used is very different from a real audio signal. Here, a methodology has been proposed to find class G nominal conditions. By using relevant stimuli and nominal output power, the simulation and test of the class G amplifier are closer to the real conditions. Moreover, a novel simulator is used to quickly evaluate the efficiency with these long duration stimuli, i.e. ten seconds instead of a few milliseconds. This allows longer transient simulation for an accurate efficiency and audio quality evaluation by averaging the Class G behavior. Based on this simulator, this paper indicates the limitations of the well-established test setup. Real efficiencies vary up to ±50% from the classical methods. Finally, the study underlines the need to use real audio signals to optimize the supply voltage tracking of Class G amplifiers in order to achieve a maximal efficiency in nominal operation.
1. INTRODUCTION
Class AB amplifiers allow excellent audio signal reproduction and are widely used over a large range of applications, such as smartphones, home theater or automotive applications. However, Class AB amplifiers suffer from a limited efficiency expressed as:
out
V
(1)where VOUT is the output signal amplitude and VDD is
the power supply voltage. This expression is valid for a pure sinusoidal output signal and for a negligible quiescent current.
The Class AB efficiency reaches 78.5% for a full scale output signal (VOUT=VDD) but decreases linearly with
the signal amplitude. At a nominal listening level, the efficiency is only a few percent because the output signal amplitude needed is more than one decade lower
P.RUSSO & al. Efficiency Optimization of Class G Amplifiers
AES 133rd Convention, San Francisco, CA, USA, 2012 October 26–29
Page 2 of 8 To overcome its poor efficiency, other topologies have been studied for headphone applications: switched and hybrid amplifiers. Switched amplifiers (Class D) have a relatively higher efficiency over a large range of output power but suffer from lower audio quality reproduction (linearity, power supply rejection) [1, 2] and are therefore most often used for speaker applications. Furthermore, a Class D requires a costly and bulky external filter to avoid unpredictable electromagnetic interference with the neighboring circuits. In order to combine the advantages of switched architectures (smallest conduction losses) and linear ones (highest linearity), both hybrid topologies have been introduced. Parallel hybrid amplifiers (Class K) are not used because they show high static consumption at the desired output level [3]. The series hybrid amplifier (Class G) offers a better current trade-off between audio quality and efficiency. Therefore, the following study focuses on this topology.
The Class G principle is to dynamically supply a linear amplifier in order to keep its power supply as close as possible to the output signal. In this way (VDD≈VOUT),
the amplifier efficiency reaches its maximal value (78.5%) according to equation (1).
In embedded applications, conventional Class G includes a Class AB amplifier supplied by two integrated DC-DC converters as shown in Figure 1. The negative voltage regulator is used to cancel the output common mode in order to remove the bulky output coupling capacitor. The negative VSS and positive VDD
Class AB supplies are controlled by a level detector to track them as close as possible to the audio signal.
Figure 1 Class-G block diagram and transient signal In a current industrial Class G, only two (or three) discrete levels are used to modulate the power supply. The difference between the output signal and the power supply is directly linked to the conducted Class AB losses. The tracking algorithm implemented in the level detector is therefore a key factor in increasing Class G
power efficiency. Work by Raab [4] proposes a guideline to design an optimal voltage tracking. While these analyses work with a pure sinusoid input signal, an analysis in nominal conditions (with a real input signal) is not available in the literature. To overcome this problem, our paper gives a method for predicting the voltage tracking strategy effect on efficiency and audio quality.
Firstly, this paper investigates the use of audio amplifiers in realistic situations to select appropriate input stimuli and amplitude. Secondly, it presents an overview of the proposed simulator to predict Class G efficiency. Finally, the proposed stimulus and simulator are used to study the nominal Class G efficiency and an optimization using different stimuli is performed and compared.
2. DEFINITION OF REALISTIC OPERATION
The classical method for efficiency prediction consists in simulating the Class G at the transistor level with a pure input sine wave. Unfortunately, this stimulus is different from the input signal applied in nominal conditions. Thus, in this paper, we show how to choose an input as close as possible to the realisticoperating state.
2.1. Stimuli selection
Audio signals selected in this paper are summarized in Table 1. First, a pure sine wave is chosen because it is conventionally used to simulate and test audio amplifiers. Secondly, random variation signals are selected: i) pink noise shaped because of its power spectral density which is suitable for audio power testing, ii) a noise according to IEC 268-1 which is well established for modeling the audio signal.
Concerning the audio signals, four were selected with different characteristics. The latter will be presented in part 2.3. Each signal is assigned a number and will be referred to by its number in the following sections.
Signal Type Artist/Title
1 Sine Wave N.A.
2 Pink Noise N.A.
3 Techno D. Guetta
4 Hip Hop Rohff/Repris de Justesse
5 Jazz J. Joplin/Me and Bobby Mc Gee
6 Rock M. Etheridge/Like The Way I Do
7 IEC 268-1 N.A.
2.2. Efficiency measurements of Class-G amplifiers
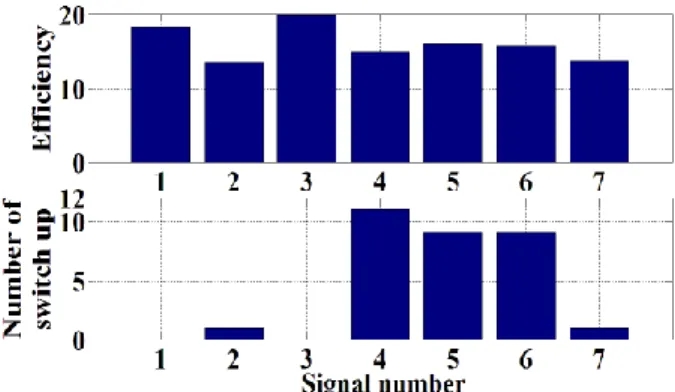
The current industrial Class G amplifiers [10], [11] only specify their efficiency when a pure sine wave (#1) is applied to their inputs. Unfortunately, the efficiency in nominal operation is different from these specified values. Figure 2 (top) shows the efficiency measured at 2mW output power using a Class G from [10] and the signals from Table I. The number of switchings between the lower and upper power supply voltages is also presented in Figure 2 (bottom). In [10] only two different voltages are used (V1 and V2 where V1<V2) to modulate the power supply of the linear amplifier. The efficiency variation is almost 20% between the sine wave and #4. In other configurations, (see the following section) efficiency could be as much as 50% less depending on the applied signal.
The conventional signal (#1) overestimates the efficiency compared to signals with a Crest Factor (CF)>10dB and a kurtosis>4 (see Part 2.3 for definitions and Table 2 for values). When a sine wave is applied, the amplifier power supply stays at the lowest value V1 (as shown in Figure 2), while the other signals cause the amplifier to modulate the power supply. Signals #2 and #7 (noise shaped signal) underestimate the efficiency because the power supply always stays at its highest value V2. Only the audio signals allow the level detector to switch, except for signal #3 in this configuration. Indeed, signal #3, which has a low CF, operates the amplifier in the same way as a pure sine wave. Therefore, #1, #2 and #7 cannot mimic the real operating conditions. The audio signals are needed for accurate efficiency testing. The following paragraphs show how to carefully select a few audio signals to summarize the infinite input possibility.
Figure 2 Efficiency and switching behavior of selected signals at 2mW
2.3. Mean characteristics of the audio signals
To easily choose relevant stimuli over a large range of audio signals, some relevant parameters will be identified. By comparing them, the most representative signals can be chosen. First, the Root Mean Square (RMS) voltage value of the audio signal (see (eq 2)) is necessary to know how much power is delivered into the loudspeaker (thus the listening level). Note that some studies have compared the voltage vs. driving current of a loudspeaker [5].
dt
t
s
T
V
T t t rms
0 2)
(
1
(2) The second parameter is the signal frequency composition. Assuming that the audio signal is periodic, the Fourier transform can be used to find its Frequency Decomposition (FD). This is given by:
s
t
e
dt
f
S
(
)
(
)
2itf (3) where s(t) and S(f) are the signal in the time and frequency domains, respectively.The third parameter is the Crest Factor (CF) which defines the dynamic of the audio signal. Equation 3 gives its definition:
rms peak V V dB CF( ) 20 log (4)
where Vpeak is the maximal value of the signal. Notice
that the CF of a pure sine wave is equal to 3dB.
The fourth parameter is the Probability Distribution (PD) of the signal level. A histogram is used to provide a graphical representation. If the PD is uniform, it is equal to zero when the value of the sample is outside the interval [a,b], otherwise the PD is given by (5). For a Gaussian PD following a normal law, the equation can be expressed by (6).
a
;b
,
x
a
b
x
p
X
1
)
(
(5)
2 22
exp
2
1
)
(
O Xx
x
x
p
(6)where xℝ, xO represents the mean value and σ the
standard deviation.
Three other well known parameters have been used corresponding to the moments of degrees 2, 3 and 4, respectively, for statistical signal analysis:
P.RUSSO & al. Efficiency Optimization of Class G Amplifiers
AES 133rd Convention, San Francisco, CA, USA, 2012 October 26–29
Page 4 of 8 • the variance characterizes the dispersion
around the mean. This moment is also known as the standard deviation (σ) which is the square root of the variance.
• the skewness (SK) is a parameter which gives a
value to evaluate the symmetry of the PD. If the signal is totally symmetric the skewness is equal to 0.
• the kurtosis (K) measures the shape of the PD. The kurtosis of a Gaussian is equal to 3 and if the kurtosis is greater, this means that the PD is sharper.
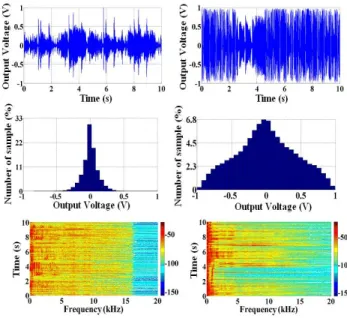
It is important to point out that the first moment (mean) which is equal to zero in audio signal is not relevant. The signals given in Table 1 were carefully investigated to choose a few appropriate audio signals from a large audio database [6] (from classical to rock styles) to provide various characteristics (CF, FD, PD, skewness, Kurtosis and Variance). The values of these characteristics are listed in Table 2. We observe that each audio signal lasts ten seconds (taken after the first 25sec) to allow statistic analysis. Indeed, this length is the best compromise between time simulations and real condition testing. Figures 3 and 4 show the main characteristics of four signals: transient plot, statistical distribution and frequency spectrum in the audio band (Fast Fourier Transform or spectrogram with the Short Time Fourier Transform by using the spectrogram function in Matlab). Signal CF (dB) σ SK K Length (s) 1 3 0.707 0 1.5 5 2 11 0.2 0 2.8 5 3 7 0.42 0.02 2.39 10 4 10 0.3 0.02 3.95 10 5 14 0.12 0.12 4.64 10 6 18 0.08 -0.03 5.64 10 7 11 0.24 0 3 5
Table 2 Audio signal characteristics
In Figure 3, the pure sine wave (#1) has a 3dB CF and contains only one frequency (1 kHz in this paper). Its PD is almost a uniform signal (kurtosis of 1.5 compared to 1.8 for an ideal uniform distribution). Signal #7 has a Gaussian PD (kurtosis of 3, as for an ideal Gaussian PD represented in red in Figure 3). Its spectrum decreases with frequency (as it is a filtered pink noise). The other characteristics are given in Table 2.
Figure 3 Characteristics of #1 (left) & #7 (right) The audio signals #3 and #6 are shown in Figure 4 (with the most differences in the music selected). We observe that their spectra are limited up to 16 kHz due to MP3 compression. Their parameters are quite different: i) CF=7 and 18dB, respectively, ii) kurtosis=2.39 compared to 5.64. However, they also have similarities. The two signals show several periods of silence between successive peaks of different magnitude which is one of the major factors causing power supply switching of Class G amplifiers.
2.4. Audio signal level
The audio signal level is related to the output power needed to reach the desired acoustic level. If the loudspeaker (electro-acoustic transducer) is assumed to be a pure resistive load Rl, the relationship between the
RMS input signal Vi and the acoustic output power Pa
is:
k
P
R
V
i
l
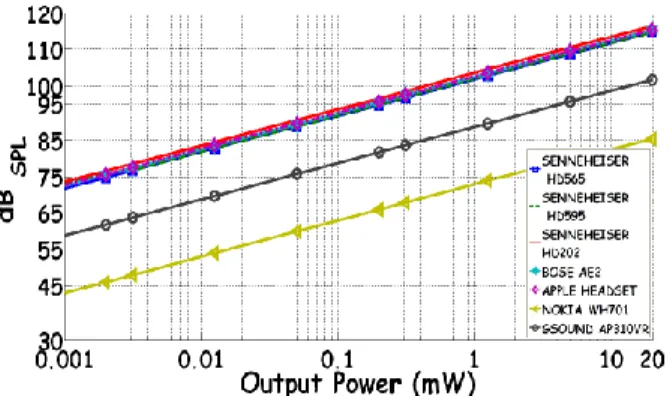
a (6) where η, k are the electro-acoustical efficiency of the loudspeaker and overall gain of audio amplifier, respectively.Experiments have been done to characterize the output power with respect to the desired acoustic power [7]. The test bench shown in Figure 3 is composed of a Head and Torso simulator (Bruel & Kjaer 4128C) and a Rohde & Schwarz UPD audio analyzer. The measurements have been realized in an anechoic chamber, using several types of headphone and a 1kHz input sinusoidal signal.
Figure 4 Test bench equipment
Figure 4 shows the output power versus the acoustical power received by ears. For a nominal listening level (75dB SPL), the output power varies between 2µW to 2mW which mainly depends on the electro-acoustical efficiency.
Figure 6 Sound pressure level Vs output power
2.5. Conclusion on stimuli selection
Seven audio signals have been selected to represent the large range of audio signal: from classical music to rock with various crest factors and large frequency and level compositions. They exhibit significant differences between each other and from a sine wave. The supply tracking algorithm implemented in the level detector will not respond in the same way to these complex audio signals as to a sine wave. To study the effect of these new stimuli on efficiency and audio quality, the next section proposes a simulator based on a novel model.
3. MODELING APPROACH FOR EFFICIENCY AND AUDIO QUALITY EVALUATION
The classical method (with a pure sine wave) requires only one signal period (usually 1ms) to be simulated to evaluate the Class G efficiency and audio quality. This simulation takes approximately one hour due to the circuit complexity including two switched converters, one linear amplifier and numerous analog blocks. By using much longer signals (10sec), the designer is faced with too long a calculation time to evaluate Class G performance. Moreover, multi-frequency and non-periodic stimuli prevent any classical frequency analysis based on Fourier transform, such as harmonic distortion. The authors have already suggested an original approach [8] to avoid the expansive calculation. The main advantage of this model is the reduction of the calculation time step by averaging and simplifying Class G behavior. Furthermore, this approach uses the Perceptual Evaluation of Audio Quality (PEAQ) method to evaluate audio quality [9]. This evaluation is needed because the power tracking algorithm can introduced some clipping effects on the audio signal. In fact, the Class AB can saturate if the power supply is lower than the output signal.
The previous results have validated the reliability of our model and allow the following simulations to be performed. The model has been validated in practice [8] and the relative error is less than 5%. Therefore, this model enables longer simulation allowing the use of the audio signals selected for this study.
The classical performance, such as distortion, noise, idle current, has to be determined separately to check the design validity at transistor level by using the classical method. Here, the objective is to check the behavior of
P.RUSSO & al. Efficiency Optimization of Class G Amplifiers
AES 133rd Convention, San Francisco, CA, USA, 2012 October 26–29
Page 6 of 8 the power supply tracking algorithm on the overall Class G performance.
4. EFFECTS OF REALISTIC STIMULI ON EFFICIENCY
This section underlines the effect of realistic stimuli on Class G efficiency and on the choice of power tracking strategy. The results obtained are based on simulation of an industrial circuit [10]. In this integrated Class G amplifier, two discrete power supply levels are used to track the audio signal (1.2V and 1.9V). The other parameters are given in [8].
4.1. Efficiency versus output power
At the same output power, the efficiency depends on the input stimulus as described in the previous paragraph but also over a large range of output power. Figure 7 shows the Class G efficiency compared to the selected signals over 20µW to 20mW (maximal output power). Below 0.8mW, the efficiency does not depend on the stimuli. In fact, the lower power supply level is always applied due to the very small signal amplitude. When the signal amplitude reaches the threshold voltage to switch the power supply to the upper level, the power tracking strategy has a strong impact on efficiency. Here, the threshold voltage is around 1V [10] and the highest CF signal reaches this value around 8mW. After this limit, the sine wave over- or underestimates the efficiency.
Figure 7 Class-G efficiency vs. output power By using an optimized power tracking strategy [8], the results are similar. We can see from Figure 8 a variation of ε=26% @1mW and a variation of ε=42% @2mW of output power. In addition, we see that the sine wave is not a relevant candidate for the prediction of efficiency.
Figure 8 Class-G efficiency with optimized power tracking
4.2. Voltage tracking behavior under realistic stimuli
The power supply modulation strongly depends on the input stimulus. Figure 9 shows the power supplies of a linear amplifier when signal #6 and a pure sine wave are applied at 2mW output power. For the audio signal, the supplies switch continuously between the lower and upper supply levels compared to the signal amplitude. With a pure sine wave, the supply level always stays at the lowest supply voltage. We propose 3ms of signal in Figure 9 but no switching appears, even with 10sec of signal due to the periodicity of the signal. It clearly shows that the chosen signal strongly influences the power supply tracking and thus overall efficiency. As the input signal is random, the supply rising has to be anticipated to avoid unwanted clipping. This problem needs carefully study to find the better trade-off between efficiency and audio quality. The previous supply tracking algorithms do not introduce any clipping but they could be optimized to reduce their power consumption.
Figure 9 Signal #1 and #6 at 2mW output power
4.3. Toward a better optimization of power tracking
The previous results shows that the designer needs to take into account real stimuli to design and optimize the supply voltage tracking which is one of the key factors to improve the Class G efficiency. The authors have
previously proposed a method to optimize the power tracking strategy. The article [8] gives the parameters to reach optimal efficiency in nominal operating condition based on audio stimuli described in this paper. To highlight the need for optimizing Class-G amplifiers with realistic input stimuli, an efficiency comparison is presented below.
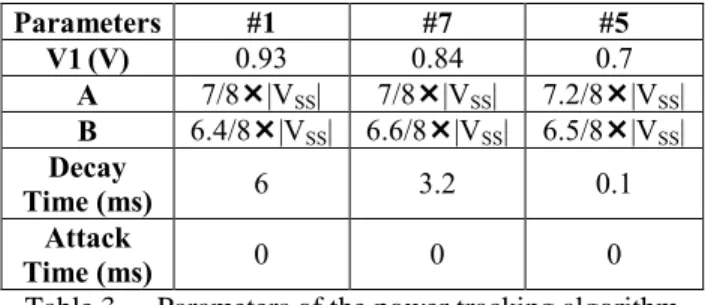
The optimization has been done three times with a pure sine wave (#1), noise (#7) and the audio signal (#5). The method and parameters are the same as those described in [8]. Based on a behavioral modeling of Class G amplifiers, a hybrid optimization using a global search algorithm (Genetic Algorithm) followed by a local search algorithm (Pattern Search) has been performed. The optimization has been realized for three output powers (0.1, 0.5 and 1mW) for audio signals, and 0.5, 1 and 10mW for signals #1 and 7 in order to apply an output power strong enough to modulate the power supply voltage. Parameter values of the switching algorithm are summarized in Table 3.
In the case of an optimization using signal #1 or #7, the lowest supply voltage V1 is placed relatively high compared to the signal #5. This leads to earlier modulation of the supply voltage. The decay time is the smallest with #5 which allows a faster switch down after an input peak. However, the parameters α and β that allow decisions to switch up/down the power supply are almost the same regardless of the signal used for optimization. Parameters #1 #7 #5 V1(V) 0.93 0.84 0.7 Α 7/8|VSS| 7/8|VSS| 7.2/8|VSS| Β 6.4/8|VSS| 6.6/8|VSS| 6.5/8|VSS| Decay Time (ms) 6 3.2 0.1 Attack Time (ms) 0 0 0
Table 3 Parameters of the power tracking algorithm The parameters in Table 3 were then used to evaluate the efficiency of the Class-G amplifier with an audio signal not used by the optimizer. The signal (interpreted by the Red Hot Chilli Peppers) has a CF of 17dB, a standard deviation of 0.05, a skewness of 0 and a kurtosis of 4.42. The results are presented in Table 4 for four output powers. It is clear that the best efficiency is obtained with the supply voltage algorithm optimized from audio signal #5 over the power range. This result confirms the need to use audio signals during the design
and the optimization to obtain the best efficiency performance. For example, the efficiency has been improved by 20%, without losing audio quality, by redefining the voltage tracking algorithm with signal #5.
Optimization
using signal 0.1mW η @ 0.5mW η @ 1mW η @ 10mW η @
#1 3.3 11 16.5 39.8
#7 3.5 11.9 17.5 41
#5 3.9 13.1 19.4 50
Table 4 Efficiency depending on stimuli optimization
5. CONCLUSION
This paper studies the audio Class G amplifier efficiency under nominal condition. To be closer to realistic operation, a few input stimuli have been chosen from a large database after identifying relevant key parameters to select them. From experiments, we also have determined the average power delivered by the amplifier for a nominal listening level. Based on existing Class G amplifiers, a dedicated model predicts efficiency and audio quality with the selected test pattern. Our paper clearly shows the limitation of the classical approach (with a pure sine wave) as it either over- or underestimates the real power consumption by up to 50%. Moreover, the proposed analysis helps to optimize the supply voltage tracking in an audio Class G amplifier to reach the maximal tradeoff between audio quality and efficiency. The use of the selected stimuli improves the efficiency by 20% without losing audio quality by redefining the voltage tracking algorithm.
6. ACKNOWLEDGEMENTS
The authors would like to thank the Region Rhône-Alpes for their financial support. They would also like to express their gratitude to STMicroelectronics for industrial feedback.
7. REFERENCES
[1] R. Cellier, E. Allier, A. Nagari, C.Crippa, R. Bassoli, G. Pillonnet, N. Abouchi, “A Fully Differential Digital Input Class D with EMI Spreading Method For Mobile Application”, AES 37th International Conference, 2009.
[2] A. Huffenus, G. Pillonnet, N. Abouchi, “A Class D
Headphone Amplifier with DC Coupled Outputs and 1.2mA Quiescent Current”, IEEE NEWCAS, 2011.
P.RUSSO & al. Efficiency Optimization of Class G Amplifiers
AES 133rd Convention, San Francisco, CA, USA, 2012 October 26–29
Page 8 of 8
[3] R. Van Der Zee and A. Van Tujil, “A High Efficiency Class D + Class AB Audio Power Bridge Amplifier”, 105th AES Convention, 1998.
[4] F. H. Raab, “Average Efficiency of Class-G Power
Amplifier,” IEEE transaction on Consumer Electronics, Vol. 32, No. 2, 1986.
[5] E. Sturtzer, G. Pillonnet, G. Lemarquand and N. Abouchi, “Comparison Between Voltage and Current Driving Methods of a Micro-Speaker” in Applied Acoustic, Vol.73(11), pp. 1087-1098, 2012.
[6] M. Mijic, D. Masovic, D. Sumarac Pavlovic and M. Petrovic, “Statistical Properties of Music Signals”, 126th AES convention, 2009.
[7] T. J. Eckert, “Audio Level Safety Limits and their
Impact on Personal Music Player”, IEEE Symposium on Product Compliance Engineering, 2010.
[8] P. Russo, F. Yengui, G. Pillonnet, S. Taupin and N. Abouchi, “Switching Optimization for Class-G Audio Amplifiers with Two Power Supplies”, Journal of Circuits and Systems, SRP, Vol.3, pp. 90-98, 2012.
[9] M. Salovarda, I. Bolkovac, H. Domitrovic,
“Estimating Perceptual Audio System Quality Using PEAQ Algorithm”, 18th International Conference on Applied Electromagnetics and Communications, 2005.
[10] TS4621 datasheet, STMicroelectronics products, 2010.
[11] TPA6140 datasheet, Texas Instrument product, 2009.