HAL Id: hal-00668011
https://hal-iogs.archives-ouvertes.fr/hal-00668011
Submitted on 8 Feb 2012
HAL is a multi-disciplinary open access
archive for the deposit and dissemination of
sci-entific research documents, whether they are
pub-lished or not. The documents may come from
teaching and research institutions in France or
abroad, or from public or private research centers.
L’archive ouverte pluridisciplinaire HAL, est
destinée au dépôt et à la diffusion de documents
scientifiques de niveau recherche, publiés ou non,
émanant des établissements d’enseignement et de
recherche français ou étrangers, des laboratoires
publics ou privés.
Relative electrical resistivities and poling of nonlinear
optical polymeric waveguides
Tomas Pliska, Joachim Meier, Arne Eckau, Vincent Ricci, Anne-Claire Le
Duff, Michael Canva, G.I. Stegeman, Paul Raimond, F. Kajzar, Kwok Pong
Chan
To cite this version:
Tomas Pliska, Joachim Meier, Arne Eckau, Vincent Ricci, Anne-Claire Le Duff, et al.. Relative
electrical resistivities and poling of nonlinear optical polymeric waveguides. Applied Physics Letters,
American Institute of Physics, 2000, 76 (3), pp.265-267. �10.1063/1.125742�. �hal-00668011�
Relative electrical resistivities and poling of nonlinear optical
polymeric waveguides
Toma´sˇ Plisˇka,a)Joachim Meier, Arne Eckau,b)Vincent Ricci, Anne-Claire Le Duff,c) Michael Canva,c)and George I. Stegeman
School of Optics/Center for Research and Education in Optics and Lasers (CREOL), University of Central Florida, P.O. Box 162 700, 4000 Central Florida Boulevard, Orlando, Florida 32816-2700
Paul Raymond and Franc¸ois Kajzar
Commissariat a` l’E´ nergie Atomique (CEA), Centre d’E´tudes de Saclay, 91191 Gif sur Yvette Cedex, France Kwok Pong Chan
Molecular OptoElectronics Corporation (MOEC), 877 25th Street, Watervliet, New York 12189-1903 共Received 1 October 1999; accepted for publication 17 November 1999兲
A method based on Maker fringe measurements of nonlinear optical coefficients has been used to determine the relative dc electrical resistivities of a series of linear and nonlinear optical polymers. The method can be used to identify low resistivity linear cladding materials for optimized electric field poling of nonlinear optical polymeric waveguides. As an example of the application of the technique we have studied the resistivity of poly共methyl methacrylate兲-polystyrene 共PMMA-PS兲 copolymers with varying content of the two components. The resistivity of PMMA was found to be one order of magnitude lower than that of PS. © 2000 American Institute of Physics.
关S0003-6951共00兲01603-X兴
Organic materials, both in single crystal and poled poly-mer form, can exhibit large optical nonlinearities and are thus attractive for many applications.1–3 Poled polymers have shown great potential for high frequency electro-optic modulators because of their low dielectric dispersion and fast response.4 Other, more recently evolving applications in-clude frequency conversion and cascading at telecommuni-cation wavelengths.5 Guided-wave configurations are par-ticularly suitable for nonlinear optics because of the high optical intensity that can be maintained over a long interac-tion length in the waveguide.6
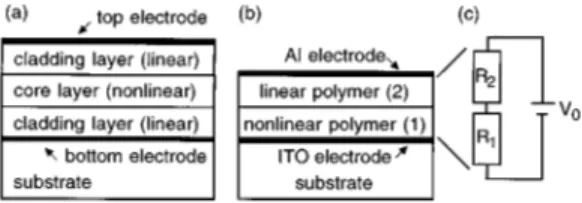
The basic structure underlying most nonlinear polymeric waveguides is shown schematically in Fig. 1共a兲. A high in-dex core layer containing the nonlinear optical chromophores is sandwiched between two low index linear cladding layers. Depending on the application, more layers can be included in the structure. Typical layer thicknesses are on the order of a few hundred nanometers to several micrometers. A second-order nonlinearity in the core layer is induced by applying a dc electric field which partially aligns the dipole moments of the chromophores. This process is referred to as electric field poling.7 For the structure shown in Fig. 1共a兲 with the elec-trodes at the bottom and on top of the waveguide 共parallel plate poling兲, the poling voltage is applied across all three layers and will divide according to their resistances. Thus, the effective poling field across the nonlinear core layer will depend on the thicknesses and relative resistivities of the
materials used in the structure. High resistivity cladding lay-ers will severely reduce the poling field in the core nonlinear layer resulting in a reduction or complete loss of the optical nonlinearity.
Typical specific ohmic resistivities of polymers range from 1011to 1024⍀ m. The task of measuring resistivities of thin polymer films is not trivial, and values quoted in the literature for a given material usually span several orders of magnitude, depending on, e.g., sample preparation, degree of polymerization, layer quality, purity, etc. Simple current– voltage (I – V) measurements do not provide the required information, since the I – V characteristic is often determined by interfacial effects between the polymer and the electrodes rather than by the bulk properties of the polymer film itself.8 In this work we have used a nonlinear optical method to determine relative poling efficiencies.
The sample structure for our measurements is shown in Fig. 1共b兲. It is composed of two polymer layers, one of which consists of a nonlinear optical polymer共thickness t1,
a兲Present address: JDS Uniphase AG, Binzstrasse 17, 8045 Zu¨rich, Switzer-land; electronic mail: [email protected]
b兲Permanent address: Institut fu¨r Schicht- und Ionentechnik ISI-2,
Fors-chungszentrum Ju¨lich, 52425 Ju¨lich, Germany.
c兲Permanent address: Laboratoire Charles Fabry, Institut d’Optique
The´or-ique et ApplThe´or-ique´e共IOTA兲, Universite´ d’Orsay/Paris-Sud, 91403 Orsay Ce-dex, France.
FIG. 1.共a兲 Basic structure of a nonlinear optical polymeric waveguide with three polymer layers共lower cladding, core, upper cladding兲 spin coated on a substrate and sandwiched between two poling electrodes.共b兲 Structure of the samples used in this work to measure relative resistivities consisting of one layer of nonlinear-optical polymer共1兲 and a linear cladding polymer 共2兲
between an indium–tin–oxide 共ITO兲 and an aluminum electrode. 共c兲
Equivalent electrical circuit for dc electric poling of the structure shown in
共b兲, with R1and R2denoting the resistance of the nonlinear and linear layer,
respectively, and V0the applied poling voltage.
APPLIED PHYSICS LETTERS VOLUME 76, NUMBER 3 17 JANUARY 2000
265
0003-6951/2000/76(3)/265/3/$17.00 © 2000 American Institute of Physics
specific resistivity 1) while the other one is a linear
clad-ding polymer 共thickness t2, specific resistivity 2). A dc
voltage V0 is then applied across the two-layer structure.
Neglecting capacitive effects共which is valid for dc fields and sufficiently long relaxation times兲 and contact resistances
共which are assumed to be much smaller than the material
resistivities兲, the electrical circuit can be simply represented by two resistances in series, with R1 denoting the resistance
of the nonlinear layer and R2 the resistance of the cladding
layer关Fig. 1共c兲兴. The nonlinearity induced by the poling pro-cess is a direct measure of the effective poling field E1 across the nonlinear layer during poling since thermody-namic considerations predict a linear dependence of the non-linearity on the poling field in the low field limit.9
For the analysis, we define the total thickness t0⬅t1
⫹t2 and a nominal 共average兲 electric field across the two layers E0⬅V0/t0. A straightforward calculation using
Ohm’s law leads to the following expression for the external field across the nonlinear layer E1:
E1 E0 ⫽ 1⫹t2 t1 1⫹2 1 t2 t1 . 共1兲
Notice that only relative variables appear in Eq.共1兲. Samples were prepared by spin coating 0.5–5m thick polymer layers on glass substrates coated with indium–tin– oxide 共ITO兲 as the bottom transparent electrode. The poly-mers were dried in an oven for several hours. The layer thicknesses were measured with an alpha step 200 profilo-meter共accuracy ⫾1%兲. A 150 nm thick aluminum layer was deposited on top as the upper electrode. Poling was done by heating the sample to an elevated temperature and then ap-plying a voltage corresponding to a nominal field E0 of 50–
100 Vm⫺1. After cooling down the sample the voltage was turned off, and the top electrode was removed using an Al etch solution. Maker fringe measurements at a wavelength of 1.58 m were performed to determine the nonlinearity. The configuration of our setup allowed us to measure the nonlinear-optical coefficient d31 which will be denoted as d
in the following 共accuracy of Maker fringe measurement
⫾15%, minimum resolution 0.1 pm V⫺1兲.
We used two different nonlinear optical polymers, namely 4-关N-ethyl-N-共2-hydroxyethyl兲兴amino-4
⬘
-nitroazo-benzene兲 共disperse red 1, DR1; glass transition temperatureTg⫽131 °C, number density of chromophores N⫽0.5
⫻1027m⫺3, poling temperature Tpol⫽120 °C), and
4-diethylamino-1-nitrobenzyl 共DANB; Tg⫽100 °C, N⫽2.6
⫻1027m⫺3, Tpol⫽100 °C), both covalently attached to a
poly共methyl methacrylate兲 backbone forming a side chain polymer. In order to calibrate the nonlinearity versus poling field curve, we first measured the nonlinear coefficients d using single layer samples of each nonlinear polymer with-out a cladding layer on top (t2⫽0). The corresponding mea-surements are shown in Figs. 2共a兲 and 2共b兲 with the lines indicating linear fits. For the slopes we obtain values of (1.57⫾0.11)⫻10⫺20m2V⫺2 for DANB and (1.73⫾0.15)
⫻10⫺20m2V⫺2for DR1. Using these relations we can then
deduce the effective field in the nonlinear layer of the poled composite two layer共linear–nonlinear兲 samples.
Several combinations of these two nonlinear polymers with linear cladding polymers were then investigated for their nonlinearity. We used poly共methyl methacrylate兲
共PMMA, Tg⫽105 °C), polystyrene 共PS, Tg⫽98 °C),
poly-carbonate共PC, Tg⫽150 °C), and copolymers of PMMA and
PS as cladding materials. In Table I we have listed the mea-sured relative resistivities2/1at the previously mentioned
poling temperatures of 100 and 120 °C. For some polymer combinations the measurement was performed on several samples, and the error was weighted accordingly. Remark-able differences in the resistivities of the different linear polymers can be noted, e.g., PS having a resistivity about one order of magnitude larger than PMMA. Our measuments are in accordance with the trends for the volume re-sistivities of these polymers found in the literature.10No sys-tematic dependence of the resistivity of the cladding polymers on their glass transition temperatures was apparent in our studies.
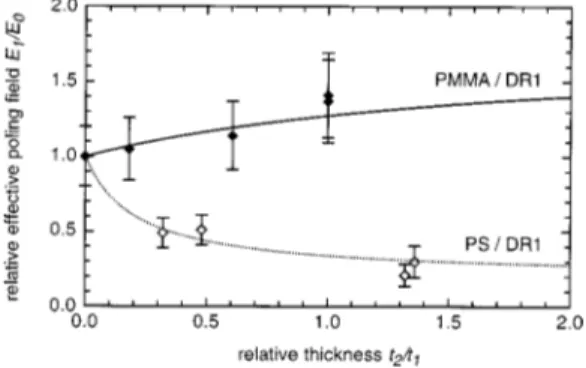
The thickness dependence of the effective poling field was investigated using the DR1/PMMA and DR1/PS struc-tures. In Fig. 3 we plotted the relative effective poling field
E1/E0 as a function of the thickness ratio t2/t1 共accuracy ⫾20%兲. The lines indicate fits according to Eq. 共1兲 with 2/1as a free fit parameter, yielding values of 0.6⫾0.3 and
4.7⫾0.9 for the DR1/PMMA and DR1/PS samples,
respec-FIG. 2. Measured nonlinear-optical coefficient d (⫽d31) as a function of the
applied external poling field for single-layer samples of the two nonlinear polymers DANB共a兲 and DR1 共b兲 used in this work. The lines indicate linear fits to the data.
TABLE I. Relative resistivities2/1of linear and nonlinear optical
poly-mers measured with samples shown schematically in Fig. 1共b兲. The linear
polymers used were polycarbonate 共PC兲, poly共methyl methacrylate兲
共PMMA兲, polystyrene 共PS兲, and copolymers of PMMA and PS, while the
nonlinear optical chromophores were 4-关N-ethyl-N-共2-hydroxyethyl兲兴 amino-4⬘-nitroazobenzene兲 共disperse red 1, DR1兲 and 4-diethylamino-1-nitrobenzyl共DANB兲, both attached to a PMMA backbone. The poling tem-perature was 100 °C for the DANB and 120 °C for the DR1 samples. The numbers in brackets indicate the number of samples used for the measure-ment.
Linear polymer/nonlinear polymer Relative resistivity2/1
PC/DANB 0.9⫾0.3共1兲 PMMA/DANB 2.6⫾0.4共3兲 共PMMA兲0.75–共PS兲0.25/DANB 3.6⫾0.9共2兲 共PMMA兲0.5–共PS兲0.5/DANB 4.6⫾2.6共1兲 共PMMA兲0.25–共PS兲0.75/DANB 8.3⫾5.7共2兲 PS/DANB 12.1⫾4.3共2兲 PMMA/DR1 0.6⫾0.3共4兲 共PMMA兲0.5–共PS兲0.5/DR1 1.2⫾0.4共1兲 PS/DR1 4.7⫾0.9共4兲
266 Appl. Phys. Lett., Vol. 76, No. 3, 17 January 2000 Plisˇkaet al.
tively. The ratio E1/E0 is equal to the relative nonlinearity
d/d0 where d0 is the nonlinear coefficient of a single layer
poled at field E0. The results shown in Table I and Fig. 3
clearly illustrate the importance of optimizing the relative resistivities for poling. Use of high resistivity cladding poly-mers, in this example PS, can reduce the nonlinearity to less than 10% of the nonlinearity expected for the field E0.
Because of the large difference between the resistivities of PMMA and PS we performed a measurement where co-polymers of PMMA and PS with varying ratio of the two components were used as cladding layers. The resistivity of the PMMA-PS copolymers relative to DANB and DR1, re-spectively, is plotted in Fig. 4 as a function of the PMMA mole fraction. The resistivity decreases with increasing PMMA content, as expected from the measurement shown in Fig. 3. The large error bars for the DANB samples are due to the small nonlinear coefficients measured for this polymer. This measurement illustrates that the electrical properties can be tuned by means of copolymerization, keeping in mind, however, that other properties like the linear refractive index or glass transition temperature change as well.
In conclusion we have used a technique based on Maker fringe measurements of the nonlinearity to directly evaluate the poling efficiency in stacks of nonlinear and linear poly-mer layers. This method is suitable for identifying low resis-tivity cladding materials for improved poling efficiency. Us-ing a nonlinear 共linear兲 polymer material with a known absolute specific resistivity as a standard, it would also allow the determination of the absolute resistivities of linear 共or nonlinear兲 polymers. Error analysis shows that the main un-certainty in the measured relative resistivity 2/1 is due to
the uncertainty in the measured nonlinear coefficient共Maker fringe measurement兲 and the fitted slope of the nonlinearity-field dependence 共Fig. 2兲. The experimental error decreases with increasing nonlinear coefficient and increasing layer thicknesses. The relative error of the quantity 2/1 from a single measurement can vary between 25% and 100%, and thus several independent measurements may be required to improve the accuracy. The precision of the technique is fur-ther reduced if the relative resistivities differ by more than an order of magnitude. Moreover, the method can be used only if the contact resistances are negligible which requires the use of electrode materials with low work functions. How-ever, within these limits, this method is a useful tool for studying the dc electrical properties of linear and nonlinear-optical polymers with respect to their implementation in waveguide devices. In particular, it probes directly the effec-tive poling field without measurement of the absolute resis-tivity. As an example of the application of this technique we have investigated the electrical properties of PMMA-PS co-polymers with varying molar ratio. The method could be further used to study for example the effect of varying chro-mophore loading on the resistivity of the nonlinear polymer or to evaluate the optimized poling temperature for a given material system.
This research was supported by AFSOR through JPL Contract No. 961393 and by BMDO STTR Grant No. F29601-98-C-0205. T.P. wishes to acknowledge financial support by Swiss National Science Foundation.
1Molecular Nonlinear Optics, edited by J. Zyss共Academic, San Diego, CA, 1994兲.
2Ch. Bosshard, K. Sutter, Ph. Preˆtre, J. Hulliger, M. Flo¨rsheimer, Ph. Kaatz, and P. Gu¨nter, Organic Nonlinear Optical Materials共Gordon and Breach Publishers, Basel, 1995兲.
3
Nonlinear Optics of Organic Molecules and Polymers, edited by H. S.
Nalwa and S. Miyata共CRC, Boca Raton, FL, 1997兲.
4D. Chen, H. R. Fetterman, A. Chen, W. H. Steier, L. R. Dalton, W. Wang, and S. Yongqiang, Appl. Phys. Lett. 70, 3335共1997兲.
5M. Ja¨ger, G. I. Stegeman, S. Yilmaz, W. Wirges, W. Brinker, S. Bauer-Gogonea, S. Bauer, M. Ahlheim, M. Sta¨hlin, B. Zysset, F. Lehr, M. Di-emeer, and M. C. Flipse, J. Opt. Soc. Am. B 15, 781共1998兲.
6G. I. Stegeman and R. H. Stolen, J. Opt. Soc. Am. B 6, 652共1989兲. 7K. D. Singer, J. E. Sohn, and S. J. Lalama, Appl. Phys. Lett. 49, 248
共1986兲.
8
R. Blum, M. Sprave, J. Sablotny, and M. Eich, J. Opt. Soc. Am. B 15, 318
共1998兲.
9K. D. Singer, M. G. Kuzyk, and J. E. Sohn, J. Opt. Soc. Am. B 4, 968
共1987兲.
10
J. Brandrup, E. H. Immergut, and E. A. Grulke, Polymer Handbook, 4th ed.共Wiley, New York, 1999兲.
FIG. 3. Relative effective poling field E1/E0across the nonlinear polymer
for DR1/PMMA and DR1/PS samples as a function of the relative thickness of the two layers. The field E1 was deduced from Maker fringe
measure-ments of the nonlinear-optical coefficient of the DR1 layer. The lines indi-cate fits according to Eq.共1兲 with the relative resistivity2/1 as a free
parameter yielding2/1⫽0.6⫾0.3 for PMMA/DR1 and 4.7⫾0.9 for PS/
DR1.
FIG. 4. Relative resistivity2/1of (PMMA)x⫺(PS)1⫺xcopolymers and
DANB共upper data points兲 and DR1 共lower data points兲, respectively, as a function of the PMMA mole fraction x in the copolymer. The values for pure PMMA and PS are given at x⫽1 and x⫽0, respectively. The poling temperature was 100 °C for the DANB and 120 °C for the DR1 samples.
267
Appl. Phys. Lett., Vol. 76, No. 3, 17 January 2000 Plisˇkaet al.