HAL Id: hal-01272287
https://hal.archives-ouvertes.fr/hal-01272287
Submitted on 10 Feb 2016
HAL is a multi-disciplinary open access
archive for the deposit and dissemination of
sci-entific research documents, whether they are
pub-lished or not. The documents may come from
teaching and research institutions in France or
abroad, or from public or private research centers.
L’archive ouverte pluridisciplinaire HAL, est
destinée au dépôt et à la diffusion de documents
scientifiques de niveau recherche, publiés ou non,
émanant des établissements d’enseignement et de
recherche français ou étrangers, des laboratoires
publics ou privés.
the French rail monopoly
Patricia Perennes
To cite this version:
Patricia Perennes. Intermodal competition: studying the pricing strategy of the French rail monopoly.
Transport Research Arena 2014, Apr 2014, Paris, France. �hal-01272287�
Transport Research Arena 2014, Paris
Intermodal competition: studying the pricing strategy of the French
rail monopoly
Patricia Perennes
1Centre d’économie de la Sorbonne, Paris, France Réseau ferré de France Paris, France
Abstract
In most countries, passengers’ rail transportation is characterized by a monopoly. Nevertheless, it does not mean that the monopolist -usually the national company- does not face competition, in the form of intermodal competition (planes, cars). This article focuses on the French national rail company (SNCF) that still has a monopoly on national passenger traffic. It analyses SNCF’s pricing behavior on most of the origin/destination pairs it operates with high speed trains to/from Paris.
It takes into account the fact SNCF enjoys a limited leeway to set its prices because ticket prices are still regulated in France. The existence of such a price cap regulation is an opportunity for an economist to analyse how a transportation company facing intermodal competition sets its prices. Usually, such an analysis is hard to conduct since transport prices are set following yield management principles.
Keywords: Railroad; pricing strategy; intermodal competition
Résumé
Dans de nombreux pays, l’industrie ferroviaire est organisée de façon monopolistique. Cela ne signifie toutefois pas que l’entreprise en monopole, généralement une entreprise d’Etat, ne soit pas soumise à une forme de pression concurrentielle du fait de la concurrence intermodale du transport aérien et des véhicules personnels. Cet article s’intéresse à l’opérateur national ferroviaire français, la SNCF, qui est aujourd’hui encore en monopole sur le segment du transport national de passagers. Il étudie le comportement tarifaire de la SNCF sur la plupart des dessertes grande vitesse qu’elle opère depuis/en direction de Paris.
Il prend en compte le fait que la SNCF ne bénéficie que d’une liberté restreinte pour fixer ses tarifs, car les prix des billets de train sont toujours régulés en France. L’existence d’une telle régulation, qui prend la forme d’un plafonnement de prix, permet à l’économiste d’étudier comment une entreprise de transport qui fait face à une concurrence intermodale détermine ses prix. Habituellement, une telle étude est difficile à entreprendre car le prix des services de transport sont régis par les principes du yield management.
Mots-clé: Chemin de fer ; stratégie tarifaire ; concurrence intermodale
1
1. Introduction
In France, the railway national passengers’ transport is still characterized by a monopoly. This monopoly is set by the orientation law on domestic transportation (Loi d’Orientation des Transports Interieurs) of 1982 which gave Société Nationale des Chemins de Fer (SNCF) the exclusive right to operate the domestic railway network.2 Since the national railway company is still the only company providing domestic railway transportation, one could expect that SNCF’s pricing strategy will be the one of a monopoly. However, two reasons prevent SNCF to act as such. First, if there is no intramodal competition, there is for certain services a strong intermodal competition of air and road transportation. Second, train tickets’ prices are not totally freely set by SNCF. The French state regulates these prices because transportation is, in a certain extent, a public service activity (Perennes (2012).
This article analyses SNCF’s pricing strategy on most of the origin/destination pairs (O&D) it operates from/to Paris with high-speed (HS) trains, taking into account the limited leeway that the company enjoys to set its prices because of price ticket’s regulation. It studies how the monopoly adapts its pricing strategy taking into account the intermodal competition, staying however into the institutional framework set by the French regulation. The fact this price cap based regulation exists is also an opportunity for an economist to analyze how a transportation company facing intermodal competition sets its prices. Usually, such an analysis is hard to conduct since transport price (especially for HS rail and airlines) are set following yield management principles.3 There is no “average prices” in such industry and price comparisons therefore require huge amount of data and significant computer resources.
Two unique distinct data sets were entirely collected for the present study. The first one encompasses most of the train tickets maximum prices for O&D operated from/to Paris by SNCF from 2007 to 2012. This data set enables to study econometrically the main determinant of SNCF’s pricing strategy. The second data set includes prices directly retrieved from SNCF’s and airlines companies’ websites. It includes prices for selected planes and trains on specific O&D characterized by air intermodal competition.
This article also gives some insight on the type of competition that would better suit passengers’ rail transportation. The European Commission is currently considering liberalizing fully passengers’ rail transportation.4 This liberalization means splitting network and operations in order to introduce intramodal competition. On the contrary, other countries in the world (in particular Japan and the US) have chosen to keep a vertically integrated railway industry and to rely only on intermodal competition or “yardstick competition” to promote efficiency.
It is organized as follows. First, it reminds how transport economic literature has studied intermodal competition and explains how this article finds its place in this literature (section 2). It then briefly describes the market for national passengers’ transportation in France (section 3). Based on this description, it empirically analyses the main determinants of SNCF’s pricing strategy taking into account the regulatory constraints SNCF faces (section 4). To strengthen the conclusion of section 4, section 5 provides an additional analysis, comparing prices series of train and airplane tickets on selected routes. Section 6 summarizes the main findings and concludes.
2
Competition is however possible on freight transportation and international passengers’ transportation since 2004 and 2009. International transportation also includes “cabotage”, i.e. the right for a company providing an international service to allow some passengers to travel nationaly if the train stops in intermediary stations located in the same country than the departure/arrival point Nevertheless, there is currently only one alternative transport operating company offering international service (between Paris and Italy) and it does not offer cabotage for its passengers.
3 “Yield management is the process of understanding, anticipating and influencing consumer behavior in order to maximize
yield or profits from a fixed, perishable resource (such as airline seats or hotel room reservations).” (Wikipedia).
4 On January 10th the European Commission has presented a draft proposal of the fourth railway package. One of the main
Patricia Perennes / Transport Research Arena 2014, Paris
2. Literature review
Intermodal competition between rail transportation and air transportation has been extensively studied by transport economic literature; see for example the literature review of Capon et al. (2003) or the recent article of Behrens (2011). However, articles studying this issue usually choose to focus on intermodal competition from the passengers’ point of view using stated or revealed preferences data and logit models.
The approach of the present article is slightly different. It focuses on the overall pricing strategy of the incumbent company for its whole HS offer. The question is not how passengers choose their transport mode but how a company facing intermodal competition sets its prices on all the routes it offers taking into account intermodal competition and the institutional framework (price regulation). It does not use preferences data but prices data.
Transport economists have also studied the impact of intramodal competition and market structure on pricing strategies within the airline industry; see for example Stavins (2001). Only one recent article, Bergantino (2012), takes into account the possible intermodal competition on airline prices.
The very small number of studies focusing on transport companies’ pricing strategy can be explained by the difficulty there is to collect relevant data in this industry. Indeed, transportation pricing strategies are based on yield management. There is therefore no such thing as an “average” price for an O&D. Transportation companies’ pricing strategies are a black box. Conducting an empirical analysis requires to have either a direct access to data or significant computer resources to collect prices on the various companies’ websites.
3. The market for rail passengers transportation in France
In mainland France, passengers can use - besides their personal cars - trains or planes to go from one city to another.5 For each of these three modes (personal cars, airlines, trains), the extent of the transportation offer, the pricing strategies and, if relevant, the price regulation are described in the following paragraphs.
3.1. Personal cars
The highway network is well developed. It covers almost the whole country and is in good shape (see map 2). In addition, every French city is reached by the secondary road network. Regarding driving costs, only highways have toll booths. The secondary road network is free. Toll fees are regulated. They are reevaluated each year by the government. Driving costs also include gas expense. Gas prices are freely set by companies. However, taxation represents more than a half of the prices at the pump.
3.2. Air transportation
Inland France airlines network is also well developed with numerous routes offered by the incumbent operator Air France (see map 3). However, Air France reduced its offer over the past twenty years for some of its O&D that face a strong competition from TGV.6 In the late 2000s, following the European air transport liberalization,
5
For legal reasons, there are no long distance coaches in France. Indeed, the French law gives SNCF the final approval for all national coach passengers’ services. The idea is to protect SNCF’s rail monopoly, avoiding coaches’ intermodal competition. Since 2012, international coaches are allowed to offer half of their seats for national transportation. However, since our data set encompasses the year 2007 to 2012 that does not impact our analysis.
6
numerous low cost carriers (LCC) have started to offer air service. Business airlines constitute a third category of airlines (Chalair, Hex-air). Prices are freely set by companies. They are based on yield management principles.
3.3. Rail network
France has an extended rail network. SNCF is the only company offering national rail transportation because it enjoys a legal monopoly.
There are two types of trains: HS trains (TGV) and “normal speed” trains (Intercités or IC). TGV can use both HS and normal tracks, when IC can only use normal tracks. This ability enables TGVs to offer service to numerous cities, even if HS lines only constitute a small portion of the entire network (see map 1). If one excludes regional transportation, almost 90% of the passengers’ rail transportation is operated by HS trains even if HS lines represent less than 10% of the rail network. For most of the cities served by TGV, there is no “regular” IC offer.
Train ticket prices are regulated by the state through SNCF’s specifications (“cahier des charges”). Regulation only affects second class tickets.7 It differs for IC and TGV. For ICs, the basic fare (BF_ICi) for an O&D i is
calculated by a simple formula:
BF_ICi= A*kmi + B (1)
Where kmi is the number of kilometers for the O&D i, A and B are a value couple defined for different ranges of kilometres (less than 16km, between 16km and 32km, etc.). A and Bare set each year by SNCF and approved by the French Secretary of Transportation. A reduction coefficient may be applied to this basic fare. For example, kids under 12 get 50% off, some commercial cards give 25 to 60% off, etc.
For TGVs,8 the system is more complex. For each O&D, SNCF sets a basic fare (BF_TGVi) that is approved by
the French Secretary of Transportation. To obey the regulation, these basic fares cannot depart too far from the “kilometric reference” i.e. the basic fare that would have been calculated if the numeric constants (A,B) defined above were applied. More precisely, the regulation gives a 40% leeway to SNCF (hereafter we call this room for manoeuvre “the 40% leeway rule”). Formally, the BF_TGVi should be encompassed by:
(1-40%) (A*kmi + B) < BF_TGVi < (1+40%) (A*kmi + B) (2)
However, these BF_TGVi only constitute price caps: SNCF is free to sell tickets below these price levels.
Therefore, SNCF has established numerous discounted fares for each O&D. That enables the national company to have a pricing strategy partially based on yield management principles, as underlined by Mariton (2008).
7
It does not affect first class tickets Since the 1980s, SNCF is free to set is price for its first class tickets, mainly intended for business travelers. Nevertheless, SNCF chose as a commercial policy to set the first class tickets’ prices equal to 1.5 times the second class tickets’ prices. This is however not a legal rule, just commercial policy.
8 This regulation is also applied to some ICs (called “Corail Teoz” or “Intercités avec réservations obligatoires”). This article
Patricia Perennes / Transport Research Arena 2014, Paris
Map 1: Rail network
Source: portail ferroviaire de Guillaume Bertrand In red, the HS lines
In blue, the regular network Map 2: Motorway network
Source : Arcachon guide
Map 3: Air France national network (from/to Paris)
Source: Air France
To give an idea of the distances involved, there are 932km between Paris and Nice (9h30 by car and a €72.50 motorway toll, 1h20 by air, 5h37 by train). Between Paris and Brest, there are 592km (6h21 by
car and a €28.10 motorway toll, 1h10 by air and 4h29 by train).*
*: Distances, travel time by car and toll fees are given by the website “viamichelin.fr”. Air travel time and train
travel time are given by Air France’s and SNCF’s websites.
4. Empirical analysis of the main determinants of SNCF’s pricing strategy
As explained in section 2, the “natural approach” to study SNCF’s pricing strategy (and reply to intermodal competitive pressure) is to collect an important set of actual prices of SNCF and of its competitors along with their sale dates. These data are of course not directly available because of business confidentially. However, the French legislation can give us an insight in SNCF’s pricing strategy. As explained in the previous section, SNCF’s train ticket prices are still strongly regulated. For ICs, the national company does not have any freedom to differentiate its price depending on the specific situation of a particular O&D. The basic fare is calculated through a linear formula based on the number of kilometres (the “kilometric reference”). For TGVs, the incumbent company submits yearly for approval to the French Secretary of Transportation a list of basic fares. Each of these basic fares can depart for the kilometric reference depending on the “conditions of speed and comfort” and on the “competitive situation” (cf. SNCF’s specifications) of each O&D. Since SNCF has the lead on the setting of TGVs’ different basic fares (the Secretary of Transportation only approves them) and since it is allowed by its specifications to adapt them to the competitive pressure, one can study how SNCF uses the leeway it gets from the regulation to adapt its basic fares, in particular how it takes into account intermodal competition. We explain above that SNCF’s pricing strategy is partially based on yield management principles. However, using these basic fares is still relevant. Firstly, because these fare are applied to almost 20% of the passengers. Secondly, because most of the discounted fares offered by SNCF (40% of the total number of tickets sold by SNCF)9 are calculated based on these basic fares (a reduction coefficient is applied to these basic fares). Setting the basic fares has a strong influence on the overall pricing strategy for an O&D.
4.1. Data set
This article focuses on TGV ticket prices. It does not study IC prices. It also only studies the price of tickets between Paris and other cities (and not between two cities other than Paris).
We choose to study the ratio between the actual TGV’s basic fare and the kilometric reference (hereafter “the ratio”).
R = BF_TGVi / (A* kmi + B) (3)
Where BF_TGVi is the TGV basic fare for the O&D i, A and B are the value couple necessary to calculate the kilometric reference and kmi the number of tariff kilometres of the O&D. Because of the 40% leeway rule, this ratio should lie between 0.6 and 1.4 for each O&D. If the value of the ratio is below 1, it means that train tickets prices are relatively cheap for this O&D: SNCF uses the leeway its gets from the State to decrease its prices below the kilometric reference. That should be the case if intermodal competition is strong. On the contrary, if the ratio is high (close to 1.4) it indicates that intermodal competition is low. Looking at the data, one finds that in compliance with price regulation, the value of the ratio is never below 0.6 or above 1.4. More precisely, this ratio is on average equal to 1.13 but never go beyond 0.89 with a maximum value of 1.39. In other words, SNCF mostly uses the leeway it gets from the regulation to set its prices above the kilometric reference.
The competitive pressure can be tackled from two angles: price and travel time as explained by Crozet (2005). Train travel time corresponds to the quickest alternative for an O&D. Driving times -under fluid traffic conditions- were collected on the website “viamichelin”, a website helping individual drivers to plan their trips. To avoid multicollinearity, the model does not use the total driving time but the relative speed compared to rail. If there is always an alternative to rail transportation by car (since all cities in France are linked to the road network) that is not always true for air transportation. When it is possible to fly to Paris, the variable standing for flying time was calculated based on four elements: time necessary to go by car from the city center to the closest airport, flight duration, time necessary to go from the airport by car to Paris center and 30 additional minutes due
9
Data available in « La SNCF répond aux critiques des clients et des régions sur les prix du TGV », Les Echos n° 21440, May, 22th 2013
Patricia Perennes / Transport Research Arena 2014, Paris
to check-in and security checks. Then, a dummy variable was created that equals 1 if there is a “credible” plane alternative to train, i.e. if it is possible to fly to Paris and if the total flying time is equal or inferior to the train travel duration.
To apprehend price competition, the data set includes the driving cost per kilometre (toll fees and gas expense). Prices’ evolutions are taken into account. Looking at the difference between the price of a regular train ticket (the BF_TGVi defined above) and the total driving cost, one finds that on average it is cheaper for a driver that is alone in his or her car to take the HS train. It is particularly true for remote destinations with expensive toll fees. Driving may however be cheaper when the quickest way is a road without toll booths.
Since air transportation prices are based on yield management principles, it is not possible to estimate an “average” price for air transportation. Therefore, the only proxy for price competition that can be used is the existence of LCC service.
Other elements can impact train tickets’ prices level per kilometres. Geographical and demographical characteristics such as the importance of the destination station (number of passengers) and the “line” on which the destination city is located may be taken into account.
Differences in costs can also explain the relative variation of the ratio. There is no reason to think that the cost of the rolling stocks differs from one city pairs to another. What can however dramatically differ is the cost of tracks (tracks building and tracks maintenance) and therefore the cost of tracks usage. Currently in France there is a vertical unbundling between operations and infrastructure. So, it is possible to single out the costs of tracks usage for SNCF. They correspond to the track access charges paid by SNCF to the company that owns the network, namely Réseau Ferré de France (RFF). These track access charges are available through an interface developed by RFF for the train operating companies. Here again, the model does not use the total amount of access charge, but the price paid by kilometer. There is a wide variation in the track access charges (between €3.30 per km and €21.45 per km). They have constantly increased during the time period. The most expensive track access charges can be found in 2012 for city pairs that are totally covered with HS tracks.
4.2. Empirical analysis
In the model, the ratio is supposed to be correlated with the existence of an airline service for the city pairs (“plane alternative”); the existence of a LCC service (“LCC alternative”); the relative driving time; the driving cost per kilometer; the logarithm of the annual number of passengers in the destination station10; the average access charge per kilometer and the “line index”.
Data are available for 6 years, between 2007 and 2012. Therefore, it is possible to use panel-data models. Because of the very nature of the data studied, some explanatory variables are time-invariant (number of passengers, line index) or “quasi time invariant” (car relative duration, existence of a “credible” regular airline alternative). In addition, the within variations of R and of many other variables changing over time (LCC alternative, driving cost per kilometer and access charge per kilometer) are rather small compared to the between variations. Therefore, the coefficient of regressors will be imprecisely estimated in a fixed effect model. A natural solution is to use a random-effects model (RE).
(4) i indicates the different city pairs and t indicates the years. Variables X change over time when Z are time
invariant. αi are the random individual specific effects.
10
We choose to use the logarithm of the annual number of passengers in the destination station because the range of this value is very wide. Using the logarithm allows us to smooth this value.
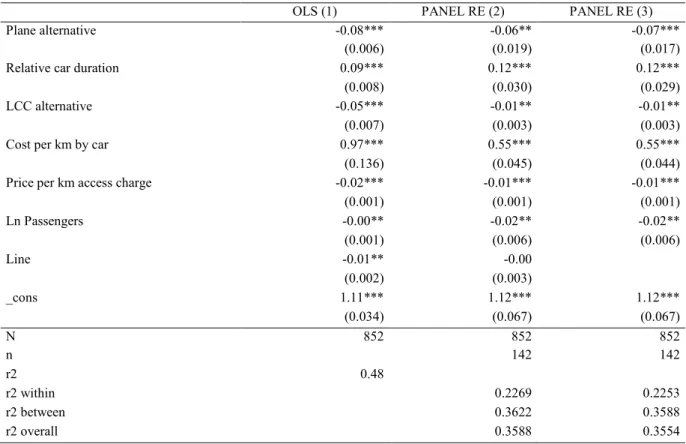
In addition to this RE model, one can also use a simple pooled ordinary least square regression (OLS) to estimate the influence of the various regressors with a using all city pairs for all years. For both models, regressors are jointly significant, with a p-value of 0.000. Coefficients have the same symbol in both models. More than one third of the variation is explained with R2 around 0.35-0.48.
Table 1: Results of empirical models
OLS (1) PANEL RE (2) PANEL RE (3)
Plane alternative -0.08*** -0.06** -0.07***
(0.006) (0.019) (0.017)
Relative car duration 0.09*** 0.12*** 0.12***
(0.008) (0.030) (0.029)
LCC alternative -0.05*** -0.01** -0.01**
(0.007) (0.003) (0.003)
Cost per km by car 0.97*** 0.55*** 0.55***
(0.136) (0.045) (0.044)
Price per km access charge -0.02*** -0.01*** -0.01***
(0.001) (0.001) (0.001) Ln Passengers -0.00** -0.02** -0.02** (0.001) (0.006) (0.006) Line -0.01** -0.00 (0.002) (0.003) _cons 1.11*** 1.12*** 1.12*** (0.034) (0.067) (0.067) N 852 852 852 n 142 142 r2 0.48 r2 within 0.2269 0.2253 r2 between 0.3622 0.3588 r2 overall 0.3588 0.3554
Note: Standard errors in parentheses *p<0.05, ** p<0.01, *** p<0.001
Coherently with hypothesis, the existence of an air alternative to train and/or of a LCC service decrease the value of the ratio: SNCF decreases its tickets’ prices when it faces intermodal competition. More precisely, the existence of an airline service leads to a decrease of 0.06 to 0.08 (depending of the model) of the ratio. That means a decrease of €6 to €8 for a €100 ticket. LCC have a smaller impact on price.
The positive coefficient associated to the relative car duration is harder to interpret. This variable is always positive and always superior to 1. If the driving time is almost equivalent to the train time travel (i.e. the relative duration is close to 1) it increases the ratio but less than if the train is most “time competitive” (for example if the relative car duration is close to 3). For a €100 ticket for a service where driving or taking a train have similar duration, the price would be €9 to €12 more expensive if the train was two time faster.
The interpretation of the positive coefficient associated to driving cost per kilometer is similar. This variable is always positive. The most expensive the driving cost per kilometer, the higher the ratio. This means that when driving is expensive, SNCF can increase its prices. For a €100 ticket an increase of €0.05 of the driving cost per kilometre (which is an important increase, knowing that the average driving cost is €0.16) would lead to an increase of €3 to €5 euros. Both results are coherent with hypothesis.
The line index is not significant. The coefficient associated to the annual numbers of passengers is negative. Passengers getting off in important stations pay relatively less than passengers getting off in smaller one.
Patricia Perennes / Transport Research Arena 2014, Paris
Regarding access charges, the coefficient -even if it is rather small- seems to be counter intuitive. The negative sign means that the ratio is smaller for a city pair with expensive access charge than for a city pair with lower access charge. In other words SNCF is not passing to the passengers the difference in its “production costs”. On the contrary, the more SNCF pays RFF for tracks access, the cheaper the tickets. Hence, the ratio and the access charges are probably endogenous. A recent press article on TGV pricing wrote about RFF’s pricing behaviour “The closer to saturation a service is, the more expensive the access charge”.11
4.3. Conclusion of empirical analysis
This empirical analysis enables us to conclude that SNCF takes into account intermodal competition when it sets its basic fares. To supplement this analysis, based on basic fares but not on the actual prices paid by travelers, it may be worthwhile to look at “hour by hour” prices, based on data directly retrieved on SNCF’s and its competitors’ websites simulating reservations. This enables us to get a better understanding of the utilization of yield management principles by SNCF and of the actual effects of the regulation constraints.
5. Comparative analysis of price time series for selected O&D
For 19 cities, price data for service from Paris were collected between July, 25th 2012 and October, 22th 201212 for different departure times on October, 25th and 26th. Every 8 hours, the various tickets’ prices for SNCF, Air France and a LCC (Easy Jet) were collected on their websites. Given the nature of the data at disposal, the analysis conducted in this part is based on descriptive statistics and graphical analyses. The simplest way to analyze price evolutions is to compare the prices of different groups of tickets (train/regular airline/LCC) for an O&D and for one time period.
Three “rules” emerge from these graphical and qualitative comparisons of price series:
• SNCF’s and Easy Jet’s prices seem correlated. If one excludes the last few days before departure, the difference between SNCF’s prices and Easy Jet’s prices is on average around 25€.
• Air France’s prices are usually much higher than Easy Jet’s/SNCF’s prices. On average, flying with Air France costs 150€ more than taking the train. A strong increase in Air France’s prices is usually followed by a small increase in SNCF’s prices.
• A few days before the train/plane departure SNCF’s prices hit the maximum price set by regulation (BF_TGVi), therefore taking the train is a much cheaper option than flying. On the 151 TGVs in our data set,
133 hit the cap set by the regulation.
A more quantitative approach, based on a more extended data set, would be valuable to consolidate these findings. It would also be interesting to understand the causes of the correlations between SNCF’s/Easy Jet’s prices on the one side and Air France’s/SNCF’s prices on the other. Are these correlations based on an intentional pricing strategy or are they due to the fact all these companies used the same kind of pricing models (based on yield management)? The reply to this question may be important to ascertain if transports companies act as an oligopoly or if the market properly works.
11“Plus la ligne est proche de la saturation, plus les péages sont chers”. « Pourquoi est-il si cher ? Le scandale du TGV
Nord », Nordway, september 2013.
12 The initial plan was to collect data for 3 months, i.e. till the day of departure of the train. Unfortunately a strike took place
6. Conclusion
In this article, we have found a tool – the current French regulation of train ticket prices – that enables us to look into the “black box” of transportation companies’ pricing behavior. Based on an original dataset, we have proved that SNCF adapts its whole price offer to intermodal competition.
These findings may give food for thought in the context of the rail industry liberalization. Even if a complete intramodal competition is hard to put into practice in the short run because of the organization problems it triggers, intermodal competition may be a good way to damper the monopolistic strategy of the railroad incumbent. For O&Ds with no viable airline alternative (in particular when both cities are “too close” to each other), a solution to increase intermodal competition may be to allow private long distance coaches (Abraham, 2011). Another solution may be to introduce intra modal competition in priority on the routes without air travel alternative.
A complementary analysis, based on price directly retrieved from the companies’ websites, shows that prices regulation effectively restricts SNCF’s ability to set its prices: a few days before departure train is usually the cheapest alternative. This finding also raises complex questions in the context of liberalization. This regulation, that already has consequences on intermodal competition, may also distort intramodal competition. Should the new entrants also be restricted in their ability to set their prices? And more generally is this kind of regulation compatible with the plans of the European Commission?
References
Abraham, C. (2011) L’ouverture à la concurrence du transport ferroviaire de voyageurs, CAS
Antes, J., Friebel, G., Niffka, M., and D. Rompf (2004): “Entry of Low-Cost Airlines in Germany. Some Lessons for the Economics of Railroads and Inter-Modal Competition”, Paper presented on the 2nd Conference
on Rail Industry Structure, Competition and Investment, Evanston, USA
Bergantino, A. S. and Capozza Claudia, (2012), “Airline Pricing Strategies in Captive Markets: which factors really matter?” Working Paper
Behrens, C. & E Pels. (2011) “Intermodal competition in the London-Paris passenger market: High-Speed rail and air transport”, Journal of Urban Economics 71(3) pp278-288
Capon, P., Longo, G.& Santori, F. (2003) “Rail vs. Air Transport for Medium Range Trips”. ICTS, Nova Gorica, pp. 1-11
Crozet, Y. (2005) “Le temps et les transports des voyageurs” in Le temps et les transports Table Ronde 127, Conférence Européenne des Ministres des Transports, OCDE
Ivaldi, M. and C. Vibes (2008) “Price Competition in the Intercity Passenger Transport Market: A Simulation Model”, Journal of Transport Economics and Policy, 42, (2)
Mariton H. (2008) Rapport d’information déposé en application de l’article Assemblée Nationale du règlement
par la commission des finances de l’économie générale et du plan sur la politique tarifaire de la SNCF
Perennes, P. (2012) “Pourquoi les tarifs de la SNCF sont-ils régulés?”, Concurrence, 3-2012
Stavins, J. (2001). “Price Discrimination in the Airline Market: The Effect of Market Concentration”. The Review of Economics and Statistics, 83(1) pp200-202.