HAL Id: hal-02789552
https://hal.inrae.fr/hal-02789552
Submitted on 5 Jun 2020
HAL is a multi-disciplinary open access
archive for the deposit and dissemination of sci-entific research documents, whether they are pub-lished or not. The documents may come from teaching and research institutions in France or abroad, or from public or private research centers.
L’archive ouverte pluridisciplinaire HAL, est destinée au dépôt et à la diffusion de documents scientifiques de niveau recherche, publiés ou non, émanant des établissements d’enseignement et de recherche français ou étrangers, des laboratoires publics ou privés.
growing pigs and sows to challenging environmental
conditions
. Inra
To cite this version:
. Inra. Databases with traits relative to the adaptation of growing pigs and sows to challenging environmental conditions. [Contract] D2.7, 2019. �hal-02789552�
1
FEED-A-GENE
Adapting the feed, the animal and the feeding techniques to
improve the efficiency and sustainability of monogastric livestock
production systems
Deliverable D2.7
Databases with traits relative to the
adaptation of growing pigs and sows
to challenging environmental
conditions
Due date of deliverable: M54
Actual submission date M54
Start date of the project: March 1st, 2015 Duration: 60 months
Organisation name of lead contractor: INRA
Revision: Final
Dissemination level
Public – PU x
Confidential, only for members of the consortium (including Commission Services) - CO
2
Table of contents
1. Summary... 3
2. Introduction ... 4
3. Description of the research ... 4
4. Databases ... 11
5. Access to the database ... 15
6. Conclusions ... 15
3
1. Summary
Objectives:
Feed-a-gene aims to better adapt different components of monogastric livestock production systems to improve the overall efficiency and to reduce the environmental impact. This involves among others the development of new and alternative feed resources and feed technologies, the identification and selection of robust animals that are better adapted to fluctuating conditions and the development of feeding techniques that allow optimizing the potential of the feed and the animal. In the project, one objective of WP2 “New traits for feed efficiency” was to evaluate the short and long-term consequences of environmental perturbations on feed efficiency. The data generated in three trials performed in Feed-a-Gene can be used for modelling the response of pigs to changes in environmental conditions. These dynamic models will help to better account for environmental disturbances and robustness in pig production. These data will be also used for validating models dealing with the detection of individual responses of pigs to perturbations in feed intake implemented in the WP3 of the Feed-a-Gene project.
The databases presented here contain data on individual growth performance recorded daily in finishing pigs submitted to short-term environmental challenges. These challenges included temporary provisions of a low-energy-density diet or a diet contaminated with deoxynivalenol (DON), or short exposures to an acute heat stress (HS) challenge. Part of results related to these databases have been published (Renaudeau et al., 2017; Serviento et al., 2018) or will be published soon (Renaudeau, in preparation).
Teams involved:
INRA PEGASE
Data and results of three experiments with pigs carried out by INRA are included in the databases.
Species and production systems considered:
4
2. Introduction
In pig production, 60 to 70% of the total production costs are due to feed expenses. The reduction of feeding costs remains a major preoccupation for maintaining or increasing the competitiveness of the pig industry. Small increments/deteriorations in feed efficiency can have major impact on farm profitability. Feed efficiency is a complex trait which depends on a large number of factors such as animal factors (e.g., breed, gender, and age), nutritional factors (e.g., the quantity and the quality of feed) and environmental factors (e.g., management, health and climate). In commercial conditions, pigs are frequently facing environmental perturbations with subsequent short and long-term effects on their health and performance. However, quantitative information describing impacts of short-term environmental challenge is lacking.
The aim of the present deliverable is first to provide original data on short and long-term responses to single or repeated acute dietary or thermal challenges. As initially planned in the project, data had to be obtained both on growing pigs and on sows. One of the objectives of the project was to build databases for having the possibility to access the inter-individual variability in the responses to environmental perturbations. To reach this goal, we decided to focus only on a single animal model (i.e., growing-finishing pigs) to be able to perform measurements on a larger number of animals using designs with a greater statistical power than originally planned. In comparison to what was planned, 365 pigs were used instead of 200 and three different environmental challenges were tested instead of two.
A first experiment was carried out with a DON contaminated diet. Pigs are highly sensitive to mycotoxins including DON because they have limited metabolic ability to transform DON into less toxic products. They are generally fed with cereal-based diets, which are sensitive to mycotoxin contamination. Among the broad family of mycotoxins, DON is often associated to a reduced performance in livestock, with symptoms including feed refusals and digestive disorders. Our hypothesis is that the reduced performance observed during a 5-d challenge period of feeding a DON contaminated diet would have both short and long-term consequences on feed efficiency. A second experiment was carried out with a high-fibre diet for simulating a challenge imposed to pigs by an abrupt diet transition from a normal diet to a diluted, low-nutrient fibrous diet. A third experiment was designed for evaluating the impact of an acute heat stress challenge on pig performance and feed efficiency.
3. Description of the research
Experiment 1:
Animals and Treatments: A total of 160 Pietrain × (Large White × Landrace) pigs were used in
the experiment during two replicates, with each pig individually measured for live body weight (BW) and individual feed consumption using an automatic weighing station and electronic feeding stations. The two replicates of the experiment were conducted at the INRA experimental facilities at the Unité Expérimentale Porcs de Rennes (UEPR) located in Saint
5
Gilles, France. Each replicate had an equal number of castrated males and females. Within each replicate, pigs were blocked according to sex and litter origin, and were allotted to one of four experimental treatments in a randomized complete block design. From 91 to 98 d of age, the pigs started the transition from a commercial grower diet to the control finisher diet. The measurement period of the experiment started and ended at 99 and 154 d of age, respectively, and all pigs were slaughtered at 161 d of age.
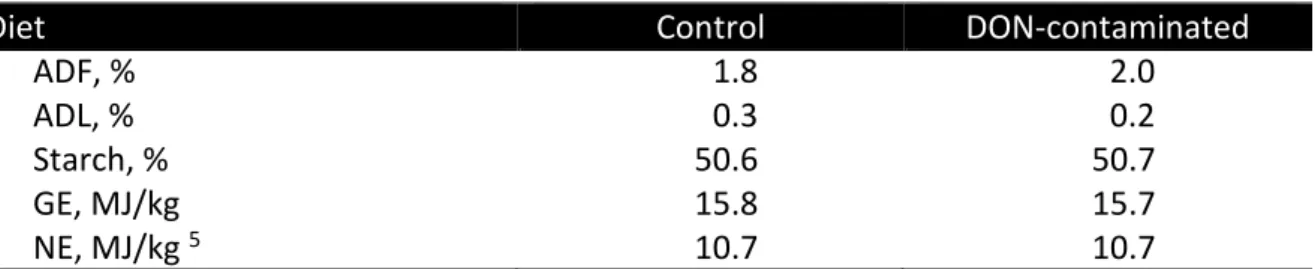
The two diets used were based on corn and soybean meal and were formulated to contain the same amount of standardized ileal digestible lysine per MJ of NE (0.8 g/MJ NE) and to meet the ideal protein profile for essential amino acids (Table 1).
Table 1. Composition of experimental diets (Exp. 1)1
Diet Control DON-contaminated
Ingredients, % as-fed Corn 75.00 - Corn, DON-contaminated - 75.00 Wheat bran 1.54 1.64 Soybean meal 18.10 18.00 Molasses 2.00 2.00 Lysine HCL 0.21 0.21 DL-Methionine 0.08 0.08 L-Threonine 0.06 0.06 L-Tryptophan 0.01 0.01 Dicalcium phosphate 1.00 1.00 Calcium carbonate 1.00 1.00 Salt 0.50 0.50 Vitamin-Mineral Premix2 0.50 0.50 Calculated composition3 Crude Protein, % 14.3 14.4 NE, MJ/kg 10.3 10.3 SID Lys, g/kg 7.7 7.7 SID Lys/NE, g/MJ 0.8 0.8 SID SAA, g/kg 0.6 0.6 SID Thr, g/kg 0.7 0.7 SID Trp, g/kg 0.2 0.2 Ca, g/kg 7.8 6.5 Dig P, g/kg 2.5 2.1 Dig P/NE, g/MJ 0.3 0.3 Ca/P dig 3.1 3.1 Analysed composition4 Dry matter, % 87.0 87.0 Crude protein, % 14.2 14.1 Crude fat, % 3.1 2.3 Crude fibre, % 1.5 1.7 NDF, % 6.3 7.5
6
Diet Control DON-contaminated
ADF, % 1.8 2.0
ADL, % 0.3 0.2
Starch, % 50.6 50.7
GE, MJ/kg 15.8 15.7
NE, MJ/kg 5 10.7 10.7
1Diet fed in pelleted form.
2Provided per kilogram of complete diet: vitamin A, 1,000, 000 IU; vitamin D3, 200,000 IU; vitamin E, 4,000 mg; vitamin B1,
400 mg; vitamin B2, 800 mg; calcium pantothenate, 2,170 mg; niacin, 3,000 mg; vitamin B12, 4 mg; vitamin B6, 200 mg; vitamin K3, 400 mg; folic acid, 200 mg; biotin, 40 mg; choline chloride, 100,000 mg; iron (sulphate), 11,200 mg; iron (carbonate), 4,800 mg; copper (sulphate), 2,000 mg; zinc (oxide), 20,000 mg; manganese (oxide), 8,000 mg; iodine (iodate), 40 mg; cobalt (carbonate), 20 mg; and selenium (selenite), 30 mg.
3As-fed basis. SID = standardized ileal digestible.
4As-fed-basis. Values are calculated for the same dry matter content (87.0%).
5As-fed-basis. Values are calculated based on equation of Noblet et al. (1994) for calculating NE in growing pigs (Eq.11).
The control diet used corn with a very low DON concentration. The DON-contaminated diet was obtained by using a naturally-contaminated corn containing an initial amount of 4.8 mg DON/kg. The analysed DON content in the control and DON-contaminated diets were 0.14 and 3.02 mg DON/kg diet, respectively (Table 2).
Table 2. Analysed mycotoxin composition of the experimental diets (Exp.1).1,2
Mycotoxin concentration, mg/kg Control DON-contaminated
Deoxynivalenol 0.14 3.02 Nivalenol 0.02 0.62 Zearalenone 0.10 0.76 Fumonisin B1 0.45 0.06 Fumonisin B2 0.10 0.01 Aflatoxin3 <0.004 <0.004
1Dietary mycotoxin concentrations were analysed by a commercial laboratory (GIP Labocea, 22440 Ploufragan, FR). 2All values are expressed on an as-fed basis and are calculated based on the same dry matter content of 87%. 3Sum of Aflatoxins B1, B2, G1, and G2.
The design of the study is presented in Figure 1. During the experimental period, the pigs from group CC received the control diet throughout the finishing period (i.e., from 99 to 154 d of age). The pigs of group DC were given the DON–contaminated diet for 7 d starting at 113 d of age (i.e., from 113 until 120 d of age). The pigs of group CD were given the DON–contaminated diet also for 7 d starting at 134 d of age (i.e., from 134 until 141 d of age). The pigs of group DD were challenged with the DON–contaminated diet for 7 d starting at 113 d of age and for another 7 d starting at 134 d of age. After each challenge, a 14-d recovery period was applied. During the pre- and the post-challenge periods, pigs were fed with the control diet.
7
Figure 1. Design of experiment 1. The pigs were given two diets during the 56-day experiment: control and DON-contaminated. Pigs from group CC (n=39) were fed the control diet throughout the experimental period. Pigs from groups DC (n=39), CD (n=38), and DD (n=39) were challenged on during 2, during 4, or during both periods 2 and 4, respectively with the DON-contaminated diet. Pigs were slaughtered 7 d after the end of the experimental period. Before moving to the experimental room, pigs were tagged in the right ear with a serial number and a RFID chip for identification in the sorting station (which also served to weigh the pigs) and in the automatic feeders. The layout of the experimental room is shown in Figure 2. A more detailed description of the automatic and intelligent precision feeders (AIPF) used in the experiment is given by Pomar et al. (2011). In summary, the experimental room had two feeding zones (zones A and B) which could be accessed through an automatic sorter. Each feeding zone was equipped with four automatic feeders. During the non-challenge periods, the sorting station was programmed in a random way so that pigs could access either zone. During challenge periods, feeders in zone A were filled with the DON-contaminated diet and feeders in zone B with the control diet. During these periods, animals of the challenged groups fed with the DON-contaminated diet only had access to zone A (via the sorting station) while animals fed with the control diet only had access to zone B. During the challenge period, the resting areas of the control and DON-challenged groups were also separated to avoid cross-contamination of mycotoxins via the faeces. Feed and water were provided ad libitum. After the end of the trial period (or end of P5), all pigs remained in the experimental room for another 7 d and were fed the control diet before they were slaughtered at 161 d of age.
8
Figure 2. Design of the experimental room.
Measurements and calculations: Five pigs were removed from the data because of poor
performance, leg injury, and/or death with causes unrelated to the experimental treatments. Live body weight was measured automatically when the pigs passed through the automatic sorting station. The average daily body weight was calculated as of all body weight recordings each day. Daily feed intake was calculated based on the recordings of the AIPF on the number of feed servings the pig requested (in theory, one serving equals 25 g) and a calibration factor (CF). Calibration measurements were done weekly on all feeders to correct for the actual amount of feed delivered per serving. From these measurements, the CF was calculated to be the ratio of the actual amount delivered to the theoretical value. To evaluate the adaptive ability of the pigs during challenge periods, the daily marginal change in daily feed intake of the challenged pigs (or the feed intake retrieval rate) was calculated as the feed intake difference between d 0 and d 7 of challenge divided by 7 d of the challenge.
All pigs were fasted 24 h before slaughter and body weight at slaughter was measured by passing the pigs through the automatic sorter before they were transported to the slaughterhouse. Ultrasound backfat thickness (BFT) measurements were taken behind the last rib (i.e., at the boundary of thoracic and lumbar vertebrae), 3 cm off the midline (P2 points) at the beginning of the experiment, at the end of periods P2, P4, and P5. Dressing yield and lean meat percentage were also measured in a commercial slaughterhouse.
For the feeding behaviour traits, data obtained during the first day of the experiment (99 d of age) and from the other days of BFT measurements were removed from the database. Number of feeder visits and meals per day were recorded by the AIPF. A visit was recorded each time a pig was detected by the AIPF. The duration of each visit was calculated based on the time the pig entered and was detected by the feeder and the time the pig left. Two consecutive visits separated by a time interval not longer than a given meal criterion were considered to belong to one meal. When the time at the feeder was set to exceed 5 min, the meal criterion duration no longer affected the number of meals. From this result, the adopted meal criterion was set at 5 minutes and this value was chosen for further calculation of daily components of feeding behaviour traits. These components were the meal frequency
9
(meals/day), daily feed intake (g/d), and average rate of feed intake (total feed intake / total consumption time, g/min).
Experiment 2:
Animals and Treatments: A total of 160 Pietrain × (Large White × Landrace) pigs (average
initial body weight of 69.1 ± 6.9 kg, 115 d of age) were used in the experiment with two replicates, with each pig individually measured for live body weight and fed individually using an electronic feeding station. The two replicates of the experiment were conducted at the INRA experimental facilities at the Unité Expérimentale Porcs de Rennes (UEPR) located in Saint Gilles, France. Each replicate had an equal number of castrated males and females. Within each replicate, pigs were blocked according to sex and origin of litter, and were allotted to one of four experimental treatments in a randomized complete block design. From 91 to 98 d of age, pigs started the transition from a commercial grower diet to the control finisher diet. The experiment started and ended at 99 and 153 d of age, respectively, and all pigs were slaughtered at 161 d of age.
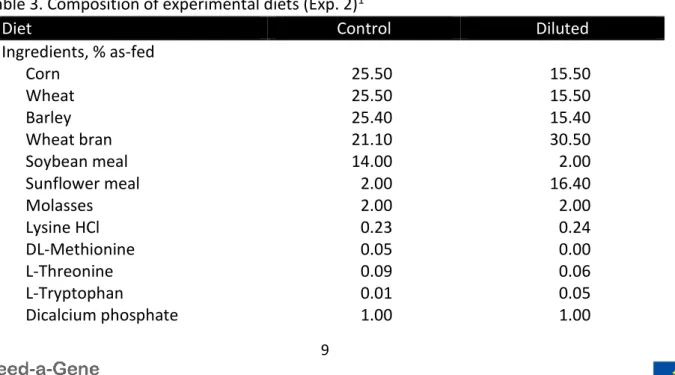
In the control group (CC), pigs were fed a standard diet (7.6 g of digestible lysine/kg and 9.9 MJ NE/kg) during the whole experimental period (55 days). The DC, CD, and DD groups were challenged with a “diluted” fibrous diet for a 7-d period at 130 d, at 153 d, and at 130 and 153 d of age, respectively. Digestible lysine and NE contents were reduced by 20% in the diluted diet compared with the control diet, using wheat bran and sunflower meal as diluters. In both diets, essential amino acids were kept constant relative to lysine (Table 3).
Within each replicate, all pigs were equipped with RFID ear-tag and housed in a same room. The room consisted of one resting area and two feeding areas separated by a weighing-sorting station (Figure 2). This sorter allowed for continuous measurements of individual live body weight. The two feeding areas were equipped with four feeding stations each. These electronic feeder systems distributed automatically the chosen diet to each pig and recorded the visits to the feeder, with their time and the amount of feed consumed.
Table 3. Composition of experimental diets (Exp. 2)1
Diet Control Diluted
Ingredients, % as-fed Corn 25.50 15.50 Wheat 25.50 15.50 Barley 25.40 15.40 Wheat bran 21.10 30.50 Soybean meal 14.00 2.00 Sunflower meal 2.00 16.40 Molasses 2.00 2.00 Lysine HCl 0.23 0.24 DL-Methionine 0.05 0.00 L-Threonine 0.09 0.06 L-Tryptophan 0.01 0.05 Dicalcium phosphate 1.00 1.00
10
Diet Control Diluted
Calcium carbonate 1.00 1.00 Salt 0.50 0.50 Vitamin-Mineral Premix2 0.50 0.50 Composition3 Dry matter, % 87.0 87.0 Crude protein, % 15.2 14.6 Crude fibre, % 3.7 8.8 NDF, % 12.7 26.0 GE, MJ/kg 16.2 16.3 NE, MJ/kg4 9.9 7.9 SID Lys, g/kg 7.6 6.1 SID Lys/NE, g/MJ 0.77 0.77 SID SAA, g/kg 5.1 4.5 SID Thr, g/kg 5.3 4.3 SID Trp, g/kg 1.7 1.3
1Diet fed in pellet form.
2Provided per kilogram of complete diet: vitamin A, 1,000, 000 IU; vitamin D3, 200,000 IU; vitamin E, 4,000 mg; vitamin B1,
400 mg; vitamin B2, 800 mg; calcium pantothenate, 2,170 mg; niacin, 3,000 mg; vitamin B12, 4 mg; vitamin B6, 200 mg; vitamin K3, 400 mg; folic acid, 200 mg; biotin, 40 mg; choline chloride, 100,000 mg; iron (sulphate), 11,200 mg; iron (carbonate), 4,800 mg; copper (sulphate), 2,000 mg; zinc (oxide), 20,000 mg; manganese (oxide), 8,000 mg; iodine (iodate), 40 mg; cobalt (carbonate), 20 mg; and selenium (selenite), 30 mg.
3As-fed basis. Values are calculated for the same dry matter content (87.0%). SID = standardized ileal digestible.
4As-fed-basis. Values are calculated based on equation set by Noblet et al. (1994) for calculating NE in growing pigs (Eq.11).
Experiment 3:
Animals and Treatments: this study was designed to evaluate the effect of an acute heat
challenge on performance and thermoregulatory responses of finishing pigs. The experiment was conducted at the experimental facilities of INRA in Saint-Gilles (INRA-UEPR). The study included a total 45 crossbreed castrated males and was carried out in three successive replicates of 15 pigs each. For each replicate, three blocks of five littermates were selected at 95 d of age and moved to an experimental building with two similar climatic-controlled rooms with nine and six individual pens, respectively. Each individual pen (0.70 × 2.30 m) was equipped with a metal-slatted pen floor, a feed dispenser, and a nipple drinker designed to avoid spillage of feed and water. Pigs remained in the climatic-controlled rooms during 60 days, which consisted of an adaptation period (15 days) and a subsequent experimental period (45 days). This 45 day period was split into three successive sub-periods of 15 days (P1, P2, and P3). In the first room (T room), pigs were kept in thermoneutral conditions (22°C) for the whole experimental period. The second room (H room) was used to challenge the animals. The challenge was repeated during the three consecutive 15 day-periods, each of which consisted of a 3-day pre-challenge period (22°C), a 5-day heat challenge period (32°C), and a 7-day recovery period (22°C). During the first day of the heat stress period, ambient temperature was gradually increased from 22 to 32°C at a constant rate of 2°C/h starting at 09:00h. On the first day of the recovery period, the ambient temperature was decreased from 32 to 22°C at the constant rate of 4°C/h starting at 08:00h. Within each litter, one pig was
11
assigned to one of the five experimental groups. Animals of groups TTT and HHH were housed in the T and H rooms, respectively for the 45 days of the experiment (Table 4). Animals of group HTT were housed in the H room on P1 and in the T room on P2 and P3. Animals of group THT were housed in the T room on P1 and P3 and in the H room on P2. Finally, animals of group TTH were housed in the T room on P1 and P2 and in the H room on P3.
Table 4: Distribution of the different experimental groups among the two climate-controlled rooms during the three consecutives periods of the trial.
Experimental groups
Sub-periods TTT HTT THT TTH HHH
P1 T Room H Room T Room T Room H Room
P2 T Room T Room H Room T Room H Room
P3 T Room T Room T Room H Room H Room
Pigs had free access to water and were fed ad libitum with a cereals and soybean meal-based diet containing 176 g/kg and 9.70 MJ/kg of crude protein and net energy, respectively. Feed was offered twice daily at 0830 and 1630 h. Photoperiod was fixed to 12 h of artificial light (from 0730 to 1930 h) and relative humidity was not controlled.
Measurements: Feed refusals were manually collected each morning at 0800 h, weighed and
sampled for dry matter determination. A sample of feed offered to the animals was also taken weekly for dry matter determination and samples were pooled at the end of each replicate for further chemical analysis. The live body weight was determined at the beginning and the end of periods P1, P2, and P3 on d3, d0, and d5 at 0830 h. The weighing station was located in the corridor between the two experimental rooms and the transfer from one room to another was therefore operated immediately after each weighing at the end of periods P1 and P2. During the adaptation period, pigs were accustomed to the weighing station and the transfer between each room to avoid excessive stress.
4. Databases
The parameters of which values are reported in the database are shown in Table 5 (Experiment 1), Table 6 (Experiment 2), and Tables 7, 8, and 9 (Experiment 3).
12
Table 5: Parameters in the database related to Exp. 1 (FaG_INRA_D2-7_exp1.xlsx; 17 columns, 8520 lines).
Parameter Description Values/units
Obs. No. of observations 1-8519
Rep Replicate 1 or 2
Pig_N Pig identification
Sex Gender type 1 = female, 3 = castrated male
Group Experimental group 1 = CC, 2 = DC, 3 = CD, 4 = DD
Sire Sire identification
Sow Sow identification
Date Date dd/mm/yyyy
Age Age of the pig days
BW live Body Weight kg
ADFI Average Daily Feed Intake g/d
NVD Number of Visits per Day nb/d
NMD Number of Meals per Day nb/df
TDI Total Duration of Ingestion min/d
RFI Rate of Feed Intake g/min
TMI Time of Ingestion per Meal min/meal
13
Table 6: Parameters in the database related to Exp. 2 (FaG_INRA_D2-7_exp2.xlsx; 17 columns, 8765 lines).
Parameter Description Values/units
Obs. No. of observations 1-8764
Rep Replicate 1 or 2
Pig_N Pig identification
Sex Gender type 1 = female, 3 = castrated male
Group Experimental group 1 = CC, 2 = DC, 3 = CD, 4 = DD
Sire Sire identification
Sow Sow identification
Date Date dd/mm/yyyy
Age Age of the pig days
BW live Body Weight kg
ADFI Average Daily Feed Intake g/d
NVD Number of Visits per Day nb/d
NMD Number of Meals per Day nb/df
TDI Total Duration of Ingestion min/d
RFI Rate of Feed Intake g/min
TMI Time of Ingestion per Meal min/meal
14
Table 7: Parameters in the database including the information on the pigs and their experimental treatments of the Exp. 3 (FaG_INRA_D2-7_exp3_base1.xlsx; 8 columns, 136 lines).
Parameter Description Values/units
Rep Replicate 1, 2 or 3
Period Sub period P1, P2 or P3
Pig_N Pig number
Room Room number 1 or 2
Pen Pen number 1 to 15
Group Experimental group TTT, CTT, TCT, TTC, CCC
Date_start Starting date dd/mm/yyyy
Date_end Ending date dd/mm/yyyy
Table 8: Parameters in the database including individual feed intake measurements from the Exp. 3 (FaG_INRA_D2-7_exp3_base2.xlsx; 5 columns, 2746 lines)
Parameters Description Values/units
Rep Replicate 1, 2 or 3
Pig_N Pig number
Group Experimental group TTT, CTT, TCT, TTC, CCC
Date Date dd/mm/yyyy
ADFI Average Daily Feed Intake g DM/d
Table 9: Parameters in the database including BW measurements from the Exp. 3 (FaG_INRA_D2-7_exp3_base3.xlsx; 5 columns, 406 lines)
Parameters Description Values/units
Rep Replicate 1, 2 or 3
Pig_N Pig number
Group Experimental group TTT, CTT, TCT, TTC, CCC
Date Date dd/mm/yyyy
15
5. Access to the database
The database is available (free access) for stakeholders (e.g., academia, animal production sector, and feed industry) active in the domain of feed efficiency in swine production.
The database is available as an Excel file.
The database has been published at the Zenodo platform (DOI: 10.5281/zenodo10.5281). Further information on the database is available upon request from David Renaudeau (david.renaudeau@inra.fr ).
6. Conclusions
The present database contains individual records on feed intake traits and development of body weight of a total of 356 pigs exposed to single or repeated challenges similar to those encountered in commercial conditions, affecting the performance of pigs.
This information is available in Excel files deposed in an open access repository to improve and maximize access to this very original research data to a large community of researchers with interest in performance and feed and nutrient efficiency of pigs.
The data could be very useful for further studying or modelling time-related aspects of robustness of animals to various environmental perturbations.
7. Publications generated from these databases
Serviento, A. M., Brossard, L., Renaudeau, D. (2018). An acute challenge with a
deoxynivalenol-contaminated diet has short- and long-term effects on performance and feeding behavior in finishing pigs. Journal of Animal Science, 96 (12), 5209-5221. , DOI : 10.1093/jas/sky378
Renaudeau, D., Brossard, L., Duteil, B., Labussière, E. (2017). Impact of a short-term dietary
challenge on growth performance and feeding behavior in finishing pig. In: Book of Abstract of the 68th Annual Meeting of the European Federation of Animal (p. 244). Annual Meeting of the European Association for Animal Production. Presented at 68. Annual Meeting of the European Federation of Animal Science (EAAP), Tallinn, EST (2017-08-28 - 2017-09-01). Wageningen, NLD: Wageningen Academic Publishers.
Renaudeau, D. Impact of single or repeated short-term thermal challenges on