Publisher’s version / Version de l'éditeur:
Americal Mineralogist, 91, 2006
READ THESE TERMS AND CONDITIONS CAREFULLY BEFORE USING THIS WEBSITE.
https://nrc-publications.canada.ca/eng/copyright
Vous avez des questions? Nous pouvons vous aider. Pour communiquer directement avec un auteur, consultez la première page de la revue dans laquelle son article a été publié afin de trouver ses coordonnées. Si vous n’arrivez pas à les repérer, communiquez avec nous à PublicationsArchive-ArchivesPublications@nrc-cnrc.gc.ca.
Questions? Contact the NRC Publications Archive team at
PublicationsArchive-ArchivesPublications@nrc-cnrc.gc.ca. If you wish to email the authors directly, please see the first page of the publication for their contact information.
NRC Publications Archive
Archives des publications du CNRC
This publication could be one of several versions: author’s original, accepted manuscript or the publisher’s version. / La version de cette publication peut être l’une des suivantes : la version prépublication de l’auteur, la version acceptée du manuscrit ou la version de l’éditeur.
For the publisher’s version, please access the DOI link below./ Pour consulter la version de l’éditeur, utilisez le lien DOI ci-dessous.
https://doi.org/10.2138/am.2006.1815
Access and use of this website and the material on it are subject to the Terms and Conditions set forth at
Upper limit of the tetrahedral rotation angle and factors affecting
octahedral flattening in synthetic and natural 1M polytype C2/m space
group micas
Mercier, Patrick; Rancourt, D. G.; Redhammer, G.; Lalonde, A. E.; Robert,
J-L.; Berman, R. G.; Kodama, H.
https://publications-cnrc.canada.ca/fra/droits
L’accès à ce site Web et l’utilisation de son contenu sont assujettis aux conditions présentées dans le site LISEZ CES CONDITIONS ATTENTIVEMENT AVANT D’UTILISER CE SITE WEB.
NRC Publications Record / Notice d'Archives des publications de CNRC:
https://nrc-publications.canada.ca/eng/view/object/?id=fdc2dba9-5226-40ae-a34c-e8bb0941f1b7
https://publications-cnrc.canada.ca/fra/voir/objet/?id=fdc2dba9-5226-40ae-a34c-e8bb0941f1b7
0003-004X/06/0506–831$05.00/DOI: 10.2138/am.2006.1815 831
I
NTRODUCTIONTetrahedral rotation and octahedral ß attening are the two main structural distortion mechanisms which ensure the match-ing of octahedral and tetrahedral sheets in the mica structure (e.g., Bailey 1984; Brigatti and Guggenheim 2002; Ferraris and Ivaldi 2002) and in layer silicates in general (e.g., Bailey
Upper limit of the tetrahedral rotation angle and factors affecting octahedral ß attening in
synthetic and natural 1M polytype C2/m space group micas
P
ATRICKH.J. M
ERCIER,
1D
ENISG. R
ANCOURT,
2,* G
UENTHERJ. R
EDHAMMER,
3A
NDRÉE. L
ALONDE,
4J
EAN-L
OUISR
OBERT,
5R
OBG. B
ERMAN,
6ANDH
IDEOMIK
ODAMA71Institute for Chemical Process and Environmental Technology, National Research Council Canada, 1200 Montreal Road, Building M-12,
Ot-tawa, Ontario K1A 0R6, Canada
2Department of Physics, University of Ottawa, Ottawa, Ontario K1N 6N5, Canada 3Institute of Mineralogy, University of Salzburg, A-5020 Salzburg, Austria 4Department of Earth Sciences, University of Ottawa, Ottawa, Ontario K1N 6N5, Canada
5Centre de Recherches sur la Synthèse et la Chimie des Minéraux (CRSCM), CNRS, 1A, Rue de la Férollerie, F45071 Orléans, Cédex 2, France 6Geological Survey of Canada, 601 Booth Street, Ottawa, Ontario K1A 0E8, Canada
7ECORC Agriculture and Agri-Food Canada, 960 Carling Avenue, Ottawa, Ontario K1A 0C6, Canada
A
BSTRACTWe have used recently developed quantitative crystal chemical models and a simple structural free-energy model to examine and interpret: (1) previously reported powder X-ray diffraction data for several trioctahedral mica solid solution series (64 synthetic powder samples between the Mg, Co, Ni, and Fe end-members, with different degrees of oxidation, vacancy contents, and Al/Si ratios; indexed as 1M polytype, space group C2/m; supplemented here by 57Fe Mössbauer spectroscopy to obtain accurate iron-site populations of IVFe3+, VIFe3+, and VIFe2+), and (2) 175 previously published single-crystal reÞ nements comprising 138 natural and 37 synthetic 1M mica samples reÞ ned in space group C2/m. The crystal chemical models were validated by comparisons between predicted and measured relations between structural parameters, and needed model parameters and their uncertain-ties were extracted, using the single-crystal reÞ nements. Two main results arise. First, an observed limit value of the b lattice parameter in certain synthetic solid solution series is shown to correspond to an upper limit value for the tetrahedral rotation angle α of αmax = 9.5° for AlSi3 tetrahedral sheets in rich micas. This upper limit is also clearly seen in the single-crystal reÞ nement data for those K-rich single-crystals that have near-AlSi3 tetrahedral compositions. We argue that the (tetrahedral sheet composition dependent) upper limit of tetrahedral rotation is an intrinsic property of the tetrahedral sheet (presumably corresponding to an intra-tetrahedral-sheet bond-bending limit) rather than arising either from interactions with the interlayer cations or from an octahedral sheet lateral-contraction limit. Second, we Þ nd that, except in the extreme cases where one approaches the lower (α = 0°) or upper (α = αmax) tetrahedral rotation limits, the magnitude of the octahedral ß attening angle ψ is predominantly determined by octahedral cation stereo-chemical bonding requirements (and other intra-octahedral-sheet properties such as intra-sheet bond bending and intra-sheet electrostatic forces) rather than arising from tetrahedral-octahedral inter-sheet interactions (as generally argued or assumed). In addition, we corroborate a previously reported difference in the crystal chemical behaviors of trivalent octahedral cation (Fe3+, Al3+) and vacancy-bearing trioctahedral micas relative to samples that contain only diva-lent octahedral cations (e.g., Fe-Mg, Fe-Ni, Mg-Ni, and Co-Mg synthetic series); their b vs. average octahedral metal-oxygen bond-length behaviors are dramatically different, a result that is consistent with our proposed dominant stereo-chemical control of ψ.
Keywords: Crystal chemistry, layer silicate, mica, tetrahedral rotation, inter-sheet matching, octahedral ß attening
1988). The degrees of these distortions can be expressed by the tetrahedral rotation angle α and the mean ß attening angle ψ of the octahedra (e.g., Donnay et al. 1964a; Hazen and Burnham 1973; Takeda and Morosin 1975). Tetrahedral rotation reduces the lateral extent of tetrahedral sheets, whereas octahedral sheets are laterally expanded by octahedral ß attening.
Physical limits to possible mica structures owing to the rela-tive sizes of octahedral and tetrahedral sheets appear to exist. In annite, for example, the ideal end-member stoichiometry * E-mail: dgr@physics.uottawa.ca
K(Fe2+
3)(AlSi3)O10(OH)2 is never attained because of mismatch constraints between the larger VI(Fe2+
3) octahedral and smaller IV(AlSi
3) tetrahedral sheets, which require some Fe3+ to be present even under highly reducing conditions (Hazen and Wones 1972; Redhammer et al. 1993; Rancourt et al. 1994a, 2001; Mercier et al. 1996, 1999). The latter situation is believed to occur from the geometrical limit of α = 0°, which corresponds to the point where a fully expanded (i.e., non-rotated) tetrahedral sheet can-not Þ t laterally onto an octahedral sheet. At the other extreme, evidence for a possible upper limit on α has been discussed by a few authors (e.g., Hazen and Wones 1978; Redhammer and Roth 2002). In particular, Hewitt and Wones (1975) suggested that an upper limit on α was the reason that Al-substitution is limited in synthetic biotite solid solutions. The idea of geometric structural limits for α (i.e., 0° ≤ α ≤ αmax) was used by Hazen (1977) and Hazen and Wones (1978) to study the stability relationships of some end-member trioctahedral micas on a pressure-tempera-ture diagram. On the other hand, Guggenheim et al. (1987) and Russell and Guggenheim (1999) oppose the view that geometric limits in α play a role in the stability of micas.
The origin of octahedral ß attening has been analyzed in many structural and crystal chemical studies (e.g., Hazen and Wones 1972; Toraya 1981; Lin and Guggenheim 1983; Bailey 1984a; Weiss et al. 1985, 1992; Alietti et al. 1995, 1997; Brigatti and Davoli 1990; Brigatti and Poppi 1993; Brigatti et al. 1991, 1996a, 1996b, 2000a, 2000b, 2001, 2003a; Cruciani and Zanazzi 1994; Brigatti and Guggenheim 2002; Redhammer and Roth 2002), but so far relatively few researchers have exploited predictions from geometric crystal chemical models to assess octahedral ß attening (e.g., Donnay et al. 1964a; Hazen and Wones 1972; Hazen and Burnham 1973; Takeda and Morosin 1975).
In the present paper, we follow an approach based on the geometric crystal chemical models of Mercier et al. (2005a), applied to a large suite of synthetic powder samples previously studied by powder X-ray diffraction (Mercier et al. 2005b) and using previously published single-crystal reÞ nement data. We Þ nd that such models provide a powerful framework for analyz-ing lattice and structural reÞ nement parameters, by allowanalyz-ing clear distinctions to be made between local effects owing to chemical disorder vs. long-range geometric effects that either appear as average network adjustments (e.g., average polyhedral ß attening and rotation) or as true geometric limits (i.e., that would require excessive bond stretching or bending). This approach was also applied in a previous paper (Mercier et al. 2005b) to study the nature of octahedral chemical ordering in the same synthetic powder samples and previously published single-crystal reÞ ne-ments studied here.
Throughout the present paper we use the terms geometric
homo-octahedral, geometric meso-octahedral, and geometric
hetero-octahedral to refer to each of the three octahedral sheet types I, II, and III described by Weiss et al. (1992), which are based on the values of the average cation-anion bond lengths <M1-O>, <M2-O>, and <M3-O> for the three possible octa-hedral sites: type-I, <M1-O> = <M2-O> = <M3-O>; type-II, any two are equal and the third is different; and type-III, the three average bond lengths are different. When used without the qualifying adjective geometric, the terms homo-octahedral, meso-octahedral, and hetero-octahedral refer to the classiÞ cation
based on the symmetry of occupancy of the octahedral sheets [layer symmetries H(3–)1m, P(3–)1m, and P(3)12, respectively] as judged by the reÞ nements of site-speciÞ c mean electron counts (Ďurovič 1994; Nespolo and Ďurovič 2002).
M
ATERIALSANDMETHODSSynthetic powder samples
The 64 synthetic powder samples studied here were described and characterized in detail by Mercier et al. (2005b). Table 1 summarizes the structural formulas for the synthetic powder samples.
Iron site populations from Mössbauer spectroscopy Transmission 57Fe Mössbauer spectra were collected using a <30 mCi 57Co
rhodium-matrix single-line thin source with a constant-acceleration drive over a velocity range of ±4 mm/s. Data were acquired over 1024 channels and folded to give a ß at background and a zero-velocity position corresponding to the center shift of metallic α-Fe at room temperature.
Random-orientation powder absorbers were prepared as described previously (Rancourt et al. 1994a, 1994b) using the ideal absorber thickness to obtain the greatest signal-to-noise ratio in the given collection time (Rancourt et al. 1993). Typically, ∼25 mg of sample was spread evenly and sandwiched between two waxed paper sheets held with clear tape in aluminum holders with 5/16 inch diameter windows. Because of the small particle size (0.1–20 µm) of synthetic powder samples, this procedure ensured that no texture was present in the absorbers (Rancourt et al. 1994a, 1994b).
Because accurate Fe-site populations were required, all folded raw spectra were corrected for thickness effects as described previously (Rancourt 1989, 1998; Rancourt et al. 1994a, 1994b, 2001). To treat thickness effects properly, each raw spectrum was Þ rst Þ tted with an arbitrary number of Voigt lines to obtain a statisti-cally ideal Þ t. Intrinsic absorber cross-sections were then extracted from the Voigt Þ ts and used to generate thin-limit spectra (TLS) that are completely corrected for absorber thickness effects, both spectral shape and relative and absolute intensities. Not correcting for thickness effects can cause systematic errors of several percent or more in site populations (e.g., Rancourt et al. 2001).
The only required user-supplied parameter for this exact thickness-effects cor-rection is the average recoilless fraction of the absorber material (Rancourt et al. 1993). A recoilless fraction of fa = 0.5 was obtained from synthetic annite (Royer
1991; Rancourt et al. 1994a) and is the value used for all series, except Fe-Ni GR where fa = 0.7 was used. It is important to note that the thickness-effects correction
procedure is not sensitive to the precise value of fa, i.e., fa = 0.5 or 0.7 gave the
same results within experimental error.
In obtaining site populations from Mössbauer spectroscopy, the possibility exists that the site-speciÞ c or cation-species-speciÞ c recoilless fractions may not be equal for a given sample (Rancourt 1989). In the present work, equal recoilless fractions were assumed for all Fe-sites in a given sample. A complete explanation of the reasons validating this assumption is given in Lalonde et al. (1998) and Rancourt et al. (2001).
The thin-limit spectra were Þ tted using the Voigt-based quadrupole splitting distribution (QSD) method of Rancourt and Ping (1991) with a 1-1-3 model: one tetrahedral Fe3+ site having one Gaussian component in its QSD, an octahedral Fe3+
TABLE 1. Stoichiometric formulas for the dif erent compositional
series of synthetic powder samples studied*
Series name Stoichiometric formula Co-Mg JLR K(Co3-wMgw)(AlSi3)O10(OH)2
Mg-Ni JLR K(Mg3-wNiw)(AlSi3)O10(O[H or D])2
Fe-Mg JLR K(Fe2+
3-w-x-yMgwFe3+xAly)(Al1-ySi3 Fe3+y)O10+x+y(OH)2-x-y
Fe-Mg RGBn " Fe-Mg RGBr K(Fe2+
3-w-xMgwFe3+xAlv)(Al1+vSi3-v)O10+x(OH)2-x
Fe-Ni GR K(Fe2+
3-w-x-yNiwFe3+xAly)(Al1-ySi3 Fe3+y)O10+x+y(OH)2-x-y
Ann-oxy-ferrioxy K(Fe2+
3-x-y-3zFe3+x+2z zAly)(Al1-ySi3 Fe3+y)O10+x+y(OH)2-x-y
Ann K(Fe2+
3-x-yFe3+xAly)(Al1-ySi3 Fe3+y)O10+x+y(OH)2-x-y
* The values of v, w, x, y, and z were obtained from the nominal compositions of the samples (Mercier et al. 2005b) in combination with the iron site populations (Table 2) in a manner that is explained in the text; the symbol designates an octahedral vacancy.
site, also having one Gaussian component, and an octahedral Fe2+ site with three
Gaussian components in its QSD. Fitting parameters for the room-temperature thin-limit spectra are given in Appendix A.1 Table 2 lists the [IV]Fe3+, [VI]Fe3+, and [VI]Fe2+ site populations obtained for all iron-bearing samples.
Rancourt and Ping (1991) list all Mössbauer parameter deÞ nitions and detailed descriptions of the relevant notation. All steps of the analysis procedure were per-formed using the Recoil software developed in D.G.R.’s laboratory by K. Lagarec and commercialized by ISA Inc. (www.isapps.ca/recoil).
Treatment of structural reÞ nement and chemical data of the single-crystal samples
We considered structural reÞ nement and chemical data from a compilation of 175 single-crystal reÞ nements of the 1M polytype and C2/m space group recently presented by Mercier et al. (2005b). The structural data used here were re-calculated from unit-cell parameters and atomic coordinates reported by the authors of the original articles. The following site nomenclature is used (site multiplicities are given in parentheses besides each site label): M1(2) and M2(4) indicate octahedral cation sites in trans- and cis-orientation, respectively; T(8) denotes the tetrahedral cation site; A(2) designates the interlayer cation site; O1(4) and O2(8) represent basal oxygen sites; O3(8) is the apical oxygen site; and O4(4) refers to the site of the (OH), F, Cl, or O octahedral anions.
For the purpose of comparison with the 64 synthetic powder samples, the single-crystal 1M samples (Mercier et al. 2005b) were categorized into groups depending on the chemical compositions of the samples. There are four groups of single-crystal samples with compositions similar to our synthetic powder samples: (1) 68 biotite samples close to the annite-phlogopite join with Alapfu ≤
1.3, labeled [Ann-Phl] (where Xapfu = number of atoms X per formula unit); (2)
42 biotite samples more toward the eastonite-syderophyllite join with Alapfu > 1.3,
labeled aluminous-[Ann-Phl]; (3) 13 tetra-ferri biotite samples with [IV](Fe3+) apfu >
0.4, labeled tetraferri-[Ann-Phl]; and (4) 2 oxy-biotite samples, labeled oxy-Bt. The samples belonging to these four groups are referred to collectively as single-crystal biotite-1M samples.
M
ODELVALIDATIONANDPARAMETEREVALUATIONValidation of geometric crystal chemical models for octa-hedral and tetraocta-hedral sheets
A sequence of progressively more realistic geometric crystal chemical models for T-O-T layers in micas was described by Mercier et al. (2005a). These models are based on properties of the chemical bonds (bond lengths and bond angles) and can be used to analyze both structural and lattice-parameter reÞ nement data by comparing measured structural properties to predictions based on speciÞ c sets of crystal chemical parameters. As these geometric crystal chemical models have not been extensively validated, nor have their limits been systematically examined using a large set of structural reÞ nement results, it was Þ rst necessary to do so before applying them to our problem.
An analysis of the structural reÞ nement data for the 175 single crystals (Appendix B) revealed that lattice parameters a and b can be reproduced to within ±0.005 Å from crystal chemical parameters (Table 3), giving the average polyhedral properties of octahedral and tetrahedral sites using the following relation-ships (Mercier et al. 2005a):
a = 3 · do · sinψ (1a)
b = 3 · 31/2 · d
o · sinψ (1b)
a = 2 dM1 sin(ψM1) + 2 dM2 sin(ψM2) sin[(π/6) – δM2] (2a)
b = 31/2 d
M1 sin(ψM1) + 2 · 31/2 · dM2 sin(ψM2) cos(δM2) (2b)
a = 4 · dtbas · sin(τbas/2) · cos α (3a)
b = 4 ·31/2 · d
tbas · sin(τbas/2) · cos α (3b)
Equations 1, 2, and 3 refer respectively to: (1) a geometric homo-octahedral sheet model where each octahedral site has the same bond length do and ß attening angle ψ; (2) a geometric meso-octahedral sheet model where dM1 and dM2 are the site-spe-ciÞ c M1 and M2 cation-anion bond lengths, ψM1 and ψM2 are the ß attening angles of M1 and M2 octahedra, and δM2 is the counter-rotation angle of the M2 octahedra (the M1 octahedra have zero counter-rotation); and (3) a ß at tetrahedral sheet model (i.e., with
TABLE 2. Iron site populations from Mössbauer spectroscopy (see
Appendix A)*
Sample [IV](Fe3+)/Fe
tot [VI](Fe3+)/Fetot [VI](Fe2+)/Fetot Feoxide/Fetot
(%) (%) (%) (%) Fe-Mg JLR
Fe0.6Mg2.4JLR not used, Mag not used, Mag not used, Mag not used, Mag
Fe1.2Mg1.8JLR 3.69(40) 11.38(46) 84.9(56) b.d.l.
Fe1.8Mg1.2JLR 2.52(32) 14.21(37) 83.26(44) b.d.l.
Fe2.4Mg0.6JLR 4.40(29) 13.11(32) 82.49(39) b.d.l.
Fe3.0Mg0.0JLR not used, Mag not used, Mag not used, Mag not used, Mag
Fe-Mg RGBn Fe0.75Mg2.25RGB 3.2(9) 3.5(9) 93.3(12) b.d.l. Fe1.5Mg1.5RGB 5.08(41) 2.23(49) 92.7(6) b.d.l. Fe2.25Mg0.75RGB 7.82(17) 2.47(23) 89.71(27) b.d.l. Fe3.0Mg0.0RGB 6.57(17) 3.08(20) 90.35(26) b.d.l. Fe-Mg RGBr Fe25Mg75Bi33r b.d.l. 2.42(22) 97.58(22) b.d.l. Fe50Mg50Bi38r b.d.l. 4.85(24) 95.15(24) b.d.l. Fe75Mg25Bi32r b.d.l. 1.86(16) 98.14(16) b.d.l. Fe100Bi35r b.d.l. 5.26(35) 94.74(35) b.d.l. Fe25Mg75Bi31r b.d.l. 10.88(23) 89.12(23) b.d.l. Fe75Mg25Bi30r b.d.l. 3.51(11) 96.49(11) b.d.l. Fe-Ni GR Fe0.2Ni2.8GR 23.1(6) 4.1(5) 72.8(5) b.d.l. Fe0.6Ni2.4GR 11.0(5) 7.6(5) 81.4(7) b.d.l. Fe1.0Ni2.0GR 7.8(4) 9.3(4) 82.9(5) b.d.l. Fe1.4Ni1.6GR 5.1(5) 12.1(4) 82.8(6) b.d.l. Fe1.8Ni1.2GR 5.6(5) 10.0(6) 84.4(4) b.d.l. Fe2.2Ni0.8GR 5.0(5) 10.6(6) 84.4(7) b.d.l. Fe2.6Ni0.4GR 4.2(4) 12.1(4) 83.7(6) b.d.l. Ann-oxy-ferrioxy† IKO-Ann 4.0(2) 7.0(2) 89.0(2) b.d.l. EM250 4.22(56) 9.28(63) 86.50(78) b.d.l. EM300 5.15(44) 20.78(44) 74.07(53) b.d.l. EM350 4.85(50) 47.35(45) 47.80(45) b.d.l. EK350 4.14(44) 52.08(38) 43.78(34) b.d.l. EK370 not modeled 66.80(15) 30.18(11) 3.02(16) EM400 not modeled 79.80(31) 13.03(20) 7.17(29) EM450 not modeled 88.86(38) b.d.l. 11.14(38) EM500 not modeled 89.40(32) b.d.l. 10.60(32) EM550 not modeled 88.35(35) b.d.l. 11.65(35) EM600 not modeled 88.09(34) b.d.l. 11.91(34) Annite
HK-596 4.59(57) 5.71(80) 89.70(93) b.d.l. HK-650 5.56(74) 4.7(1.1) 89.8(1.3) b.d.l. HK-700 6.99(44) 2.55(59) 90.46(69) b.d.l. * Number in parentheses are one-sigma uncertainties estimated with the bootstrap method (see Press et al. 1992 and references therein) implemented in Recoil; samples Fe0.6Mg1.8JLR and Fe3.0Mg0.0JLR were ignored due to a signii cant
magnetite (Mag) impurity peak seen in the raw Mössbauer spectra; b.d.l. = below detection limit of ~0.2% Fetot.
† Data taken from Rancourt et al. (2001).
1Deposit item AM-06-020, Appendix Table A. Deposit items are available two ways: For a paper copy contact the Business OfÞ ce of the Mineralogical Society of America (see inside front cover of recent issue) for price information. For an electronic copy visit the MSA web site at http://www.minsocam.org, go to the American Mineralogist Contents, Þ nd the table of contents for the speciÞ c volume/issue wanted, and then click on the deposit link there.
no tetrahedral corrugation or tilting) where each tetrahedron has an equal basal bond length dtbas for the three T-Obas bonds [i.e., (T-O1) = (T-O2) = (T-O2') = dtbas], a given basal ß attening angle τbas for the three Obas-T-Obas angles (i.e., τO1-T-O2 = τO1-T-O2 = τO2-T-O2' = τbas), and a speciÞ ed tetrahedral rotation angle α as deÞ ned by Donnay et al. (1964a). Table 4 gives a list of all crystal chemi-cal parameters and all equations used to determine the average polyhedral properties of the octahedral and tetrahedral sites.
Based on the extent to which the lateral dimensions of both octahedral and tetrahedral sheets can be reproduced from average polyhedral properties, Equations 1–3 are used below to compare crystal chemical parameters calculated from the lattice param-eters of the 64 synthetic powder samples to measured properties obtained from the 175 single-crystal structure reÞ nements.
Obtaining characteristic cation- and coordination-speciÞ c bond lengths for mica structures
A key difÞ culty in testing the models with synthetic powders was to establish characteristic cation- and coordination-speciÞ c bond lengths for these structures. This was done (Appendix C) by comparing the bond-length data obtained from the 175 single-crystal reÞ nements to the bond distances obtained using three readily available ways of predicting the bond length of a given cation in a speciÞ c coordination: (1) the tables of ionic radii given by Shannon (1976); (2) the bond-valence method of Brown and Altermatt (1985); and (3) the cation-speciÞ c octahedral and tetra-hedral bond lengths speciÞ c to layer silicates given by Weiss et al. (1992). The resulting cation-speciÞ c octahedral and tetrahedral bond lengths used in this work are given in Table 4.
For a given synthetic powder sample it, was then possible to obtain a calculated mean octahedral bond length, <M-O>calc, and a mean basal tetrahedral bond length, <T-Obas>calc, using the following relationships:
<M-O>calc = Σi xi · do(Mi) (4a) <T-Obas>calc = Σi xi · dtbas(Ti) (4b) where (1) xi represents the atomic fraction of cation i contained
in the octahedral or tetrahedral sites, and (2) do(Mi) and dtbas(Ti) refer to the characteristic cation-speciÞ c octahedral and tetrahe-dral basal bond lengths speciÞ ed in Table 4. In turn, values of <M-O>calc and <T-Obas>calc were used to obtain various crystal chemical parameters (described below) from the lattice param-eters of the 64 synthetic powders.
F
ACTORSAFFECTINGOCTAHEDRALFLATTENINGThe vast majority (153 out of 175) of the mica single crystals with 1M polytype and C2/m space group considered here have <M1-O> > <M2-O> and ψM1 > ψM2 (Mercier et al. 2005b). This has been described as the “normal” ordering pattern (e.g., Toraya 1981; Bailey 1984a; Guggenheim 1984), where enlargement of M1 with respect to M2 is believed to be caused by partitioning of high-charge, smaller cations into M2, whereas low-charge, larger cations and vacancies tend to occupy M1. This mode of ordering is consistent with the propositions of Hazen and Wones (1972), who suggested that octahedral ß attening is primarily a function of the mean cation radius <R> inside an octahedron, where <R> is obtained using the cation-speciÞ c radii of Shannon (1976). Lin and Guggenheim (1983) argued that the ß attening of each octahedral cationic site in an octahedral sheet is mainly dependent on the Þ eld strengths of the neighboring atoms, where the Þ eld strength of an individual atom is equal to its valence divided by its mean cation radius. Alternatively, Weiss et al. (1985) asserted that the ß attening ψ and counter-rotation δ angles of any particular octahedron in a sheet are related to interactions in the whole sheet rather than in the particular octahedron alone. Tetrahedral-to-octahedral sheet mismatch is also believed to play a role in determining the magnitude of the ß attening angles in a given mica (e.g., Toraya 1981; Lin and Guggenheim 1983).
In a previous paper (Mercier et al. 2005b) it was shown that the 64 synthetic powder samples are geometric homo-octahe-dral structures with random octahehomo-octahe-dral occupations, where all octahedral sites have the same ß attening angle. By contrast, the 175 single-crystal 1M mica samples have various degrees of chemical order that create geometric meso-octahedral structures with differently sized M1 and M2 octahedral sites. For the single
TABLE 3. Summary of crystal chemical parameters and equations
used to determine the average polyhedral properties of octahedral and tetrahedral sites*
Parameter Equations used <M1-O> = 1/3·[2·(M1-O3) + (M1-O4)] <M2-O> = 1/3·[(M2-O3) + (M2-O3’) + (M2-O4)] <M-O> = 1/3·[<M1-O> + 2·<M2-O>] ψM1 = arccos[ho/(2·<M1-O>)]
where: ho = 2 c sin(β) [1/2 – (O4z + 2·O3z)/3]
ψM2 = arccos[ho/(2·<M2-O>)]
<ψ> = 1/3·[ψM1 + 2·ψM2]
δM2 = |(θ2 + θ3) – θ1|/3
<T-Obas> = 1/3·[(T-O1) + (T-O2) + (T-O2’)]
<τbas> = 1/3·[τO1-T-O2 + τO1-T-O2‘ + τO2-T-O2‘]
α = 1/6· Σi=16 |120o – φi|
* The symbols (M1-O3), (M1-O4), (M2-O3), (M2-O3'), and (M2-O4) refer to the individual bond lengths occuring in M1 and M2 sites; ho is the octahedral sheet
height; c and β are the monoclinic lattice parameters deÞ ning the direction along which the T-O-T layers stack; O3z and O4z are the z fractional atomic coordinates of O3 and O4 sites tabulated in Mercier et (2005b); θ1, θ2, and θ3 are deÞ ned in
Figure 4 of Mercier et al. (2005b); (T-O1), (T-O2), and (T-O2') are the three T-Obas
bond lengths in a given tetrahedron; τO1-T-O2, τO1-T-O2', and τO2-T-O2' are the three Obas
-T-Obas bond angles in a given tetrahedron; φi is one of the six distinct crytallographic
angles between basal edges of neighboring tetrahedra articulated in the tetrahedral sheets of a 1M polytype C2/m space group structure.
TABLE 4. Cation- and coordination-specii c bond lengths (see
Ap-pendix C)
Cation-specii c octahedral bond lengths (Å)
M cation Weiss et al. Brown and Altermatt Shannon This work (1992) (1985) (1976) Ni2+ – 2.060 2.057 2.0617(25) Mg2+ 2.083 2.099 2.087 2.0759(22) Co2+ – 2.098 2.112 2.0876(25) Fe2+ 2.110 2.140 2.147 2.126(11) Fe3+ 2.053 2.015 2.012 2.0263(71) Al3+ 1.919 1.907 1.902 1.945(22) Ti4+ 2.073 1.965 1.972 – Li1+ 2.107 2.129 2.127 – Cr3+ 2.040 1.980 1.982 – Mn3+ – 2.016 2.012 – Mn2+ 2.140 2.196 2.197 – Vacancy 2.210 – – 2.210 Cation-specii c basal tetrahedral bond lengths (Å)
This work Shannon (1976) This work T-sheet dtbas or T-Obas T cation ([4]T-[3]O)-([4]T-[4]O) dtbas(Ti) [IV](Al 1.1Si2.9) 1.659 Si4+ 1.62–1.64 1.610 [IV](FeSi 3) 1.682 Al3+ 1.75–1.77 1.787 [IV](Al 2.8Si1.2) 1.734 Fe3+ 1.85–1.87 1.897
crystals, Mercier et al. (2005b) showed that the counter-rotation angle of the M2 site, δM2, exactly (within expected experimental error) follows model geometric meso-octahedral sheet predic-tions given by the following relapredic-tionship:
[dM12 – dM22] / a2 = (1/3) · {sin2[(π/6) + δM2] – 1/4}/ {sin2[(2π/3) – δM2]} (5) The counter-rotation angle δM2 is therefore well suited to quantify the degree of octahedral chemical order in a mica with 1M polytype and C2/m space group (i.e., the difference between
dM1 and dM2), and will be used below as such in assessing octa-hedral ß attening from the perspective of the geometric crystal chemical models.
b as a function of the average octahedral bond length
Figure 1 shows b vs. the mean octahedral bond length <M-O>calc (Eq. 4a) determined for various solid solution series of
2.05 2.06 2.07 2.08 2.09 2.10 2.11 2.12 9.16 9.20 9.24 9.28 9.32 9.36 9.40 58.5o 59.5o b ( Å ) <M-O> (Å) [Ann-Phl] ( n = 68 ) aluminous-[Ann-Phl] ( n = 42 ) tetra-ferri-[Ann-Phl] ( n = 13 ) oxy-Bt ( n = 2 ) 9.16 9.20 9.24 9.28 9.32 9.36 400 370 350 300 250
(a)
ferrioxy >400 Ni Mg Co Fe 59.5o 58.5o b ( Å ) Co-Mg JLR Mg-Ni JLR Fe-Mg JLR Fe-Mg RGBn Fe-Ni GR HK-Ann IKO-Ann Ann-oxy-ferrioxy Fe-Mg RGBr 2.04 2.05 2.06 2.07 2.08 2.09 2.10 2.11 2.12 9.16 9.20 9.24 9.28 9.32 9.36(b)
58.5o ferrioxy Ni Mg Co Fe b ( Å ) <M-O> (Å)calcFIGURE 2. Lattice parameter b vs. <M-O> (Table 3) observed for
the various groups of single-crystal biotite-1M samples. The solid lines correspond ψ = constant predictions (validated in Appendix B) made via Equation 1.
FIGURE 1. (a) Lattice parameter b vs. the mean octahedral bond
length <M-O>calc (Eq. 4a) determined for the synthetic powder samples.
(b) Plot of b vs. <M-O>calc showing the maximum variations of
<M-O>calc values (displayed x-axis error bars), that were obtained using
the individual 1σ errors of the cation-speciÞ c do(Mi) values (Table
4, Appendix C). The solid lines correspond ψ = constant predictions (validated in Appendix B) made via Equation 1.
synthetic powder samples. Similarly, Figure 2 displays b as a function of the average octahedral sheet bond length <M-O> (Table 3) for the various groups of single-crystal biotite-1M samples. Some octahedral ß attening ψ = constant (solid lines) predictions made via Equation 1, which are valid for both geo-metric homo-octahedral and geogeo-metric meso-octahedral model octahedral sheets, are shown as references in these Þ gures. For a given synthetic powder sample, <M-O>calc is obtained from Equation 4a using the cation-speciÞ c octahedral bond lengths (Table 4 and Appendix C), the nominal composition of the sample (Mercier et al. 2005b), and the measured ferric and ferrous iron site populations obtained by Mössbauer spectroscopy (Table 2 and Appendix A), assuming that any amounts of tetrahedral ferric iron [IV]Fe3+ occur through Al/Fe exchange between octahedral and tetrahedral sheets (i.e., via the intra-crystalline reaction: [IV]Al3+ + [VI]Fe3+ ↔ [VI]Al3+ + [IV]Fe3+). In the case of the annite-oxyannite-ferrioxyannite series (Ann-oxy-ferrioxy), following Rancourt et al. (2001), annite-oxyannite (Fe2+ + OH–↔ Fe3+ + O2– + H!) and oxyannite-ferrioxyannite (3 Fe2+ ↔ 2 Fe3+ + [VI] + Fe!) stoichiometries were assumed at T
TR ≤ 350 °C and
TTR ≥ 370 °C, respectively (Fig. 1a).
As illustrated in Figure 1b, the distinct crystal chemical behaviors of the “divalent” (Co-Mg JLR, Mg-Ni JLR, Fe-MgJLR, Fe-Mg RGBn, and Fe-Ni GR) and “trivalent” and/or vacancy-bearing (Ann-oxy-ferrioxy and Fe-Mg RGBr) synthetic solid-solution series, shown in Figure 1a and Þ rst described by Rancourt et al. (2001), do not depend on the particular values of cation-speciÞ c octahedral bond lengths that are assumed. That is, the difference in crystal chemical behavior of these two groups of samples (Fig.1a) survives any particular assumed values for the octahedral bond lengths. The error bars displayed in Fig-ure 1b represent the maximum variations in <M-O>calc values obtained for each sample using the individual 1σ errors of the
cation-speciÞ c do(Mi) values given in Table 4. Moreover, the break observed in the behavior of the Ann-oxy-ferrioxy series between TTR = 350 and 370 °C (Fig. 1a) occurs regardless of the stoichiometries assumed for these samples. That is, any combina-tion of the oxybiotite reaccombina-tion (Fe2+ + OH– ↔ Fe3+ + O2– + H!) and the Fe vacancy substitution (3 Fe2+ ↔ 2 Fe3+ + [6] + Fe!) gives a discontinuity such as the one exhibited in Figure 1a.
The break in b observed for the Mg-Ni JLR series (Fig. 1) corresponds to the upper limit of the tetrahedral rotation angle α (see below). Chemical substitution of a smaller Ni2+ cation for a larger Mg2+ cation in the octahedral sheets at a constant [IV](AlSi
3) tetrahedral composition should lead to progressive increase in the dimensional tetrahedral-to-octahedral sheet misÞ t so that α becomes larger as the average octahedral bond length is reduced. Given that the behavior of b is real, therefore, this constitutes direct experimental evidence of the existence of a lower limit of lateral extension concurrent with an upper limit of α-rotation for a given tetrahedral composition.
In Figure 1a, the positions of the solid-solution lines of those nominally divalent series that contain Fe move progres-sively from ψ = 58.5° to higher ψ = constant predictions as the Fe3+/Fe2+ ratio of the given series increases (Table 2), in the sequence Fe-Mg RGBn < Fe-Mg JLR < Fe-Ni GR. This is further illustrated in Figure 3a, where the calculated ß attening angles ψcalc (obtained via Eq. 1) are plotted as a function of <M-O>calc. Note, however, that the slopes of the b vs. <M-O>calc lines for the different synthetic solid solution series (Fig. 1a) depend strongly on the particular values of cation-speciÞ c octahedral bond lengths do(Mi) assumed, within the range given by the individual 1σ errors (Table 4). That is, the ψ = constant behaviors shown in Figure 1a may not be real (i.e., are not robust), however, the series-to-series increases in ψ with increasing Fe3+/Fe2+ ratio are real.
Figures 2 and 3b show that in the single-crystal biotite-1M samples, the average ß attening angle <ψ> (Table 3) decreases with increasing average octahedral bond length <M-O>. Note also that the range of <ψ> values observed for the single-crys-tal biotite-1M samples is closely delimited by the values of ψcalc that were obtained for the Mg-Ni JLR, Co-Mg JLR, and Ann-oxy-ferrioxy solid solution series. Given that geometric homo- and meso-octahedral sheet models (Eqs. 1 and 2) both predict the same constant ß attening-angle lines on a graph of
b vs. <M-O> and that both these models accurately predict b to within ±0.005 Å (Appendix B), this means that the scatter observed in Figures 2 and 3b is related to the different (sample to sample) average octahedral ß attening angles <ψ> that occur in the biotite-1M single crystals (the origin of this scatter is analyzed below).
We conclude that different samples that have the same aver-age octahedral sheet bond length <M-O> can have signiÞ cantly different average octahedral ß attening <ψ> angles, as predomi-nantly determined by their trivalent octahedral cation (Fe3+, Al3+) and vacancy contents.
Indeed, trivalent octahedral cation (Fe3+, Al3+) and va-cancy-bearing synthetic powder samples give crystal chemical behaviors distinct from those of the divalent cation series, corresponding to larger b and ψcalc for given <M-O>calc values, relative to samples belonging to the divalent synthetic solid series
(Fe-Mg, Fe-Ni, Mg-Ni, and Co-Mg). The apparent absence of such distinct crystal chemical behaviors between the various groups of single-crystal biotite-1M samples (Figs. 2 and 3b) is consistent with these Þ ndings, as natural micas most often contain multiple cationic substitutions compared to the simple solid-solution series of the synthetic powder samples. Similar conclusions were reached by previous authors (e.g., Brigatti et al. 1991; Redhammer and Roth 2002; Brigatti and Guggenheim 2002) without b vs. <M-O> plots. All these observations (Figs. 1a, 2, and 3) are consistent with the dominant intra-octahedral-sheet (octahedral cation stereo-chemical) control of ψ that we propose below. 2.04 2.05 2.06 2.07 2.08 2.09 2.10 2.11 58.5 59.0 59.5 60.0
(a)
ψcalc. ( o ) <M-O> (Å) Co-Mg JLR Mg-Ni JLR Fe-Mg JLR Fe-Mg RGBn Fe-Ni GR HK-Ann IKO-Ann Ann-oxy-ferrioxy Fe-Mg RGBr 2.04 2.05 2.06 2.07 2.08 2.09 2.10 2.11 58.2 58.4 58.6 58.8 59.0 59.2 59.4 59.6 59.8 60.0(b)
< ψ > ( ) <M-O> (Å) [Ann-Phl] ( n = 68 ) aluminous-[Ann-Phl] (n = 42 ) tetra-ferri-[Ann-Phl] ( n = 13 ) oxy-Bt ( n = 2 ) calcFIGURE 3. (a) Plots of ψcalc vs. <M-O>calc (Eq. 4a) for the synthetic
powder samples assuming the cation-speciÞ c do(Mi) values (Table 4,
Appendix C). (b) Plot of <ψ> vs. <M-O> (Table 3) for the various groups of single-crystal biotite-1M samples. The thick dark lines correspond to ψcalc and <M-O>calc values obtained for the Mg-Ni JLR, Co-Mg JLR, and
Magnitude of octahedral ß attening angles vs. M1/M2 chemical ordering
Figure 4 shows the M1/M2 ß attening angle tangent ratio, tan(ψM1)/tan(ψM2), as a function of the counter-rotation angle δM2 (Table 3). The solid line shown in this Figure corresponds to geometric meso-octahedral model predictions made using the following relationship (Mercier et al. 2005a):
tan(ψM1)/tan(ψM2) = 2·sin[(π/6) + δM2] (6) In such a representation involving average polyhedral prop-erties of M1 and M2 sites (ψM1, ψM2, δM2), an agreement within expected experimental error is observed between the geometric meso-octahedral sheet model and mica structures with the 1M polytype and C2/m space group. The only exception corresponds to the norrishite sample reÞ ned by Tyrna and Guggenheim (1991), which exhibits unusual octahedral site distortions that are presumably related to Jahn-Teller effects (Tyrna and Gug-genheim 1991; Brigatti and GugGug-genheim 2002). This agreement (Fig. 4) represents strong evidence that the ß attening angle tan-gent ratio between M1 and M2 sites directly follows from the degree of octahedral chemical ordering that causes differently sized M1 and M2 octahedral sites in the single crystals (Mercier et al. 2005b).
However, the degree of octahedral chemical order in the single crystals is not related to the magnitude of the octahedral ß attening angle <ψ>. This is demonstrated in Figure 5, which shows plots of <ψ> as a function of δM2 for the [Ann-Phl], alumi-nous-[Ann-Phl], and tetraferri-[Ann-Phl] groups of single-crystal biotite-1M samples. As indicated by the correlation coefÞ cient (CORR) values, there is no direct relationship between <ψ> and δM2.
Figure 6 shows plots of ψM1 vs. <M1-O> and ψM2 vs. <M2-O> (Table 3) for the different groups of single-crystal biotite-1M
samples. For the [Ann-Phl] and oxy-Bt samples (Figs. 6b and 6d), we note that the individual ψM1 and ψM2 ß attening angles decrease as the <M1-O> and <M2-O> bond lengths increase, respectively, but that the correlation is much higher for M2 than for M1. Similar observations have been made elsewhere (Brigatti et al. 1991; Redhammer and Roth 2002). The tetraferri-[Ann-Phl] samples show correlations similar to those found in the [Ann-Phl] and oxy-Bt samples, except for one sample (Figs. 6a and 6c). The aluminous-[Ann-Phl] samples (Figs. 6a and 6c) do not show linear correlations between ß attening angles and octahedral cation bond lengths. This is probably related to the large frac-tions of [VI]Al3+ and suggests that octahedral ß attening is largely determined by the nature of the octahedral cation.
The above observations (Fig. 6) are consistent with the fact that in model geometric meso-octahedral sheets, the magnitude of the ß attening angles need not be related to the degree of octahedral chemical ordering other than through the M1/M2 ß attening angle tangent ratio (Eq. 6; Fig. 4). So if there is a simple relation between the bond length and ß attening angle for a particular octahedral site, for example a linear correlation such as that observed for the M2 sites of [Ann-Phl] and oxy-Bt single-crystal samples (Fig. 6d), then the lesser degree of correlation obtained for ψM1 vs. <M1-O> (Fig. 6b) is caused by the various degrees of M1/M2 chemical order which occur in the samples. In this way, this also partly contributes to the scatter observed in the plot of b vs. <M-O> for the biotite-1M single crystals (Fig. 2). Having also shown (Fig. 5) that the average octahedral ß at-tening <ψ> is not related to δM2 (i.e., to the degree of octahedral chemical order; Fig. 4), we conclude that the magnitude of the octahedral ß attening is not determined by the degree of M1/M2 chemical ordering that occurs in the sample and that only the M1/M2 ß attening angle tangent ratio follows from differently sized M1 and M2 octahedral sites, as predicted in a geometric meso-octahedral structure having an octahedral sheet of uniform height (Mercier et al. 2005b).
The above conclusion differs from various views expressed in previous works (Lin and Guggenheim 1983; Weiss et al. 1985). We are the Þ rst to show that spatial constraints inherent to a geometric meso-octahedral sheet of uniform height impose the observed relationship (Eq. 6; Fig. 4) between the ß attening angles of M1 and M2 sites and to argue that neither the average magnitude of the ß attening angle nor the individual M1 and M2 ß attening angle magnitudes are related to such geometric constraints. We show that differently sized M1 and M2 sites are accommodated by purely intra-octahedral-sheet geometric matching constraints (Eq. 6; Fig. 4), thereby removing the need to appeal to other mechanisms to explain M1 and M2 ß atten-ing-angle relationships. This implies that the ß attening angle magnitudes themselves (and the average degree of ß attening) are geometrically independent of the M1/M2 relationship (Eq. 6) and any associated degree of chemical ordering causing M1 and M2 size differences.
Tetrahedral-octahedral sheet matching
Next, consider the evidence that tetrahedral-octahedral sheet matching might affect octahedral ß attening. Figure 6d shows that in the [Ann-Phl] and oxy-Bt single-crystal samples, which all have a near-[IV](AlSi
3) tetrahedral composition, the ß attening
-1 0 1 2 3 4 5 0.98 1.00 1.02 1.04 1.06 1.08 1.10 1.12 1.14 norrishite
tan(
ψ
M1) / tan(
ψ
M2)
δ
M2(
o)
( n = 175 )
FIGURE 4. Flattening angle tangent ratio tan(ψM1)/tan(ψM2) vs. the
counter-rotation angle of the M2 site δM2 (Table 3) for the single-crystal
crystal samples (Fig. 6b). That the linear correlation observed is higher for M2 rather than M1 may be due to the greater number of M2 sites in the octahedral sheet (M2:M1 = 2:1), which allows its behavior to dominate whereas the M1 site simply adjusts; or it may be due to chemical order where more steric-effect active cations occupy the M1 sites (see below) and smaller more spheri-cal cations (e.g., Al3+, Fe3+) occupy the M2 sites.
In addition to the M1/M2 difference in ß attening behavior, it is important to note (Figs. 2, 3b, 6) that ψ decreases with increasing <M-O> values or octahedral cation size. This means that octahedral ß attening decreases lateral expansion of the oc-tahedral sheet relative to the expansion that would be related to increasing the octahedral cation bond length alone. This suggests that octahedral lateral expansion is resisted by the tetrahedral sheet, that is, that the tetrahedral sheet resists a decrease in α. The latter interpretation is not correct. An analysis of the bonding energetics (next section) shows that the observed behavior of ψ (Figs. 2, 3b, and 6) is predominantly the result of octahedral cation stereo-chemical bonding properties rather than octahedral-tetrahedral inter-sheet interactions.
Energetic constraints in ψ determination
Possibly the simplest realistic and predictive physical model of ψ that one can construct is one where the values of ψ are de-termined by the energetic compromises between (and combined actions of) three principle factors: (1) a preference of a given octahedral cation species for a particular local octahedral ß at-tening, by virtue of its stereo-chemical bonding properties; (2) long-range ion-charge electrostatic effects, for example, where octahedral cation repulsion would favor increased ß attening by moving the cations further away from each other and by screening the cations with oxygen anions between them; and (3) resistance or encouragement from the tetrahedral sheets, arising from an energetically preferred tetrahedral rotation angle for a given tetrahedral cation composition (e.g., Peterson et al. 1979). In general, bond lengths are determined with high cation-anion speciÞ city whereas cation-anion-cation bond angles generally adjust to overall connectivity constraints. Thus, we expect that the Þ rst factor plays a more important role than the third because lo-cal cation-oxygen bonding constraints are expected to be stronger than cation-oxygen-cation bond-bending constraints.
We tested these ideas by constructing a mathematical model of the above energetics of ψ determination, in which we ignored the electrostatic term. This model assumes that bond stretching is energetically prohibitive and takes the free energy per unit of the T-O-T layer, U, to consist of three terms: a constant, C, that is ψ and α independent, a term linear in α, and a term linear in ψ. This is equivalent to a Tailor series expansion of U(α,ψ) to Þ rst order in the two variables, around a point close to observed values of α and ψ:
U(α,ψ) = C + Etet α + Eoct ψ (7) where Etet and Eoct are physical constants having units of energy per radian. Given our assumption of no bond stretching, the octahedral and tetrahedral sheets must be commensurate, such that one has the added α-ψ constraint (obtained by equating Eqs. 1 and 3): 58.0 58.4 58.8 59.2 59.6
<
ψ
> (
o)
[Ann-Phl] ( n = 68 ) CORR = 0.444 58.0 58.4 58.8 59.2 59.6<
ψ
> (
o)
aluminous-[Ann-Phl] ( n = 42 ) CORR = 0.099 -0.8 -0.6 -0.4 -0.2 0.0 0.2 0.4 0.6 0.8 1.0 58.0 58.4 58.8 59.2 59.6<
ψ
> (
o)
δ
M2(
o)
tetraferri-[Ann-Phl] (n = 13 ) CORR = -0.095FIGURE 5. Plots of <ψ> vs. δM2 (Table 3) for the various groups of
single-crystal biotite-1M samples.
angle ψM2 monotonously decreases as the average bond length <M2-O> increases. Such a correlation, although weaker, is also observed in the M1 sites of these [Ann-Phl] and oxy-Bt
single-cos(α) = [3 do sin(ψ)] / [4 dtbas sin(τbas / 2)] (8) Therefore, Equation 7 is cast into a function of a single vari-able, either α or ψ. Values of α (or ψ) that minimize the energy, for given bond lengths and tetrahedral basal ß attening (speciÞ c Obas-T-Obas tetrahedral basal bond angles, τbas, are preferred for a given tetrahedral sheet composition; see below), depend only on the dimensionless ratio Etet/Eoct and only occur for positive values of this ratio. Because an increase in ψ away from the ideal value of ∼54.74° corresponds to a more distorted octahedron and an increase in α away from 0° corresponds to a more distorted tetrahedral sheet, we expect both Etet and Eoct to be positive. Indeed, we only Þ nd solutions consistent with the observed data (Fig. 6 and associated changes in α) for positive values. Also, to obtain observed values of α (<12°), Etet/Eoct must be < 0.35. This is consistent with the idea that a change in tetrahedral rotation is easier to accomplish than a change in octahedral ß attening. We conclude that Eoctψ is the dominant term in determining
octahe-dral ß attening and that it probably arises from the steric nature of the octahedral cation-oxygen bond. This, in turn, implies that Eoct depends on the octahedral cation species. The simplest way to model the latter “compositional” dependence is to assume a linear dependence of Eoct on do as:
Eoct = δ0 + δ1 do (9)
Because ψ decreases with do (Fig. 6), δ1 must be positive and sufÞ ciently large to produce the observed effect.
This simple model reproduces observed variations in α and ψ with do for the main Mg-Fe mica solid solutions. If it is correct, it implies that the decrease in ψ with increasing <M-O> is related to octahedral cation stereo-chemical bonding properties and that tetrahedral-octahedral inter-sheet interactions cannot contribute to this decrease because the sign of Etet is the opposite of what it would need to be to amplify the effect. In other words, the local steric requirements on ψ are sufÞ ciently strong to overcome
2.05 2.06 2.07 2.08 2.09 2.10 2.11 2.12 2.13 58.2 58.4 58.6 58.8 59.0 59.2 59.4 59.6 59.8
ψ
M1(
o)
<M1-O> (Å)
[Ann-Phl] oxy-Bt 58.2 58.4 58.6 58.8 59.0 59.2 59.4 59.6 59.8 aluminous-[Ann-Phl] tetraferri-[Ann-Phl]ψ
M1(
o)
(a)
(b)
2.05 2.06 2.07 2.08 2.09 2.10 2.11 2.12 58.2 58.4 58.6 58.8 59.0 59.2 59.4 59.6 59.8ψ
M2(
o)
<M2-O> (Å)
[Ann-Phl] oxy-Bt 58.2 58.4 58.6 58.8 59.0 59.2 59.4 59.6 59.8 aluminous-[Ann-Phl] tetra-ferri-[Ann-Phl]ψ
M2(
o)
(c)
(d)
FIGURE 6. Flattening angle ψM1 vs. <M1-O> (a, b) and ψM2 vs. <M2-O> (c, d) for the various groups of single-crystal biotite-1M samples
the weaker countering inß uence of the tetrahedral sheets and the variations in ψ with do are smaller than they would be for an isolated octahedral sheet.
The latter conclusion and the related conclusions that octa-hedral cation stereo-chemical bonding properties predominantly determine ψ and that a change in tetrahedral rotation is easier to accomplish than a change in octahedral ß attening all go against the idea that in biotite, octahedral ß attening is a mechanism for alleviating tetrahedral-octahedral sheet mismatch. Instead, octa-hedral ß attening increases the sheet mismatch energy, in that it increases the tetrahedral sheet energy. One should consider that octahedral ß attening is predominantly determined by octahedral cation composition, as is the mean octahedral cation bond length, and that the resulting lateral dimensions of the octahedral sheet must consequently be accommodated by adjustments in the tetrahedral sheets, predominantly via tetrahedral rotation for a given tetrahedral cation composition and associated tetrahedral basal ß attening angle.
T
ETRAHEDRALFLATTENINGANDTETRAHEDRAL ROTATIONLIMITSComposition-speciÞ c tetrahedral basal ß attening
Tetrahedral ß attening occurs and is important to include in any quantitative crystal chemical analysis of the tetrahedral sheet, if a quantitative analysis of tetrahedral rotation is required. Figures 7 and 8 display the average basal tetrahedral edge length <Obas-Obas> as a function of the average basal tetrahedral bond length <T-Obas> (Table 3) for the 175 single-crystal 1M samples and for the single-crystal biotite-1M samples, respectively. The lines in these Þ gures correspond to tetrahedral ß attening Obas-T-Obas angle τbas = constant predictions made using the fol-lowing relationship (Mercier et al. 2005a; Eq. B-7a, Fig. B-2,
Appendix B):
etbas = 2 dtbas sin(τbas/2) (10)
where etbas is the length of the three Obas-Obas basal edges, dtbas is the length of the three T-Obas bonds, and τbas is the value of the three Obas-T-Obas angles. Figure 7 shows that the K-rich samples display fair agreement with the τbas = 108.5° prediction (solid line), whereas other groups of samples having different tetrahe-dral sheet and/or interlayer contents occur at other values of τbas (cf. Brigatti and Guggenheim 2002). In the case of the biotite-1M samples (Fig. 8), most of the aluminous-[Ann-Phl] and tetraferri-[Ann-Phl] samples lie above the τbas = 108.5° prediction line, whereas the [Ann-Phl] and oxy-Bt samples closely follow the latter prediction line.
1.62 1.64 1.66 1.68 1.70 1.72 1.74 1.76 2.60 2.65 2.70 2.75 2.80 2.85 ( n = 175 ) τbas = 108.50 o τbas = 109.75 o τbas = 111.25o (Ge~3Al~1) (Ge~4) K(Si~4) Ca(Al~3Si~1) Na(Al ~2Si~2) <O -O > bas ( Å ) <T-O >bas (Å) K-rich bas 2.66 2.68 2.70 2.72 2.74 1.64 1.65 1.66 1.67 1.68 108.5o <T-O >bas (Å) <O -O > bas ( Å ) [Ann-Phl] oxy-Bt 2.66 2.68 2.70 2.72 2.74 <O -O > bas ( Å ) 108.5o aluminous-[Ann-Phl] tetraferri-[Ann-Phl] bas bas
FIGURE 7. Average basal tetrahedral edge length <Obas-Obas> vs. the
average basal tetrahedral bond length <T-Obas> (Table 3) for the 175
single-crystal 1M reÞ nements. The various lines correspond to predictions (validated in Appendix B) that are explained in the text.
FIGURE 8. Average basal tetrahedral edge length <Obas-Obas> vs. the
average basal tetrahedral bond length <T-Obas> (Table 3) for the various
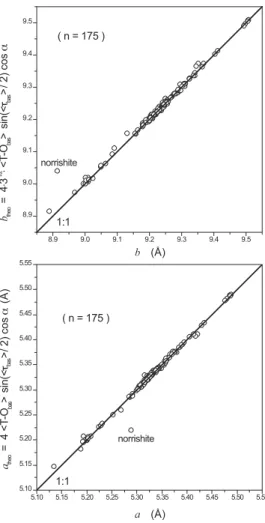
Upper limit of the tetrahedral rotation angle
Figure 9 shows the calculated tetrahedral rotation angle, αcalc, as a function of the octahedral-to-tetrahedral cation-anion bond length ratio, <M-O>calc/<T-Obas>calc, for various solid solution series of synthetic powder samples. <T-Obas>calc is the mean basal tetrahedral bond length calculated in the same manner as for <M-O>calc via Equation 4b. For a given synthetic powder sample, αcalc is obtained from the measured b and calculated <T-Obas>calc values via Equation 2b assuming that τbas = 108.5° (Figs. 7 and 8). The various predictions that are displayed as thin solid lines in Figure 9 are obtained using Equations 1b and 3b at a given octahedral ß attening angle ψ with τbas = 108.5° (Figs. 7 and 8).
For a given value of tetrahedral ß attening τbas, the point of initiation of the lower limit of α = 0° (illustrated by the posi-tions of the small arrows shown in Fig. 9) moves from lower to higher <M-O>calc/<T-Obas>calc ratio as the octahedral ß atten-ing ψ increases. The lower limit of α = 0° corresponds to the point where fully extended tetrahedral sheets cannot laterally Þ t onto larger octahedral sheets. On the basis of the structural parameters that were taken to occur for octahedra (<M-O>calc, ψ) and tetrahedra (<T-Obas>calc, τbas), note that all the annite (Fe end-member) synthetic powder samples fall in a regime where octahedral and tetrahedral sheets cannot be matched, as predicted by Hazen and Wones (1972).
The upper limit of α shown in Figure 9 for the Mg-Ni JLR series, which corresponds to the break in b seen in Figure 1, occurs regardless of any set of cation-speciÞ c basal tetrahedral bond lengths dtbas(Ti) taken between Shannon values and the ones used in this paper (Table 4). The only difference is that slightly different plateau values for α are obtained. Here, with the structural parameters that are assumed, an upper limit of α ≤ 9.5° is obtained. The same upper limit is also obtained in
the Ann-oxy-ferrioxy series (Fig. 9), where all samples have a tetrahedral composition of [IV](Al
0.88Si3Fe3+0.12) (Rancourt et al. 1994a, 2001). Note that the particular upper limit value of α = 9.5° is corroborated, as shown below (Figs. 10–12), by a detailed examination of available structural reÞ nement data, thereby lending further support to the characteristic cation- and coordination-speciÞ c bond length values used in this work (Table 4, Appendix C).
Figures 10a–c show the average tetrahedral rotation angle α as a function of the bond length ratio <M-O>/<T-O>bas (Table 3) for the 175 crystal 1M samples and for the single-crystal biotite-1M samples, respectively. The dashed-dotted horizontal lines displayed in these Þ gures are drawn at the same α positions as those illustrated in Figure 9. Note that Figure 10a is shown on an overall scale, while Figure 10b has the same horizontal and vertical scales as Figure 9. In examining Figures 10b and 10c, note that the density of the data points is higher near the dashed-dotted line positioned at α = 9.5°. Redhammer and Roth (2002) made similar observations by plotting the average tetrahedral rotation angle α as a function of the mean octahedral cation radii, calculated using the tables of Shannon (1976), for a subset of the 175 single-crystal 1M samples considered here.
Figure 11 presents the distribution of α for all 175 single-crystal 1M structures. The distribution is clearly asymmetric. All samples outside the main trend displayed by the biotite-1M samples belong to groups that have signiÞ cantly different tet-rahedral-sheet contents, except for the paragonite dioctahedral mica [ideally Na(Al2 )(AlSi3)O10(OH)2] reÞ ned by Soboleva et al. (1977). In the same connexion, Figure 12 shows the dis-tributions of α for the [Ann-Phl], aluminous-[Ann-Phl], and tetraferri-[Ann-Phl] groups separately. Overall, Figure 12 represents further evidence that an upper limit is present at α ≅ 9.5° for the [Ann-Phl] samples, although it is less compelling than the observed break in b in the synthetic Mg-Ni series (Fig. 1) and the associated analysis (Fig. 9). Moreover, as discussed by Hazen and Wones (1978), Figure 12 suggests that an upper limit on α is tetrahedral composition dependent.
Comparison with the lower limit and impact on octahedral ß attening
The lower limit on α (α = 0°) corresponds to a fully extended tetrahedral sheet in its maximum lateral extension state. Beyond this point, bond breakage by over stretching or intra-tetrahedral oxygen-cation-oxygen bond angle bending away from the pre-ferred tetrahedral composition-speciÞ c τbas angle (Figs. 7 and 8) must occur if a larger tetrahedral sheet is imposed. In contrast, the upper limit on α does not arise from such stringent conditions because, from a geometric perspective, a smaller octahedral sheet could simply be accommodated by more tetrahedral rotation (i.e., a larger value of α) without any geometrically required bond stretching or bending.
The lower limit on α (α = 0°) is intrinsically a tetrahedral sheet property and causes necessary adjustments in octahedral sheets that would otherwise be too large, such as the well-known oxidation and cation-exchange mechanisms in annite (Hazen and Wones 1972; Redhammer et al. 1993; Mercier et al. 1996, 1999; Rancourt et al. 1994a, 2001). On the other hand, one could argue
FIGURE 9. Calculated tetrahedral rotation angle αcalc as a function
of the octahedral-to-tetrahedral cation-anion bond length ratio <M-O>calc/<T-Obas>calc (Eq. 4) for the synthetic powder samples.
1.16 1.18 1.20 1.22 1.24 1.26 1.28 0 5 10 15 20 25 ψ = 58.5o ψ = 59.0o ψ = 58.5o Ge-containing paragonite preiswerkite clintonite α ( o ) 1.230 1.235 1.240 1.245 1.250 1.255 1.260 1.265 1.270 1.275 0 1 2 3 4 5 6 7 8 9 10 α ( o )
<M-O> / <T-O >
bas(a)
(b)
1.230 1.235 1.240 1.245 1.250 1.255 1.260 1.265 1.270 1.275 0 1 2 3 4 5 6 7 8 9 10 11 12 13 α ( o ) [Ann-Phl] tetra-ferri-[Ann-Phl] aluminous-[Ann-Phl] oxy-Bt(c)
0 5 10 15 20 25 0 5 10 15 20 9.5o clintonite preiswerkite paragonite [IV](Ge 4) [IV] (GeAl3) Number of samples α(
o)
all single crystal ( n = 175 )
FIGURE 10. Average tetrahedral rotation angle α vs. the ratio <M-O>/
<T-Obas> (Table 3) observed for: the 175 single-crystal 1M reÞ nements
(a) = overall scale, (b) = same horizontal and vertical scales as Figure 9; and (c) the various groups of single-crystal biotite-1M samples. The dashed-dotted lines that are displayed are drawn at the same α positions as those illustrated in Figure 9.
FIGURE 11. Distribution of α (Table 3) for the 175 single-crystal 1M
reÞ nements. The dashed line corresponds to α = 9.5°.
that the observed upper limit on α is caused by the octahedral sheet that, for example, in the Mg-Ni series (Fig. 1) would have an average octahedral ß attening angle that would vary in the right way to cause a constant octahedral (and tetrahedral) lateral extension. This seems unlikely compared to the simpler expla-nation, for example, that bond bending of cation-oxygen-cation bridging bonds between neighboring tetrahedra in the tetrahedral sheet is energetically prohibitive beyond some effectively critical value. The simpler interpretation where the upper limit on α, like the lower limit, is also intrinsically a tetrahedral sheet property, explains as well why the ferrioxyannite samples show the same value of the upper limit α (Fig. 9) and why changing the compo-sition of the tetrahedral sites alone (for a given interlayer cation composition) appears to change the value of the upper limit α (and the tetrahedral composition-speciÞ c value of the tetrahedral basal ß attening angle) (Figs. 7, 8, 9, and 12). We conclude that the observed upper limit on α is primarily a tetrahedral sheet property and that it imposes the observed concomitant octahedral ß attening adjustments.
Possible cause of the upper limit in tetrahedral rotation
The only previous attempt to explain a possible upper limit on α observed in both synthetic powders (Fig. 9) and natural biotite-1M single crystals (Fig. 12) was that of Hewitt and Wones (1975). They suggested that interlayer bonding constraints may give rise to a maximum tetrahedral rotation. They also suggested
0 1 2 3 4 5 6 7 8 9 10 11 12 13 0 2 4 6 8 10 12 14 α ( o ) Number of samples [Ann-Phl] ( n = 68 ) 0 1 2 3 tetraferri-[Ann-Phl] ( n = 13 ) Number of samples 0 1 2 3 4 5 6 7 8 aluminous-[Ann-Phl] ( n = 42 ) Number of samples
FIGURE 12. Distribution of α (Table 3) for various groups of
single-crystal biotite-1M samples. The dashed lines correspond to α = 9.5°.
lattice parameters of their most aluminous synthetic biotites ranged from 12° and 2.89 Å in their Mg-free samples to 14° and 2.77 Å in their Fe-free samples. The accepted range of bond lengths for K with coordinations between 6 and 12 range from 2.76 to 3.16 Å (e.g., Shannon 1976) and led Hewitt and Wones to propose that the interlayer site controls the maximum value of α and thus the maximum amount of Al substitution, because Al substitution in biotite via the Tschermak’s substitution [i.e., [VI](Fe2+, Mg2+) + [IV]Si4+ ↔ [VI]Al3+ + [IV]Al3+] increases the amount of necessary tetrahedral rotation α, that in turn directly impacts the interlayer cation environment.
However, the tetrahedra of actual 1M micas are not regular (Figs. 7 and 8; Fig. B-2, Appendix B; Brigatti and Guggenheim 2002) and this strongly affects calculated α-rotation and inter-layer bond lengths (e.g., Takeda and Morosin 1975). Moreover, the inner (i.e., Þ rst nearest neighbor) interlayer site bond lengths actually observed in single-crystal K-rich 1M polytype C2/m space group micas ranges from ∼2.90 to ∼3.15 Å (e.g., Brigatti and Guggenheim 2002; Mercier 2003). Using the reasoning of Hewitt and Wones (1975), we found that the interlayer K-O bond lengths actually observed in real mica samples are not a limiting factor for α.
We therefore reafÞ rm our conclusion that the upper limit of α ≤ 9.5° present in K-rich 1M micas having a near-[IV](AlSi
3) tetrahedral composition, for both synthetic powders and natural single crystals, is predominantly determined by the tetrahedral sheets themselves. We attribute the latter upper limit on α to a tetrahedral-sheet bond bending limit. Further work to quantify upper limit α values for other tetrahedral sheet compositions (as suggested by Fig. 12) and to attempt electronic structure calcu-lations that would elucidate the physical cause of a maximum value of α, in terms of electronic distributions and energies, would be of great interest.
I
MPLICATIONSFORTHESTABILITYRELATIONSHIPSOF MICASStructural limits (that can be expressed as geometrical limits) must have implications for thermodynamic stability because such limits are fundamentally caused by energy (bonding energy) constraints. The next question is the extent to which a particular structural constraint will affect stability relations (on a P-T diagram) and compositional limits. A quantitative answer to this question for our observed upper tetrahedral rotation limit is beyond the scope of the present paper, however one can quali-tatively ascertain how this limit might act. In particular, we can do this in comparison to some of the known effects of the lower tetrahedral rotation (α = 0) limit.
That the maximum lateral extension (α = 0°) limit signiÞ -cantly affects the energetics of annite, to the point of disallowing the ideal end-member composition, is well established (e.g., Rancourt et al. 2001) and shows that the tetrahedral sheet can impose a strict stability limit rather than always simply adapting (by tetrahedral rotation) to the octahedral sheet. Similarly, if the tetrahedral sheet also imposes a minimum lateral extension (α = αmax) limit, then this must also restrict the octahedral sheet at the small lateral extension end in a way that will increase the octahedral sheet free energy compared to not being subjected to this limit.
that an upper limit on α was the reason that Al-substitutions in synthetic biotite solid solutions cease at a tetrahedral-octahedral composition of [IV](Al
1.75Si2.25)-[VI]([Fe,Mg]2.25Al0.75).
The argument of Hewitt and Wones (1975) was based on calculated α-rotation angles and interlayer K-O bond lengths obtained using Figure 4 of Donnay et al. (1964b), who assumed regular tetrahedra in their calculations. The α-rotation and K-O bond lengths that Hewitt and Wones (1975) obtained from the