Publisher’s version / Version de l'éditeur:
Vous avez des questions? Nous pouvons vous aider. Pour communiquer directement avec un auteur, consultez la première page de la revue dans laquelle son article a été publié afin de trouver ses coordonnées. Si vous n’arrivez pas à les repérer, communiquez avec nous à [email protected].
Questions? Contact the NRC Publications Archive team at
[email protected]. If you wish to email the authors directly, please see the first page of the publication for their contact information.
https://publications-cnrc.canada.ca/fra/droits
L’accès à ce site Web et l’utilisation de son contenu sont assujettis aux conditions présentées dans le site
LISEZ CES CONDITIONS ATTENTIVEMENT AVANT D’UTILISER CE SITE WEB.
Journal of Building Physics, 36, 1, pp. 35-56, 2012-06-28
READ THESE TERMS AND CONDITIONS CAREFULLY BEFORE USING THIS WEBSITE.
https://nrc-publications.canada.ca/eng/copyright
NRC Publications Archive Record / Notice des Archives des publications du CNRC :
https://nrc-publications.canada.ca/eng/view/object/?id=0e9044e4-48ca-4a69-a0f3-508dbcdcca4f https://publications-cnrc.canada.ca/fra/voir/objet/?id=0e9044e4-48ca-4a69-a0f3-508dbcdcca4f
NRC Publications Archive
Archives des publications du CNRC
This publication could be one of several versions: author’s original, accepted manuscript or the publisher’s version. / La version de cette publication peut être l’une des suivantes : la version prépublication de l’auteur, la version acceptée du manuscrit ou la version de l’éditeur.
For the publisher’s version, please access the DOI link below./ Pour consulter la version de l’éditeur, utilisez le lien DOI ci-dessous.
https://doi.org/10.1177/1744259111411653
Access and use of this website and the material on it are subject to the Terms and Conditions set forth at
Condensation risk assessment on box windows: the effect of the window-wall interface
Maref, W.; Van Den Bossche, N.; Armstrong, M.; Lacasse, M. A.; Elmahdy, H.; Glazer, R.
Condensation risk assessment on
box windows: the effect of the
window-wall interface
Maref, W.; Van Den Bossche, N.; Armstrong, M.; Lacasse, M.A.; Elmahdy, H.;
Glazer, R.
NRCC-54539
A version of this document is published in / Une version de ce document se trouve dans: Journal of Building Physics, 35, (2), pp. 1-22, July-20-11, DOI: 10.1177/1744259111411653
The material in this document is covered by the provisions of the Copyright Act, by Canadian laws, policies, regulations and international agreements. Such provisions serve to identify the information source and, in specific instances, to prohibit reproduction of materials without written permission. For more information visit http://laws.justice.gc.ca/en/showtdm/cs/C-42
Les renseignements dans ce document sont protégés par la Loi sur le droit d’auteur, par les lois, les politiques et les règlements du Canada et des accords internationaux. Ces dispositions permettent d’identifier la source de l’information et, dans certains cas, d’interdire la copie de documents sans permission écrite. Pour obtenir de plus amples renseignements : http://lois.justice.gc.ca/fr/showtdm/cs/C-42
CONDENSATION RISK ASSESSMENT ON BOX
WINDOWS: THE EFFECT OF THE WINDOW-WALL
INTERFACE
W. Maref1, N. Van Den Bossche2, M. Armstrong1, M.A. Lacasse1, H. Elmahdy1and R. Glazer1
1-National Research Council Canada, Institute for Research in Construction, Ottawa, ON, Canada
2-Ghent University, Department of Architecture and Urban Planning, Ghent, Belgium
ABSTRACT: Windows generally have the lowest temperature index in current building
types, and will consequently be the primary location for interior surface condensation. Surface temperatures can easily be calculated using thermal finite-element-models, but these generally omit the effect of convection in the windows and the window-wall interface. Hence, there is a need to determine if specific interface details provide potential for condensation on the window components in which air leakage paths may be prominent. The paper reports on a laboratory evaluation of condensation risk assessment in a hotbox, with varying pressure differences and the introduction of deficiencies. It was concluded that the effect of the type of insulation in the window-wall interface was very low for isobaric boundary conditions, whereas it has a significant effect when pressure differences are applied.
Keywords: Condensation, window frames, airtightness
1 INTRODUCTION
Surface condensation on double glazing is a frequently occurring problem in buildings (Muneer and Abodahab, 1998). It typically occurs due to changes in indoor humidity or
indoor or exterior temperature. For example: condensation on a window in a bedroom can be a combination of heightened moisture production (occupancy during the night), intermittent heating (lower temperatures at night) and nocturnal long-wave radiation to the sky. Surface condensation is not only a comfort problem, but it may also accelerate deterioration of finishing products around the window frame, introduce corrosion of metal elements, and induce mould growth in wooden frames. Due to recent evolutions in the performance of both Insulated Glass Units (IGU) and window frames, the predominant location for surface condensation for a specific window may differ depending on the thermal performance of both products.
Currently, several commercial software packages allow calculating the thermal performance of window frames and IGUs (see e.g. the validation study by Duer et al., 2002). For any given boundary conditions these simulation tools can calculate the lowest surface temperature on the interior side where condensation will most likely occur first. An overview of these tools, their capabilities and limitations, and an evaluation of standardized simulation procedures was offered by Gustavson et al. (2008). Several authors have investigated specific aspects of the window that affect the risk on surface condensation. Moshfegh et al. (1989) and Larsson et al. (1999) analyzed the interior temperatures and condensation risk based on thermal simulations of a window frame with triple-glass windows. Abodahab and Muneer (1998) analyzed the longitudinal temperature variation due to buoyancy driven gas flow within the sealed IGU-cavity. Due to that thermal gradient, the lowest temperatures of the IGU are typically found near the sill, and overall U-values are not reliable to assess the condensation risk. Furthermore, the thermal performance of the IGU is closely related to the design of the spacer bar
around the perimeter. Elmahdy and Frank (1993) and Elmahdy (2003) analyzed the effect of spacer bars on the interior surface temperature by comparing numerical simulations with experimental results from a hotbox test setup. Principally three main conclusions can be extracted: the effect of spacer bars should not be underestimated, the difference between different types of spacer bars is significant, and numerical simulations can be used to predict the effect of spacer bars. Similar conclusions were reported by Arasteh (1991) and Song et al. (2007). Gustavson and Thue (2007) used Computational Fluid Dynamics (CFD) to analyse natural convection in three-dimensional cavities, such as those found in aluminum, vinyl and steel window frames. The results show that a number of effects are not taken into account in widely used numerical software – as discussed by Gustavson et al. (2008). However, these effects are very small and negligible compared to uncertainties in other aspects that determine the condensation risk. Window frames can incorporate local components that are not often taken into account, such as reinforcements in corners, local elements to support the glass (between the glass and the sash), hinges and gearbox. The effect of these components has not been reported extensively in literature.
Besides the performance of the window, the condensation risk also depends on the boundary conditions it is subjected to. Analysis of heating patterns and their effect on interior surface temperatures by Becker (1998) pointed out that intermittent heating can significantly affect the condensation risk due to erroneous assumptions concerning interior temperatures. Furthermore, local effects of air movement on condensation were studied both experimentally as with CFD by Liu et al (2004), and with CFD by Bong et al.
(1998). On the exterior side of the window, the effect of solar radiation and local shading can introduce complex heat flow patterns (Shapiro et al., 1987).
One aspect that is typically omitted in research on condensation risk assessment of windows, is the effect of air leakage in the window-wall interface on the interior surface temperatures of the window. Research by Proskiw (1994) on 8 different window installation techniques showed that some solutions were prone to air leaks, which may have an influence on the interior surface temperatures of the window. It may very well be that a constant pressure difference, generated by wind pressure, stack effect or HVAC systems, introduces an air flow from the cold exterior side to the warm interior of the window. Depending on the type of construction, the window is connected to the wall by way of one or two airtight layers. The interior one is typically called the airtightness layer, whereas the one on the exterior is commonly called the weathertightness layer. Window components are susceptible to water entry over their expected life [Lacasse et al. 2007] hence there is a need to ensure the window installation details permit adequate drainage at the rough opening of the window subsill. Consequently, the exterior side of the window installation does not act as an airtight layer, and the window installation may be prone to air infiltration because it relies on a single barrier.
There exist several standard laboratory test methods for determining the potential for the formation of condensation on windows, as provided in table 1, however the essential aspects of such methods were first proposed by Sasaki [Sasaki, 1971] and the
ndardisation work carried out in AAMA [AAMA, 1972; AAMA, 1998], ASTM [ASTM, 2000] and CSA [CSA, 2004] follows on these initial efforts. These standards prescribe the overall test protocol, temperatures of the room side and cold side, and maximum relative sta
humidity under test conditions. A useful overview of these methods is given by Elmahdy [1990].
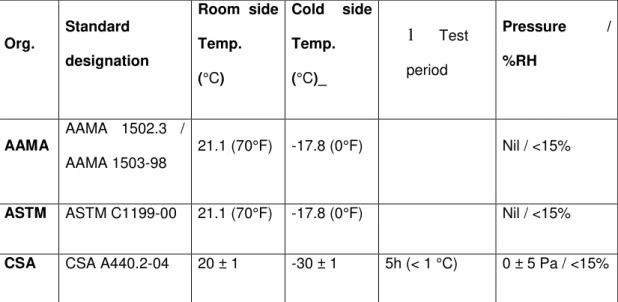
Table 1. List of standards for determining condensation potential of windows.
Org. Standard designation Room side Temp. (°C) Cold side Temp. (°C)_ 1 Test period Pressure / %RH AAMA AAMA 1502.3 / AAMA 1503-98 21.1 (70°F) -17.8 (0°F) Nil / <15%
ASTM ASTM C1199-00 21.1 (70°F) -17.8 (0°F) Nil / <15%
CSA CSA A440.2-04 20 ± 1 -30 ± 1 5h (< 1 °C) 0 ± 5 Pa / <15%
The essential elements of the method, briefly described, consist of testing a window in a hotbox chamber, measuring the lowest window glazing and frame surface temperatures from specified locations on the window, and calculating the average exterior air temperature and the average interior air and wall surface temperatures. The “Temperature Index” ( I ) of the window can then be determined based on the following relationship provided in the CSA A440.2 Standard [CSA, 2004]:
I = (Ts–To) / (Ti – To) x 100 (1)
where Ti and To are the indoor and outdoor air temperatures, and Ts is the average
room-side surface temperature measured in the test. For the equation (1) to be used internationally, a different definition of the temperature index is used according to EN ISO 13788:2001:
I = (Ts–To) / (Ti – To) (2)
The temperature index is non-dimensional, and represents the interior surface temperature relative to the interior and exterior air temperatures. The use of the temperature indexes offers the opportunity to compare the thermal performance of samples subjected to different boundary conditions. Due to Fourrier’s law of conduction (leading to linear correlation between heat transfer and temperature difference), the temperature index does not depend on the absolute value of the boundary conditions. In this paper, the temperature index is used to present and analyze the results. Between different measurements there were slight deviations in the room and outside temperatures (due to the applied pressure difference). Consequently, the use of the temperature index allows intercomparison of the results, whereas the absolute temperatures can only be interpreted taking into account the accurate temperature difference over the specimen. In order to enhance the practical interpretation of the results, information is also provided on absolute temperatures, but these are calculated using the temperature index, and as such omit the differences due to variations in boundary conditions. Condensation will occur when the vapor pressuring the air near the building component is above the vapor saturation pressure that corresponds to the surface temperature. The saturation pressure can be calculated as follows (EN ISO 13788:2001): ����= 610.5∗ � 17.269∗ � 237.3+ � for θ ≥ 0°C (3) ����= 610.5∗ � 21.875∗ � 265.5 + � for θ < 0°C (4)
Where psat is the vapor saturation pressure (Pa), and θ the air temperature (°C). The
inverted equations to calculate the temperature corresponding to any saturated vapor pressure:
� = 237.3∗�����610.5�����
17.269−�����610.5����� for psat≥ 610.5 Pa (5)
� = 265.5∗�����610.5�����
21.875−�����610.5����� for psat < 610.5 Pa (6)
This paper reports on a laboratory evaluation for assessing the potential for the formation of condensation at the window frame, sash or glazing for window installations that incorporate sill pans. The laboratory test method given in the CSA A440.2 standard [CSA, 2004] was used as a basis for determining the potential for the formation of condensation on windows as a function of both temperature and pressure difference across the test assembly.
2 EXPERIMENTAL SETUP AND PROCEDURE
The purpose of the test was to obtain surface temperature measurements on specific window components that thereafter permitted determining whether there existed conditions suitable for the formation of condensation given specified interior and exterior conditions. The CSA A440.2 [CSA, 2004] test method for determining condensation potential on windows, as described by Elmahdy [1990], was followed with the following exceptions: the pressure difference across the specimen was adjusted to 20 and 40 Pa and at levels in excess of that required in the standard (i.e. 0 ± 5 Pa); steady state conditions were maintained for at least 6 hours (compared to 5 h in the standard); once
steady state was achieved, readings were averaged over a period of at least 2 hours; deficiencies were introduced at the wall-window interface. A guarded hotbox [Bowen 1985] was used to subject a suitable specimen, incorporating a window and related interface details, to temperature differentials specified in the test. A description of the hotbox is provided by Brown et al. [1961]. Details on the experimental procedure, the calibration of the hotbox, specimen instrumentation and data acquisition are provided in subsequent sections.
2.1 Test setup
In respect to the choice of installation details, consideration was only given to those details that had in a previous study [Lacasse et al., 2007] demonstrated an ability to adequately manage rainwater entry. Such installation details typically include a sloped sill with sill pan flashing incorporating a back dam. Research and analysis has been completed on installation details for flanged mounted and box windows. This paper reports on results derived from testing the installation details for box windows; results on flanged windows are given in Maref et al. [2010].
The nominal size of the test frame incorporating the wall-window interface was 1.22-m wide by 2.44-m high, and framed with 51 by 152-mm Spruce-Pine-Fir lumber. The test assembly was intended to be representative of typical North American wood frame construction practice. The exterior cladding of the assembly was hardboard wood composite siding, installed in accordance with current building practice, and directly to the sheathing membrane (Weather Resistive Barrier-WRB-spun bonded polyolefin). The membrane overlays an oriented strand board (OSB; 11-mm) wood sheathing panel
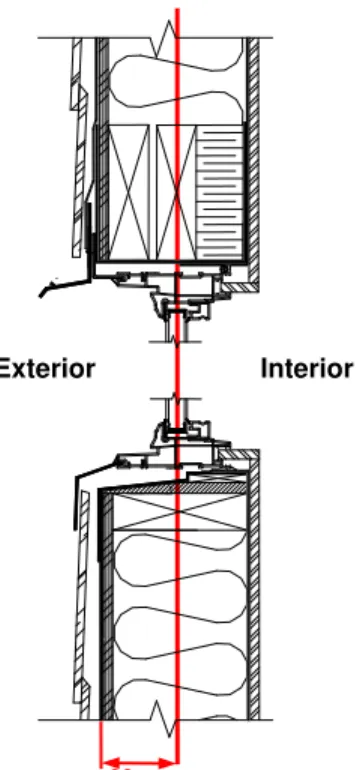
affixed over the wood frame. Glass fibre batt type insulation was placed in the stud cavities adjacent to the window opening and the interior finish was gypsum board (12.7-mm). A fixed (non-operable) non-flanged PVC window (610-mm by 1220-mm) was centered vertically within the specimen. The window was installed with the glazing aligned with the plane of thermal resistance of the wall. Figure 1 provides installation details of a box window incorporating pan flashing, sloped sill, up-stand and related details that help promote drainage of water from the windowsill if subjected to inadvertent water entry. Figure 1 shows the location of the plane of thermal resistance of the wall in relation to that of a box window installed along the same plane.
Figure 1. Installation detail for box window
The space between the window frame and wood frame wall was left empty (Test set 1), was filled with glass fibre insulation (Test set 2) or spray-in-place polyurethane foam (SPF) (Test set 3). Finally, given the interest in using installation details that included a
Exterior Interior
sill pan, thought was given to possible paths of air leakage through the assembly at the sill and the type of deficiencies that might arise at these locations due to improper installation of components or premature failure of seal components. The introduction of two deficiencies at the wall-window interface provided a means to evaluate whether air leakage across different components of the window assembly caused condensation to form on the warm side of the wall assembly when leakage was induced in the test assembly. A first deficiency was located at the exterior of the wall-window interface and at the juncture of the cladding and window frame at the lower extreme corner of the window, whereas the second one was situated at the interior of the assembly at the interface between the window frame and the interior finish but located at the upper most and opposite corner of the window assembly.
2.2 Test procedure
Both the temperature and relative humidity (RH) were continuously monitored over the course of a test sequence in the warm side chamber and only temperature in the cold side chamber. Measurements of temperature in the chamber were made to an accuracy of ± 0.5 °C and that of relative humidity to ± 1 % RH. The temperature at the weather side was very stable (variation in time below 0.5°C), whereas the room temperature showed to be more sensitive to the heating system of the hotbox (average maximum variation of 1.9°C). However, the interior surface temperatures varied at maximum 0.6°C for the case with the highest variation in room temperature. Moreover, averaged values are used in the analysis, which dampens out the effect of relative instability of the room side temperature. The data were recorded on an acquisition system and then subsequently used to ensure that steady state conditions had been maintained over the course of a test sequence.
Surface temperature conditions on either side of the window and on specified window components (e.g. glazing; frame at sill and at jambs) were continuously monitored with a set of 40 thermocouples: 20 on the exterior and 20 on the interior of the specimen. The location of each of these thermocouples followed CSA A440.2-04 specifications. Thermocouples were also placed within the cavity between the window frame and window opening. Thermocouple temperature measurements were made to an accuracy of ± 0.5 °C.
Values of local “Temperature Index” ( I ) at given points on the window frame and glazing were determined based on relationship (2) given in EN ISO 10211 Standard ( see equation 2).
Tests were carried out under a pressure differential, continuously monitored during the test sequence by a pressure transducer with a 250 Pa range and accuracy of ± 1 Pa. A pressure transducer was used to monitor the pressure in the interstitial space between the window frame and window opening. The amount of airflow due to pressurization during the test was not monitored. The guarded hotbox test facility was calibrated according to the approach described in Elmahdy [1992] and Elmahdy & Bowen [1988]. The film heat transfer coefficient on the room-side and weather-side surfaces was determined from the calibration of the hot box with use of the Calibration Transfer Standard (CTS); the CTS is described in Goss et al. [1991]. For calibration, the CTS was mounted flush with the room-side surface of the surround panel.
The temperature differential for the tests was set at 50°C ± 1.5°C and the temperature sensor measurements were recorded once steady state conditions were achieved following a period of 15 minutes in these conditions (20°C – (–30°C) = 50°C). The humidity on the
warm side chamber was maintained at ca. 10 % RH to ensure that no condensation occurred on any of the interior exposed surfaces of the widow frame. No et al. (2004) showed that significant discrepancies may arise between experimental results and numerical due to condensation in hotbox test measurements. Tests were conducted with pressure differences of 0Pa, 20Pa and 40Pa by evacuating the warm side chamber.
3 RESULTS
3.1 Test set 1 – no insulation
Without a pressure difference across the specimen there was a very uniform temperature distribution over the wall, window frame and glass on the outside (cold side) of the specimen (-28.3°C to -28.7°C). This is consistent throughout all measurements, regardless of pressures and deficiencies. On the outside the air space between the WRB and the hardboard siding blocked any thermal bridging that might have been provided by the wood studs from appearing on the measurements.
As the cavity between the box window and the wood framing is approximately 12 mm wide and 125 mm deep, internal convection within the cavity might induce thermal stratification in the vertical air space. This cavity is essentially open to the cavity between the hardboard siding and the wood stud wall at the sill, and closed at the jambs and the top. At the sill, the gap between the sill and the subsill is about 1.9cm. At the jambs and the top there is a slit of 0mm to 5mm wide. Gustavson (2001) studied flow patterns in different types of window frames experimentally and with computational fluid dynamics. He concluded that cavities with interconnections of less than about 7mm can be treated as separate cavities. This of course is only valid for natural convective effects and where
the influence of forced convection by external pressure gradients has not been taken into account. Based on these data one could assume that in all circumstances there would be a considerable air flow at the bottom, whereas air exchange between the wall-window interface cavity and the cavity behind the hardboard siding is rather unlikely without forced convection.
The horizontal cavity beneath the sill was located at the plane of thermal resistance of the window where the highest thermal gradient from inside to outside is evident, thus intensifying the resulting convection. Any cold air entering into this cavity will gather heat from the inner side of the window frame, and thereafter rise due to its decreasing mass density. However, due to this phenomenon one might expect a similar thermal gradient at the outside of the window - this was not observed. A possible explanation can be found by analyzing the configuration of the window frame. This specific window profile lets the outside chamber of the frame partially act as a geometrical cooling fin, short-circuiting the location of the thermocouple. Furthermore, due to the high heat flux caused by the presence of the insulated glazing unit spacer, the effect of other components on the temperature at the thermocouple is outclassed.
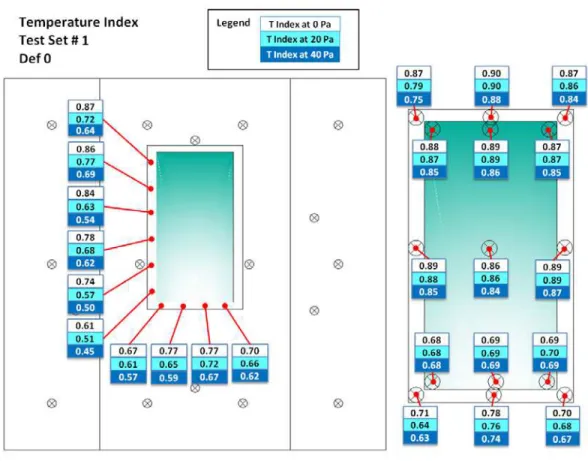
The six thermocouples located in the vertical cavity confirm a strong temperature gradient over its’ height (Figure 2), rising from 0.4°C at the sill to 12.9°C at the top of the cavity. The vertical thermal gradient in the cavity was monitored throughout all measurements and was consistent in nature. However, when compared to the experiments with spray foam insulation in the cavity (please refer to section 3.3), the addition of which eliminates both natural thermal stratification and forced air flow, it seems that a small part of the observed temperature gradient is caused by other effects. The mounting brackets are not
close enough to the thermocouples to affect the measurement and given that this is a fixed window with no hinges or stays, neither of these items can affect results. Only the thermal gradient inside the window frame itself can account for the observed results.
On the inside (warm side) of the specimen the temperature of the wall showed more variation, as could be expected. The temperature on the window frame and the insulated glazing unit (IGU) had a strong thermal gradient; although the temperatures on the middle and upper half of the window ranged from 12.4°C to 14.2°C, temperatures between 3.9°C and 8.6°C were evident near the sill due to stratification of the IGU gas (no stratification was recorded in the rooms).
3.1.1 Effect of pressure differences
In order to analyze the effect of cold air infiltrating into the assembly, a positive pressure of 20 and 40Pa was applied. Due to this unbalance, cold air was drawn into the assembly through small cracks and holes in the different components of the specimen. As there were no wilful deficiencies in this set-up, air could only enter through local imperfections of the wall, window-wall interface or window frame. Figure 2 shows a clear temperature drop on the window frame while the indoor temperature remained the same, and this is most distinct at the upper left and lower left corner of the window. In general, the temperature index dropped between 0.02 and 0.12 (on average 0.04). A temperature drop at that location can be caused by two effects:(i) air running along the perimeter of the window frame can cool the window frame, even causing the glazing stop to cool a few degrees (the thermocouples on the window frame are mounted on the glazing stop); (ii) there might be air leakage through the window frame itself. Leakage through the frame came either from outside directly through the frame to the inside or via the cavity between the window frame and the wood stud wall and thereafter through the window frame to the inside. A detailed analysis with smoke pencils indicated that the interior perimeter of the window frame was tightly sealed with caulking, so air leakage only around the window could not account for these results. By comparing these results with other test sets it was concluded that the window frame itself was quite leaky. In test set 3, SPF was installed in the cavity between the window frame and the wood stud wall. Any cooling effects would then be caused by cold air directly entering through the window from the outside to the inside. A comparison of temperature index drops on the frames showed that direct air leakage through the window frame from outside to inside accounts for about 40% of the
overall temperature drop. That means the remaining 60% in temperature drop would be caused by air coming from the space between the frame and the wall into the frame.
A closer examination of several samples of the window typology used in this study revealed imperfections at the mitre joint of the welded vinyl frame. The mitre joint was chamfered after welding, but in some instances it apparently was cut off, thereby revealing a small opening (slit) at the exterior corners of the window frame. As well it was observed that at the top and bottom side of the window there were minor perforations caused by staples; these staples were used to secure the wood protection strapping in place during transport of windows. It was also evident that there were no weep holes at the bottom side of the window (contrary to good practice). In general the windows were poorly fabricated and several deficiencies were present in the frame specifically at the corners both inside and outside. These deficiencies rendered it possible for cold air to enter the frame from the outside between the window frame and the wood stud wall, and permit air to leave the frame at the interior at joints located at the glazing stops.
The effect of air leakage was most pronounced at the corners, where air could easily penetrate at the glazing stop butt joints. The temperature on the window frame decreased by as much as 4.1°C (5.9°C) at the top side and 3.2°C (3.6°C) at the bottom side of the window frame when 20Pa (40Pa) pressure was applied. Although the pressure difference is doubled, one should take into account the effect of the power law (3):
� = �. ∆�� (3)
With Q: air flow rate [L/s], C: flow coefficient [L/s·Pan], n: flow coefficient [-]. It can reasonably be assumed that the flow exponent of the specific deficiency lies between
0.55 and 0.65 for building applications. Within this range of values for flow coefficient the air flow rate would rise between 46% and 57% upon doubling the pressure difference. Hence, one would not expect that the temperature drop would be linearly related to the pressure difference.
With regard to the condensation potential, the results differ significantly to the tests without pressure difference due to the air flows in the window frame: a temperature index of 0.68 at 0Pa, 0.64 at 20Pa and 0.63 at 40Pa. Note that without pressure difference the edge of the glass pane is the coldest spot and hence the most likely condensation surface, whereas this shifts towards the frame during pressure differences. This may seem a trivial remark, but might have major consequences. Even though condensation should be avoided at all times, it is likely to occur due to specific circumstances, e.g. extremely low outdoor temperatures or high indoor moisture loads. Condensation on the glass itself can be seen very easily by building tenants, who might react by turning up the heat, ventilate more or regularly wipe it dry. If condensation first occurs on the frame, it might not be noticed and the water might get absorbed by adjacent porous finishing components such as wood or gypsum. This could cause staining and deterioration of the materials. The temperatures at the window frame in the cavity between the window and sill are extremely low when a pressure difference is present. The thermocouple at the lower left corner shows 0.4°C at 0Pa, -4.6°C at 20Pa and -7.2°C at 40Pa. This could cause severe problems during a rapid change of air flow direction: a temperature of -7.2°C corresponds to the dew point of 20°C at 16% humidity, so indoor air conditions could easily induce condensation on that surface.
3.1.2 Effect of deficiencies
During the second series of tests two deficiencies were installed: one at the lower right corner on the outside and one on the upper left corner on the inside (when looking from the inside of the window). When no pressure difference is applied, results are nearly identical to the previous test without deficiency.
3.1.3 Effect of deficiencies and pressure differences
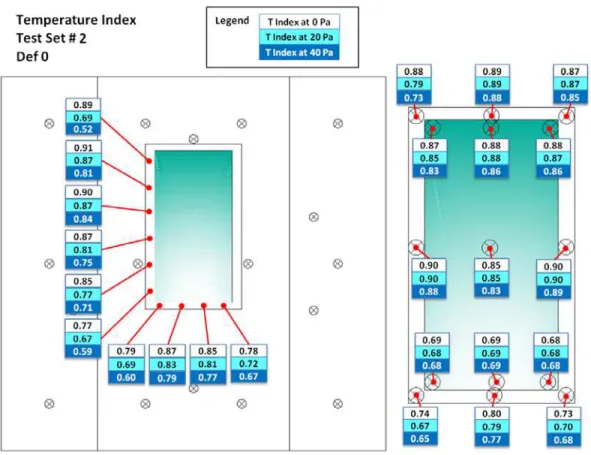
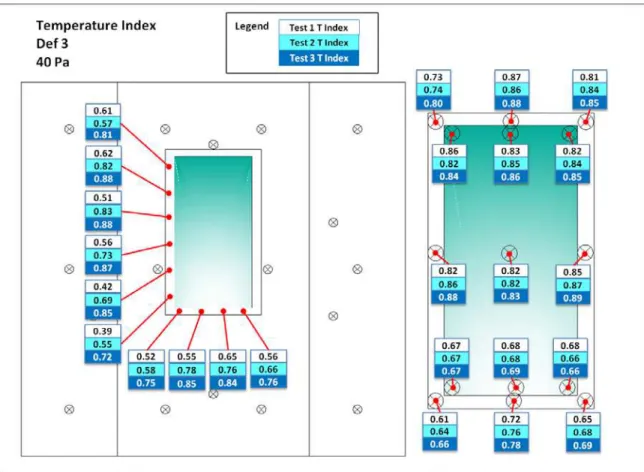
When a pressure difference of 20Pa is applied while deficiencies are present (see Figure 3), the outside surface temperatures remain the same, but the surface temperature of the window profile on the inside is reduced an extra 0.9°C compared to the test without deficiencies (1.3°C for 40Pa). A temperature drop of 1°C corresponds to a drop of 0.02 points in the temperature index (for the given boundary conditions of the test setup). Compared to the test with the open deficiencies but no pressure difference, the upper part of the window cools down by as much as 3.9°C at 20Pa and the lower part 4.1°C. At 40Pa that is 7.2°C and 4.9°C for the upper and lower part of the window respectively. By comparing these results with tests without deficiencies and other test setups, the overall temperature drop of the window frame (averaged results for the whole frame are used to compare general trends) can be likely attributed to three different effects. First of all, about 25% can be traced back to air leakage from outside to inside through the window frame itself (based on the results of the same window when SPF was installed). Secondly, air leakage from the cavity frame-wall accounts for ~37.5% of the temperature drop (by comparison with the setup without deficiencies). Thirdly, another ~37.5% is introduced by the air leakage between the outer deficiency and the inner deficiency. It can
be concluded that about 60% of the temperature drop may have been avoided by installing high grade window frames. In terms of temperature index, the 25% corresponds to a drop of 0.02, and the 37.5% to 0.03. The combined effect is on average a change in temperature index of 0.08 (or 4°C) on the window frame, but as shown in Figure 3 peaks of up to 0.15 occurred depending on the specific location of the air leaks. The most critical reductions in temperature index from 0.69 (on the window pane) to 0.63 at 20 Pa (on the frame) and 0.61 at 40Pa (on the frame). The temperatures in the cavity show a general decrease of 5.9°C at 20 Pa and 10.1°C at 40Pa.
Figure 3. Temperature index at interior side when deficiencies are introduced (no insulation)
3.2 Test set 2 –glass fibre insulation
For this test setup the cavity between the window frame and the rough opening was filled with glass fibre insulation and caulked on the interior side. The surface temperatures on the outer side did not differ from those obtained in the test set-up without insulation (Test
set 1). On the inside, the effect of adding insulation was most pronounced for the surface temperature of the window frame, which was about 0.5°C higher due to the insulation. However, this was not the case for the IGU where the temperature remained roughly the same. The lowest temperature index drops from 0.69 to 0.68 (see figure 4) but this was not a general trend and lies within the error margin. In fact the surface temperature of the glass perimeter was primarily determined by the centre-of-panel R-value of the IGU, the IGU-spacer along the edges, and the removable glazing stop of the window frame. Unless the temperature around the frame is below a certain threshold and the frame has a limited lateral thermal resistance, the effect on the IGU will be negligible. The cavity between window and wood frame itself, now packed with insulation, was on average 4.1°C warmer as compared to the setup without insulation, with peak differences of 7.6°C. It should be noted that there was still a minor thermal gradient present, albeit less pronounced than found earlier. This supports the theory concerning the effect of convection inside the vertical mullions of the window frame. A detailed analysis of the results points out that the calculated thermal gradient was smaller than that observed without insulation, but slightly bigger than the one observed with SPF insulation. This may have been caused by thermal stratification (despite the resistance of the glass fibre insulation), or by an upward air flow caused by a leak. In the latter case, it would also account for a part of the thermal gradient in the setup without insulation. In the horizontal cavity at the sill the temperature was significantly higher than the test without insulation, consistent with the predicted dampening of convection effects by the insulation.
3.2.1 Effect of pressure differences
Both for 20 and 40Pa pressure difference there was no important effect on the outdoor surface temperatures for the wall, for the window frame, and for the IGU. On the indoor side, the effect of pressure differences on window frame temperature was nearly identical to test setup 1. Although the absolute temperatures and temperature indexes were slightly higher due to the insulation, the shift caused by the air flow was the same (see figure 4). In the cavity between the window frame and the wood frame, the temperature drop was considerably lower: on average 3.6°C at 20Pa (instead of 5.9°C) and 7.8°C at 40Pa (instead of 10.1°C). The resistance of the glass fibre insulation to air flow can account for this change in
temperature drop.
3.2.2 Effect of deficiencies
The results of the test with the two deficiencies in the construction are nearly identical to the test without deficiencies. On average the surface temperature of the window frame decreased 0.1°C, and the temperature in the cavity decreased 0.2°C. Although this might be attributed to greater convection in the cavity due to lower air flow resistance, the difference was very small and lies within the magnitude of measurement error.
3.2.3 Effect of deficiencies and pressure differences
While there is no effect on the outside surface temperatures due to pressure difference, a pressure difference has a small effect on the window frame temperatures on the inside. Figure 5 shows the temperature indexes for the case where deficiencies are present and a pressure difference of 40Pa is applied. The results show, from top to bottom, the test without insulation between window frame and wall, with mineral fibre insulation and SPF respectively. Without insulation, there was an additional temperature drop of 1.5°C on the interior side of the window frame compared to the same test without deficiencies. With the glass fibre insulation the additional effect of the deficiencies was negligible. While the presence and type of insulation had no effect on the temperature drop due to a pressure difference without deficiencies, it had a clear effect when the deficiencies are in fact present. This supports the theory that the overall temperature drop described above was caused by air leakage in the window frame itself, and not by air leakage in the cavity.
Figure 5. Temperature indexes at 40Pa with deficiencies for the different test sets.
Figure 5 shows the temperature indexes on the inside of the window, which shows that glass fibre insulation has a positive effect. The low value at the top left corner of the window frame might be attributable to minor deficiencies in the caulking, measurement accuracy or rounding. The effect on the temperature index at the interior surface is a little over 0.01, consistent with the 0.5°C increase due to the insulation (recorded in the case without pressure differences and without deficiencies). The lowest temperature index achieved at a pressure difference of 40Pa was 0.64, only slightly higher than the situation without insulation. Due to the thermal stratification of the gas in the IGU, the lowest temperature indexes can be found at the sill; hence, it is evident that the insulation will not have a major effect on results at this location.
3.3 Test set 3 – SPF (Spray-in-place polyurethane foam)
The application of SPF inside the cavity should prevent any convection from occurring. The surface temperatures of both the window frame as the IGU are similar to the case with glass fibre insulation. However, the lower right corner of the glass pane was almost 1°C colder than the setup without insulation. At the sill, SPF was installed, so similar results would be expected for the two cases with insulation (see Fig. 5). Contrary to expectations, the most critical surface temperature on the glass drops on one single point when insulation is installed in the cavity. However, the temperatures measured inside the cavity at the sill rose due to the installation of SPF because thermal stratification is prevented. Analysis of IR-pictures did not offer any explanation of the divergent results at the sill, the divergence of this anomalous value is equal to the maximum measurement error. The tests on samples with deficiencies but without pressure difference are identical to the tests without the deficiencies – similar to test set 2 with glass fibre wool insulation.
3.3.1 Effect of deficiencies and pressure differences
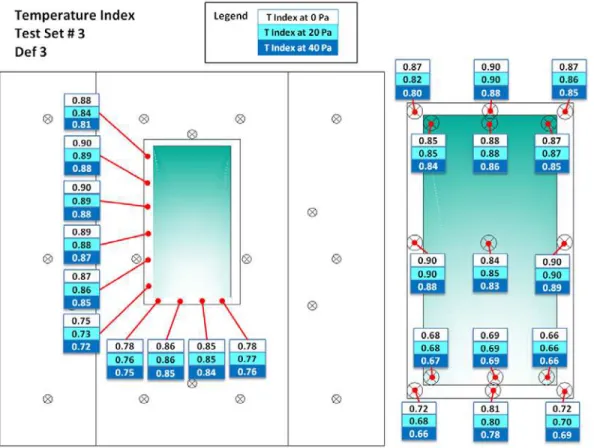
Although there may be no convection in the wall-window interface cavity, a pressure difference of 20Pa results in a reduction in the surface temperature of the window frame, by 0.8°C on average, and 1.0°C for 40Pa (without insulation this was 1.6°C and 3.5°C respectively). Again, in absence of thermal effects in the cavity around the window, the cause of the reduction in temperature lies within the window frame itself. Only deficiencies in the window can permit an airflow that affects the surface temperature at that location. The temperature drop is very similar to the case with glass fibre insulation. The lowest temperature index for the SPF test is 0.66 for pressure differences of 0Pa, 20Pa and
40Pa (figure 6). Deficiencies caused no change in the temperature profile with or without pressure difference. The SPF blocked any possible air flow around the cavity; hence pressure differences have no influence on the surface temperatures.
Figure 6. Temperature indexes at interior side with pressure differences (SPF).
4 CONDENSATION RISK ASSESSMENT
A comprehensive methodology to calculate surface condensation is presented in EN ISO 13788:2001. However, the standard was developed to evaluate the risk for mould growth on the interior surface of building components and interstitial condensation, and consequently it is advised to use monthly mean values as boundary condition. Monthly values are typically used for risk evaluation of surface mould growth, because it integrates – to a certain extent – the required exposure time to a set of boundary conditions to initiate mould germination. Surface condensation on window frames is a phenomenon that happens instantaneous, and is not
related to long-term preconditioning. Consequently, this standard needs a number of adjustments in order to apply the general methodology to window condensation risk analysis. Next to that, we can differentiate between two separate approaches of the problem: either condensation is simple not tolerated, or condensation is only allowed to a limited extent.
The first approach with a strict criterion renders an easy evaluation method: the mean annual minimum temperature on an hourly basis should be used for condensation risk assessment on windows. Even then, this should only be considered as a guideline, and condensation may still occur in a number of cases, due to e.g. local high relative humidity, insufficient ventilation rates, shielding from radiation, etcetera. The external surface resistance should be set to 0.04 m².K/W, whereas the interior surface resistance should be fixed to 0.13 m².K/W for glazing and window frames. For the interior boundary conditions, two options are at hand: first of all, it is possible that information on relative humidity and temperature in the building are available. However, in the case of e.g. the refurbishment of an existing building, it is very plausible that the interior boundary conditions will change due to the refurbishment (Brown, 1997). If no other information is available, an estimation of the hygrothermal conditions of the future building is necessary: annex A of EN ISO 13788:2001 offers an estimation of vapor pressures for different building functions and corresponding humidity classes, depending on the exterior temperature. Note that the values in the annex were derived from buildings in Western Europe. Furthermore, the standard advises to introduce a safety factor of 1.10 to the interior vapor pressure for condensation risk assessment.
Consequently, the condensation risk can be calculated as follows:
1) Selection of the exterior mean annual minimum temperature on a hourly basis
2) Selection of interior temperature and humidity class, and corresponding vapor pressure (a safety factor of 1.10 should be applied to the vapor pressure).
3) The saturation vapor pressure can be calculated for the interior temperature using equation 3.
4) Dividing the absolute vapor pressure from step 2 by the saturation pressure from step 3 offers the indoor relative humidity.
5) Equations 5 and 6 can be used to calculate at which temperature the vapor pressure from step 2 will become saturated. Consequently, the surface temperature of building components should remain above that temperature to avoid surface condensation.
6) Based on the exterior temperature (step 1), interior temperature (step 2) and the interior surface temperature when condensation might occur (step 5), the minimum temperature index can be calculated according to equation 2.
7) The lowest local temperature index on a window (combination of IGU, spacer and window frame), should be above the minimum temperature index specified in step 6.
The standard does not take into account the effect of air flows around a window frame due to pressure differences. The results of section 4 in this paper indicate that the effect of deficiencies – in absence of a pressure difference – is negligible. The effect of insulation in the cavity between the window frame and the wall is a difference in temperature index of 0.03 for fiber insulation and 0.02 for SPF compared to the empty space, when no pressure differences are applied. However, in the installation without deficiencies, the minimum temperature index drops 0.05 at 20Pa and 0.05 at 40Pa. When fiber insulation is installed, the difference is 0.04 and 0.06, and for SPF insulation the effect is 0.02 and 0.03 respectively. With deficiencies in the installation, the temperature index drops 0.04 and 0.07 at 20 and 40 Pa for the situation without insulation in the cavity. For the installation with fiber insulation, the minimum temperature index dropped 0.04 and 0.07 at 20 and 40Pa pressure difference, similar to the previous setup. SPF on the other, does have a significant effect: at 20 and 40Pa the temperature index dropped 0.02 and 0.04 respectively. This indicates that the methodology presented above is erroneous once pressure difference are applied over the construction. Research by Cornick (2008) indicates that pressure differences up to 40Pa over a building component can be expected in cold climates,
considering both wind pressure as thermal stratification. Consequently, a reliable risk assessment should take into account the changes in temperature index reported in this section.
This methodology thus offers a calculation algorithm to define a temperature index for the case when no condensation is allowed at all. However, practice shows that this absolute criterion is not always feasible, or would introduce very high additional costs. In order to assess the actual risk with a limited number of hours that condensation is allowed, statistical information is required on the cumulative distribution of outdoor temperatures, related to the corresponding indoor relative humidity and indoor temperature. By calculating the minimum temperature index for every single hour throughout a whole year (using statistical representative data), a distribution function of the temperature index would become available, which allows to assess the actual condensation risk and renders the number of hours that interior surface condensation on the window can be expected.
The condensation risk will depend on the type of wall, window, IGU and spacer on one side, and on the specific interior and exterior boundary conditions related to the exterior climate, and type and use of the building. Consequently, guidelines can only be calculated for specific climates, buildings and construction methods. The results of this research project evidently cannot be extrapolated to every situation, but indicates that the effect of convection in the window-wall interface is very significant, and omitting this phenomenon might underestimate the actual risk on interior condensation.
5 CONCLUSIONS
The following observations and analysis were made on experimental results for window-wall interfaces installed with box windows:
The exterior side of the configuration is not sensitive to thermal effects induced by air leakage to the inside. As a result the use of IR-scans may not be useful for air leakage detection from the outside for this type of construction.
The temperatures on the insulated glazing unit show a significant vertical thermal gradient, and the spacer around the perimeter acts as an additional thermal bridge causing low surface temperatures in all configurations. However, the IGU is not very sensitive to the changes occurring inside the cavity between the window frame and the rough opening: the effect was limited to about 1°C and was likely caused by imperfections in the window frame.
The box window used in the measurements was – although typical for North-American construction practice - of lesser quality, as several cracks and deficiencies in the window frame, in certain instances, directly affected results. Even for the installation with SPF without deficiencies it was observed that the surface temperature on the window profile dropped 1°C, possibly caused by insufficient airtightness of the window frame.
There are significant differences between trends in mean values and extreme values. Very local effects and deficiencies may have an important effect and will determine the primary location for surface condensation.
By insulating the cavity between window frame and wall, the temperature index increases about 0.02 compared to an empty cavity. Pressure differences introduce significant reductions in temperature indexes (between 0.02 and 0.07), which are partially omitted by installing insulation.
As the window installation was tested under severe circumstances (50°C and 40Pa difference between interior and exterior climate), the overall effect of air flows is rather
limited, and the bulk of it is likely caused by deficiencies in the window frame itself. However, these results are only valid for the vinyl frame used in this study.
Convective air transport around the window was partly retarded by the installation of glass fibre insulation. Only the use of spray foam insulation provided a seal to the perimeter thereby avoiding cooling of the window profile.
When conducting a condensation risk assessment according to EN ISO 13788:2001, a number of changes in the methodology are suggested in order to apply the algorithm to window frames, and an additional safety factor is introduced for the minimum temperature index, depending on the type of window-wall interface.
A parallel research project focuses on flanged window frames. Based on the analysis of both the box windows as flanged windows design guidelines will be developed. Although local effects dominate the results, the data can be used to validate dynamic computer simulations, in order to analyse similar effect on other combinations of window frames, IGUs and spacers. Ultimately it is expected that the information developed from these tests and simulations will provide guidance to window manufacturers, window installers and knowledgeable practitioners on the thermal performance of differing window installation methods.
6 ACKNOWLEDGEMENTS
The authors wish to thank the Canada Mortgage and Housing Corporation for partial funding of the project and acknowledge the contributions of Mr. Silvio Plescia, Senior Researcher, Canada Mortgage and Housing Corporation to this paper.
REFERENCES
AAMA 1972. Voluntary Test Method for Condensation Resistance of Windows, Doors and Glazed
Window Sections. Publication No. AAMA 1502.3-1972, Architectural Aluminium
Manufacturers Association.
AAMA 1998. Voluntary Test Method for Thermal Transmittance and Condensation Resistance of
Windows, Doors and Glazed Wall Sections. Publication No. AAMA 1503-98, Architectural
Aluminium Manufacturers Association
Abodahab N., Muneer T., 1998. Free convection analysis of a window cavity and its longitudinal temperature profile. Energy conversion management. Vol. 39, No 3/4: pp257-267.
Arasteh D., 1991. An analysis of edge heat transfer in residential windows. Journal of Building
Physics. Vol. 14: 295-310.
ASTM 2000. ASTM C1199-00 Standard Test Method for Measuring the Steady-State Thermal
Transmittance of Fenestration Systems Using Hot Box Methods. ASTM Book of Standards,
Vol. 04.06, ASTM Publications, PA, USA.
Becker R., 1993. Effects of heating patterns on internal surface temperatures and risk of condensation. Building and Environment. Vol. 28, No 3: 333-345.
Bong T.Y., Xue H., Liew H.C., 1998. Predicting window condensation potential for a large viewing gallery. Building and Environment. Vol. 33, No. 2/3: 143-150.
Bowen R.P. 1985. DBR's Approach for Determining the Heat Transmission Characteristics of
Windows, Building Research Note, 234, 12 p.
Brown W.P., Solvason K. R., and Wilson A.G. 1961. A unique hot-box cold-room facility.
ASHRAE Transactions, Vol. 67, pp. 561-577.
Brown W.C., 1997. Window condensation in historic buildings that heva been adapted for new uses. Construction technology update. No 5. Institute for Research in Construction. National Research Council of Canada.
CSA 2004. Energy performance of windows and other fenestration systems/User guide to CSA A440.2-04. Canadian Standards Association, Mississauga, Canada, 142 p.
Cornick, S.M., 2008. Task 5: Proposed Test Protocol for Walls of Houses in Extreme Cold Regions. Part 1: Defining Exterior Conditions, pp. 47, (B-1239.5)
Duer K., Svendsen S., Mogensen M.M., Laustsen J.B., 2002. Energy labelling of glazings and windows in Denmark: calculated and measured values. Solar Energy. Vol. 73, No. 1: 23-31. Elmahdy, A.H. 1992. Heat transmission and R-value of fenestration systems using IRC hot box :
procedure and uncertainty analysis, ASHRAE Transactions, 98 (2): pp. 630-637;
Elmahdy, A.H., Bowen, R.P. 1988. Laboratory determination of the thermal resistance of glazing units, ASHRAE Transactions 94 (2): pp. 1301-1316
Elmahdy, A.H. 1990. A Universal approach to laboratory assessment of the condensation potential of windows, Sustainable Energy Choices for the 90's : 16th Annual Conference of the Solar Energy Society of Canada, Halifax, N.S., Canada, pp. 165-173.
Elmahdy A.H., 2003. Effects of improved spacer bar design on window performance. Construction
technology update. No 58. Institute for Research in Construction, National Research Council of
Canada.
Elma hdy A.H., Frank, T., 1993. Heat transfer at the edge of sealed insulating glass units: comparison of hotbox measurements with finite-difference modeling. Ashrae Transactions – Symposia: 915-922.
EN ISO 13788: 2001. Hygrothermal performance of building components and building elements – Internal surface temperature to avoid critical surface humidity and interstitial condensation – Calculation methods. CEN, Brussels, Belgium.
Goss, W.P.; Elmahdy, A.H.; Bowen, R.P., 1991, Calibration transfer standards for fenestration systems, In-situ Heat Flux Measurements in Buildings : Applications and Interpretation of
Results : Proceedings, S.N. Flanders Ed.; U.S. Army Cold Regions Research and Engineering Laboratory. Special report, SR 91-03, p.251-260.
Gustavson A., Griffith B.T., Arasteh D., 2001. Three-Dimensional Conjugate Computational Fluid Dynamics Simulations of Internal Window Frame Cavities Validated Using Infrared Thermography, ASHRAE Transactions 2001, Vol. 107, Pt 2.
Gustavson A., Thue J.V., 2007. Numerical simulation of natural convection in three-dimensional cavities with a high vertical aspect ratio and a low horizontal aspect ratio. Journal of Building
Physics. Vol. 30, No 3: 217-240.
Gustavson A., Arasteh D., Petter Jelle B., CurcijaC., Kohler C., 2008. Developing low-conductance window frames: capabilities and limitations of current window heat transfer design tools – state-of-the-art review. Journal of Building Physics. Vol 32, No 2.
Lacasse M.A., Manning M.M., Rousseau M.Z., Cornick S.M., Plescia S., Nicholls M., Nunes S.C. 2007. Results on assessing the effectiveness of wall-window interface details to manage
rainwater. 11th Canadian Building Science and Technology Conference, Banff, Canada. pp.
1-14.
Larsson U., Moshfegh B., Sandberg M., 1999. Thermal analysis of super insulated windows (numerical and experimental investigations). Energy and Buildings. Vol. 29: 121-128.
Liu J., Aizawa H., Yoshino H., 2004. CFD prediction of surface condensation on walls and its experimental validation. Building and Environment. Vol. 39: 905-911.
Maref W., Van Den Bossche N., Armstrong M., Lacasse M.A., Elmahdy H. and Glazer R. 2010.
Laboratory Tests of Window-Wall Interface Details to Evaluate the Risk of Condensation on Windows, submitted to: ASTM Symposium on Condensation in Exterior Building Wall
Systems, October 2010, San Antonio, US.
Moshfegh B., Loyd D., Karlsson B., 1989. Heat transfer at modern windows – risk of condensation. Energy and Buildings. Vol. 13: 119-125.
Muneer T., Abodahab N. 1998. Frequency of condensation occurence on double-glazing in the United Kingdom. Energy Conversion Management Vol 39, No 8, pp717-726.
No S.T., Kim K.S., Jung J.S., 2008. Simulation and mock-up tests of the thermal performance of curtain walls. Energy and Buildings. Vol. 40: 1135-1144.
Proskiw G., 1994. Air leakage characteristics of various rough-opening sealing methods for windows and doors. Energy Technology Branch. CANMET – energy sector. Department of Natural Resources Canada, Ottawa, Canada.
Sasaki, J.R. 1971. Developing a standard test for window condensation performance. Materials
Research and Standards, 11 (10), pp. 17-20.
Shapiro M.M., Diasty R.E., Fazio P., 1987. Transient three-dimensional window thermal effects.
Energy and Buildings. Vol. 10: 89-98.
Song S.Y., Jo J.H., Yeo M.S., Kim Y.D., Song K.D., 2007. Evaluation of inside surface condensation in double glazing window system with insulation spacer: a case study of residential complex. Building and Environment. Vol. 42: 940-950.