Publisher’s version / Version de l'éditeur:
Journal of Applied Physics, 105, 9, pp. 094310-1-094310-7, 2009-05
READ THESE TERMS AND CONDITIONS CAREFULLY BEFORE USING THIS WEBSITE. https://nrc-publications.canada.ca/eng/copyright
Vous avez des questions? Nous pouvons vous aider. Pour communiquer directement avec un auteur, consultez la première page de la revue dans laquelle son article a été publié afin de trouver ses coordonnées. Si vous n’arrivez pas à les repérer, communiquez avec nous à PublicationsArchive-ArchivesPublications@nrc-cnrc.gc.ca.
Questions? Contact the NRC Publications Archive team at
PublicationsArchive-ArchivesPublications@nrc-cnrc.gc.ca. If you wish to email the authors directly, please see the first page of the publication for their contact information.
NRC Publications Archive
Archives des publications du CNRC
This publication could be one of several versions: author’s original, accepted manuscript or the publisher’s version. / La version de cette publication peut être l’une des suivantes : la version prépublication de l’auteur, la version acceptée du manuscrit ou la version de l’éditeur.
For the publisher’s version, please access the DOI link below./ Pour consulter la version de l’éditeur, utilisez le lien DOI ci-dessous.
https://doi.org/10.1063/1.3122052
Access and use of this website and the material on it are subject to the Terms and Conditions set forth at
Observation of surface enhanced IR absorption coefficient in
alkanethiol based self-assembled monolayers on GaAs(001)
Marshall, Gregory M.; Bensebaa, Farid; Dubowski, Jan J.
https://publications-cnrc.canada.ca/fra/droits
L’accès à ce site Web et l’utilisation de son contenu sont assujettis aux conditions présentées dans le site LISEZ CES CONDITIONS ATTENTIVEMENT AVANT D’UTILISER CE SITE WEB.
NRC Publications Record / Notice d'Archives des publications de CNRC:
https://nrc-publications.canada.ca/eng/view/object/?id=7cf59c10-94fc-4a6b-8f05-8a2bb09d2d60 https://publications-cnrc.canada.ca/fra/voir/objet/?id=7cf59c10-94fc-4a6b-8f05-8a2bb09d2d60Observation of surface enhanced IR absorption coefficient in alkanethiol
based self-assembled monolayers on GaAs„001…
Gregory M. Marshall,1,2Farid Bensebaa,2and Jan J. Dubowski1,a兲
1
Department of Electrical and Computer Engineering, Université de Sherbrooke, Sherbrooke, Québec J1K 2R1, Canada
2
Institute for Chemical Process and Environmental Technology, National Research Council of Canada, Ottawa, Ontario K1A 0R6, Canada
共Received 15 October 2008; accepted 24 March 2009; published online 4 May 2009兲
Alkanethiol self-assembled monolayers 共SAMs兲 of various methylene group chain lengths 关HS– 共CH2兲n– CH3兴 共n = 9 , 11, 13, 15, 17兲 were fabricated on the GaAs共001兲 surface followed by characterization using Fourier transform infrared spectroscopy. Modal analysis of the CH2stretching mode region共2800– 3000 cm−1兲 showed that linear scaling of the n-dependent factors accurately reproduced the spectral data, supporting a chain-length consistent physical model upon which a measurement of the absorption coefficient was based. Evaluated from the linearity of the absorbance data, a peak coefficient of 3.5⫻ 104 cm−1was obtained and a domain for ordered self-assembly was assigned for values n ⬎ 9. Compared with measurements of the absorption coefficient made in the liquid phase, the SAM phase coefficient was determined to be about six times greater. This enhancement effect is discussed in terms of contributions relating to the locally ordered environment and is largely attributed to the chemical properties of the interface. We believe this to be the first demonstration of IR spectral enhancement of a molecular species chemisorbed on the semiconductor surface. © 2009 American Institute of Physics.关DOI:10.1063/1.3122052兴
I. INTRODUCTION
The development of surface-molecule interface technol-ogy often depends on the effective control and characteriza-tion of self-assembly processes at interfaces where nanoscale effects may be exploited. Long-chain alkanethiol self-assembled monolayers 共SAMs兲 on GaAs共001兲 have been studied in this context by a number of authors, both from the perspective of fundamental material science1–10and as a po-tential route to applications including surface passivation,11 metal-molecule-semiconductor junctions,12,13 the assembly of DNA hybridization probes,14 and the immobilization of functional proteins such as avidin.15In these studies, Fourier transform infrared 共FTIR兲 spectroscopy is frequently em-ployed to investigate important SAM structural parameters such as molecular orientation16and the fraction of conforma-tional defects.17,18
In an effort to further explore the nature of this material system, particularly with a view to developing benchmarks against which more complex functional interfaces may be compared, this paper investigates the absorption coefficient characteristics of alkanethiol SAMs prepared on the GaAs共001兲 surface. The absorption coefficient, typically de-rived from bulk phase Beer–Lambert measurements, may be used to determine other parameters of interest. For example, it may be cast in terms of the molar absorption 共M−1cm−1兲 yielding the molar surface density 共mol cm−2兲.19,20
The complex optical dispersion properties of the SAM can also be approximated from bulk state absorption measurements using the Kramers–Kronig transformation,20,21and have been
used to develop calculated SAM vibrational spectra.18,21,22 The accuracy of such formulations depends on a correspon-dence from the bulk to the SAM phase that may not always be direct.18,23 Consequently, we are motivated toward mak-ing a surface measurement of the absorption coefficient di-rectly from the SAM phase.
Our analysis concerns the IR absorption characteristics of the CH2 stretching mode region 共2800– 3000 cm−1兲 for various chain-length n-alkanethiol 关HS– 共CH2兲n– CH3兴 SAMs on semi-insulating 共SI兲 GaAs共001兲. From transmis-sion measurements, the absorption coefficient of the SAM phase is derived from the absorption amplitude linearized as a function of molecular chain length. Corresponding Beer– Lambert measurements made in the molecular liquid phase are then used for means of comparison. Note that SI-GaAs is well suited for transmission IR measurements of the SAM phase; because of their high extinction, doped GaAs or Si and Au substrates can only support grazing-angle reflection IR measurements, making absorption length evaluation more difficult. In this context, our results have relevance in the generalized domain of alkyl-SAMs prepared on a variety of substrates. The analysis continues with a discussion of the structural factors that contribute to the observed differences between liquid and SAM phase absorption coefficients. In addition, the absorption enhancement from possible surface and intermolecular effects is considered.
II. EXPERIMENTAL DETAILS
SI-GaAs共001兲 wafers were cleaned using 5 min sonica-tion in each of Opticlear™, acetone, and isopropanol共IPA兲. Alkanethiol solutions in degassed ethanol were prepared at 2–3 mM concentration from each of the following:
octade-a兲Electronic mail: jan.j.dubowski@usherbrooke.ca. Tel.: 共819兲 821-8000. FAX:共819兲 821-7937.
canethiol 共n17兲, hexadecanethiol 共n15兲, tetradecanethiol 共n13兲, dodecanethiol 共n11兲, and decanethiol 共n9兲, where the decade prefix refers to n + 1 carbon atoms per molecule, ac-counting for the terminal CH3 group. In addition, 50–100 mM of 28% NH4OH/ H2O was added to each solution, ac-cording to sample preparation procedures described by McGuiness et al.7The GaAs wafers were then wet etched in 28% NH4OH/ H2O for 2 min in order to remove surface oxides7,24,25 followed by direct rinsing in degassed ethanol and subsequent immersion in the prepared solutions for 20 h. Following SAM-GaAs incubation, the samples were rinsed in IPA and dried in a nitrogen stream.26
Liquid phase samples of n9, n11, and n13 were prepared by wetting the neat liquid between two thin共150 m兲 cov-erglass slides.27 The thickness of the resulting liquid sand-wich layer was measured共⫾1 m兲 by through-focus 200⫻ optical microscopy 共Leica DM-RXE兲, making use of small area voids around the layer, such that the interior surface features of the respective coverglass slides were resolved. The corresponding z-position readings were recorded from a digital translation stage and subtracted. Sample preparation ensured that a suitable void-free area was available for FTIR measurements.
Mid-IR spectra were recorded in transmission using a Bruker Optics Hyperion 2000 FTIR-microscope coupled to a Bruker Optics Tensor 27 spectrometer. The probing spot size was approximately 2 mm in diameter, the spectral resolution was set at 4 cm−1, and continuous nitrogen purging of the sample glovebox was used. Spectra were recorded for freshly prepared samples, baselined through an etched GaAs refer-ence wafer共incubated in ethanol as the control兲 such that the resulting difference spectrum revealed features specific to the SAM only. At least 3 min scanning time was required to achieve a good signal-to-noise ratio.
III. SPECTRUM MODAL ANALYSIS
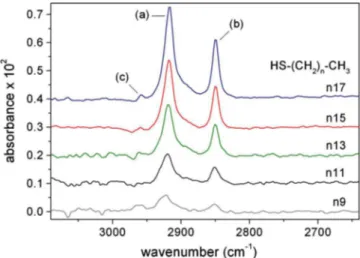
Differential FTIR spectra for n17, n15, n13, n11, and n9 SAMs are provided in Fig.1. Linear baseline subtraction and vertical spectrum shifts have been applied. Identifying char-acteristics are the CH2 stretching mode peaks, located in the following ranges: 共a兲 2917– 2921 cm−1 共asymmetric mode兲 and共b兲 2850– 2851 cm−1 共symmetric mode兲. Also visible is the CH3 stretching mode at共c兲 associated with the terminal methyl group near 2959 cm−1. In general terms, peak fre-quencies are expected to shift to higher energy values corre-sponding to the fraction of gauche defects where smaller chain lengths are used.9,17,18 Note that an asymmetric mode peak frequency near 2917 cm−1 has been measured in the alkyl polycrystalline state,18,21and is often cited as a bench-mark indicator of the all-trans conformation.7,9,12 Peak widths will also increase to reflect an increased distribution of conformational states.17,18
More specifically, one must consider that the spectral envelope consists of several modal contributions, the ampli-tudes of which for some are not directly related to the num-ber of backbone methylene groups. For example, there are Fermi resonance modes and those modes associated with next-to-endgroup vibrations.18,21An example of the latter is
located near 2924 cm−1 and corresponds to the asymmetric CH2 vibration adjacent to sulfur.28 The distribution of these modes contributes to the apparent position of normal mode peak frequencies that for lower values of n weigh more sig-nificantly. Consequently, we will consider the asymmetric mode peak amplitude as a generalized feature of the SAM independent of its precise frequency, with the implicit obser-vation that the spectral envelope contains within it certain constant factors independent of n.
In order to justify this assertion, the correspondence of mode distribution with envelope peak position and amplitude was studied in detail. Using similar peak assignments and a 60/40 Gaussian–Lorentzian line shape mixing ratio as adopted by Parikh and Allara21for the polycrystalline alkane C19H39CO2Na, an analytical representation of the CH2band was developed and fitted to the spectrum of n17-SAM in the manner described in their report. The component assign-ments are listed in Table Iand the resulting spectrum fit is illustrated in Fig. 2 共top left panel兲. The model was set to scale with an arbitrary factor 共s兲 parametrized according to the intensity of n-dependent components, leaving the end-group associated elements fixed in amplitude共see mode des-ignations in Table I兲. Under this first-order assumption, the remaining spectral envelopes were fitted by varying the s-factor, the exception being the n9 spectrum owing to a loss of fidelity. The results from the analysis of the n15, n13, and n11 spectra are shown in the remaining panels of Fig. 2. Agreement is good for the CH2 asymmetric and symmetric modes, but, for example, the CH3 mode intensity near 2959 cm−1 does not conform well to the applied model, es-pecially as the value of n decreases, because of the initial-ization of conformational defects that first tend to form at the chain ends.17,18,29
The spectrum model may now be used to evaluate the wavenumber position of the generalized asymmetric peak as a function of the scale factor s. This calculation is shown in Fig. 3 along with the data points corresponding to the real asymmetric peak positions at their respective s-values from
FIG. 1. 共Color online兲 Transmission FTIR spectra of n-alkanethiol 关HS– 共CH2兲n– CH3兴 SAMs on GaAs共001兲: octadecanethiol 共n17兲, hexade-canethiol 共n15兲, tetradecanethiol 共n13兲, dodecanethiol 共n11兲, and de-canethiol共n9兲. CH2stretching modes: asymmetric共a兲, symmetric 共b兲, and CH3stretching modes共c兲. Spectra are differential, baselined with an etched GaAs reference substrate.
the component fit. Note that in the limit of large s, the peak position is asymptotic with 2917 cm−1, i.e., the position as-sociated with the n-dependent CH2 asymmetric stretching mode. For small s, the peak position approaches the value of 2924 cm−1associated with the fixed amplitude component at that position. Deviation of the data points above the analyti-cal curve is observed to increase as the chain length shortens, corresponding to the onset of chain-end gauche defects as previously cited. The position of n9 is estimated but is ex-pected to correspond to the frequency limit determined by the dominant 2924 cm−1 mode for small s-values. Note the
actual defect fraction responsible for frequency deviations ⬃1 cm−1 is less than a few percent.17,29
Therefore, Fig. 3
indicates that our spectral data and its analytical representa-tion are reasonably self-consistent in terms of amplitude and peak position, validating the component assignments with respect to a near-crystalline phase model for values n ⱖ 11.
Two important conclusions fall out from this discussion. The first is that the validity of n-dependent component scal-ing supports the physical model upon which the absorption coefficient is based, i.e., that of a uniformly dense SAM changing by molecular length. The second is that generalized
TABLE I. Assignment of C–H modal parameters共adapted from Refs.21 and 28兲 and scaling indicator for the spectral components of 关HS– 共CH2兲n– CH3兴 SAMs on GaAs共001兲. Mode descriptiona Position 共cm−1兲 FWHM 共cm−1兲 Scalingb CH3, asym str共ip兲 2959 6 f CH3, asym str共op兲 2955 6 f CH3, sym str共FR兲 2932 22 s CH2, asym str共␣兲 2924 13 f CH2, asym str 2917 12 s CH2, sym str共FR兲 2902 25 s CH2, sym str共FR兲 2889 16 s CH3, sym str 2876 10 f CH2, sym str共␣兲 2862 12 f CH2, sym str共兲 2854 9 f CH2, sym str 2850 10 s aAbbreviations: ip-in plane共CCC兲, op-out of plane 共CCC兲, FR-Fermi reso-nance, asym-asymmetric, sym-symmetric, str-stretching,␣-CH2group adja-cent to sulfur, and-CH2group adjacent to␣.
bRefers to fixed共f兲 or n-dependent 共s兲 amplitude in the scaling model.
FIG. 2. 共Color online兲 Component analysis of FTIR spectra. Data 共circles兲 and component fit 共lines兲 using fixed and n-dependent C–H stretching mode assignments referenced by peak position in cm−1: 2959共navy兲, 2955 共orange兲, 2932 共violet兲, 2924 共red兲, 2917 共blue兲, 2902 共olive兲, 2889 共gray兲, 2876 共magenta兲, 2862 共dark cyan兲, 2854 共wine兲, and 2850 共dark yellow兲. See TableIfor details.
FIG. 3.共Color online兲 CH2asymmetric mode peak frequency as a function of the modal analysis scale factor; continuous model共line兲 and component fit results共circles兲 illustrating the correspondence of amplitude and peak position in the n-scaling model. Fitting of the n9 spectrum was not possible within the model and its position is estimated only.
comments about the quality of the SAM, in terms of the fraction of conformational defects, should not hinge upon the asymmetric peak position in its entirety, at least not for com-parison between SAMs of two different molecular lengths.
As an aside, it should be mentioned that our SAMs were incubated on both the front and back sides of polished wa-fers. Therefore, the absorbance magnitudes scale by a factor of 2 when measured in transmission, increasing the signal-to-noise ratio. This was confirmed by an experiment where only one side of a wafer was etched before incubating in n17. The resulting peak amplitude was reduced by a factor of 2 as expected, since the SAM will not form on the oxidized surface.
IV. STRUCTURAL THRESHOLD AND ABSORPTION COEFFICIENTS
The asymmetric peak amplitude as a function of the me-thylene group number n is plotted in Fig.4. The linearity of the data is immediately apparent and is consistent with the physical model prefaced in Sec. III. Also shown in Fig.4is the amplitude n-scaling model parametrized by the scale fac-tor s to a linear mapping of n共s兲 between n11 and n17. Agreement is excellent, and moreover, extrapolation of the model to s ⬍ 0 共between n = 9 and n = 10兲 simulates the loss of SAM integrity and predicts a trend consistent with the position of the n9 data. Consequently, we are justified in adopting the values n ⬎ 9 in defining a structural regime of well ordered self-assembly.
Using ellipsometric and angle-resolved x-ray photoelec-tron spectroscopy 共XPS兲 data, an earlier report4
suggested a SAM threshold in the vicinity of n = 13. Sample preparation techniques, which the present study employs, have recently been improved by McGuiness et al.7 Characteristic of this improvement is a significant decrease in molecular tilt from 57° to 14° for n17.7Corroborating results have been reported for SAMs with chain lengths ranging from n11 to n17.13The linearity of the data in Fig. 4 confirms that the expected
increase in molecular packing and chain overlap afforded by a lower value of molecular tilt enables better structural co-herence at shorter chain lengths than was previously re-ported.
Having justified the validity of the physical model, the linearity of absorbance with SAM molecular length enables the absorption coefficient to be derived. Taking a slope of 3.7⫻ 10−4 absorbance units per unit n from Fig. 4, normal-izing by 1.54 sin 55° Å, which is the C–C bond length共per CH2 unit兲 projection along the molecular axis, multiplying by 1 / cos共14°兲 to account for the assumed molecular axis tilt, and considering the aforementioned 2⫻ multiplier, the coef-ficient value thus obtained is ␣SAM= 3.5⫻ 104 cm−1. It should be noted that our value of ␣SAMcorresponds to the maximum point in the CH2 stretching mode region. A fre-quency spectrum of the absorption coefficient ␣共兲 could easily be constructed by normalization of the CH2 spectral maximum to the␣SAMvalue.
Note that recent work by McGuiness et al.9has reported some loss of SAM coverage and organization for values of n⬍ 15 in this material system. Our present results are con-sistent with their comments in terms of structural organiza-tion, having observed a similar increase in gauche defects at lower n-values as discussed above. Additionally, the loss of coverage with decreasing n-value they reported共up to 12% for n11兲 may be superimposed on our data, but in a slowly varying manner beyond the sensitivity of our method. Owing to the slope error such a case would impart, it is possible that the␣SAMvalue may be overestimated by up to 5%.
In order to compare␣SAMto the bulk state, liquid phase Beer–Lambert measurements were carried out to explicitly determine the respective absorption coefficients for several n-values.27Measured liquid layer thicknesses ranged from 4 to 11 m and it was observed that the ratio of amplitudes between spectra of a given n-value corresponded by ratio of thickness as expected for linear attenuation, as the example of Fig.5illustrates for n13. Next, each absorption coefficient
FIG. 4.共Color online兲 CH2asymmetric mode amplitude as a function of the methylene group number共circles兲. Linearization used to derive the absorp-tion coefficient共line兲. Amplitude scaling model parameterized by the scale factor s to a linear mapping of n共s兲 共dotted line兲. Data at n9 are predicted for
s⬍ 0 indicating a loss of SAM integrity and marks the assigned threshold
n-value.
FIG. 5. 共Color online兲 Example liquid phase CH2stretching mode spectra: 共a兲 n13/ 11 m,共b兲 n9 / 8 m, and共c兲 n13/ 4 m, according to measured layer thickness. Absorption coefficients are derived from the asymmetric mode peak amplitudes, e.g.,␣n9and␣n13. The ratio of points共i兲 and 共ii兲 verify the linear dependence of absorbance on layer thickness, in this case for n13.
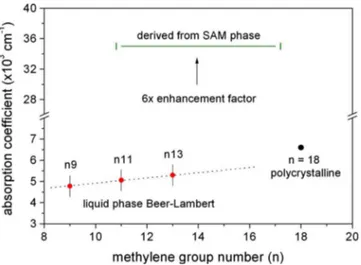
was calculated referencing the asymmetric peak amplitude and measured layer thickness data, the results of which are reported in Fig. 6, along with the constant value of ␣SAM derived above. Also shown in Fig.6is a data point borrowed from Parikh and Allara,21 evaluated from the spectrum of k 共imaginary part of the refractive index兲 in a KBr dispersed IR measurement of polycrystalline C19H39CO2Na. Figure6 pro-vides a graphical representation of the 6⫻ enhancement fac-tor observed between the liquid and SAM phase absorption coefficients.
V. ABSORPTION ENHANCEMENT EFFECT
The liquid phase trend line in Fig.6 suggests that poly-crystalline phase absorption coefficients may be up to 10% higher approximately. However, reported transmission FTIR measurements of the solid-liquid phase transition in poly-crystalline n-C21H44thin films共2 – 10 m兲 has demonstrated an intensity reduction of about 30% upon melting.30 Some decrease is expected owing to the lower number density, loss of intermolecular interaction, and increased conformational disorder associated with the liquid state.30,31We shall assume that our liquid phase absorption coefficients reflect these in-trinsic factors to a degree corresponding to the larger esti-mate, i.e., we expect up to a 40% increase in absorbance upon the crystalline phase transition.
Now consider the effect of number density. Based on the specific gravities and molecular masses of n11 and n13, their respective number densities are 2.5⫻ 1021 cm−3 and 2.2 ⫻ 1021 cm−3. Given these values, in a volume corresponding to their molecular length, about 15 and 18 Å, respectively, the areal densities each evaluate to approximately 0.04 Å−2. Also consider that the ideal SAM maintains a close-packed separation of about 4.5 Å, i.e., the molecular diameter, in a manner consistent with the polycrystalline state. In terms of an assumed square lattice surface cell, this yields an areal density of 0.05 Å−2 and we may conclude that the SAM
density is greater than the liquid by about 25%, accounting for a significant fraction of the 40% increase expected based on the phase change from the liquid state.
A more significant factor to address is the spatial orien-tation of the molecules with respect to the polar orienorien-tation of the incident optical wave. It is well known that the inten-sity of the vibrational transition is proportional to 兩E · p兩2, where E is the electric-field vector of the IR optical probe and p is the transition dipole moment共discussed in Refs.21
and 22兲. For the case of an isotropic liquid, averaging the cos2term over 4yields a factor of 1/3, relative to the case of a fixed molecular orientation of p collinear with E 共the maxima兲. In the SAM, the normal coordinates for both the asymmetric and symmetric vibrations are near coplanar with the surface, given that they are both directed orthonormal to the molecular axis and that the molecular axis tilt is small 共15°兲 with respect to the surface normal. Since our spectra were taken with unpolarized light, we may average in the plane of E for measurements made in transmission, resulting in a factor of 1/2 for the SAM phase. Therefore, based on orientational considerations, the maximum absorbance scale factor expected for the SAM relative to the liquid phase in our measurements is about 1.5⫻.
The combined effects of phase transition and orientation have accounted for about 2⫻ of the 6⫻ enhancement factor observed in the data. The remainder can be accounted for by considering the possible extrinsic effects of the surface or of intermolecular interactions specific to the SAM phase. Since the value of p is described classically as being proportional to the dipole moment derivative with respect to the normal coordinate of vibrational oscillation,21,32factors significant to a redistribution of electron density, such as molecular orbital intermixing and van der Waals forces, may result in in-creased oscillator strength, namely, 兩pSAM兩 ⬎ 兩pliq兩. The con-tribution of such factors stands to the reason given the im-portant role of intermolecular forces driving the self-assembly mechanism,17,33,34 and follows naturally from the discussion of phase related intensity variation outlined above. Note that in general, ⌬p may occur by virtue of a change in net permanent dipole or by induced dipole effects, i.e., a change in vibrational polarizability.35
In view of these considerations, two surface mechanisms can be included in the list of extrinsic factors expected to affect a redistribution of electron density. First is the sheet dipole moment contribution to the surface potential and sec-ond is the charge transfer associated with chemisorption of the thiol group to the GaAs共001兲 surface. A chain-length de-pendent dipole potential of about 230 mV is expected for n17-SAMs on GaAs共001兲,12
based on measurements of n17-SAMs on Au.36 In addition, XPS analysis has demon-strated an estimated 1.5 eV reduction in the binding energy of the S 2p line upon thiol chemisorption in n17-GaAs共001兲 SAMs,4,7indicating significant charge transfer from the sur-face upon covalent bond formation. Other sursur-face potential factors may play a role, such as those stemming from un-compensated semiconductor surface states. These factors will contribute to a chemical state modification of the surface
FIG. 6. 共Color online兲 Enhancement factor observed for the SAM phase absorption coefficient relative to Beer–Lambert measurements in bulk ma-terial. Data at n = 18 evaluated from the spectrum of k for polycrystalline C19H39CO2Na in Ref.21. The dotted line is used for trend visualization only.
environment, possibly resulting in a change of polarization sufficient to account for the observed absorption enhance-ment.
While this discussion does not refer to specific mecha-nisms other than factors relevant to a scaling of the general-ized selection rule for IR activity, our results can be placed in the context of similar observations made in other material systems. For example, chemisorption has been demonstrated as a distinguishing feature of IR enhancement on planar metal surfaces, such as the four times increase in vibrational polarizability observed for CO chemisorbed on Cu and Ag, compared to its gas and physisorbed phases.37,38 Moreover, enhancements of the order 10– 103can be realized on rough metal or metal-particle substrates in surface enhanced infra-red absorption共SEIRA兲 techniques,32and has been observed for n17 adsorbed on Au islands specifically.39 Both electro-magnetic共plasma resonance兲 and chemical mechanisms ac-count for the observed SEIRA enhancements and research distinguishing the two has been reported,32,40concluding that 共1兲 scaling of order 10 can be achieved based on the chemi-cal mechanism and that共2兲 chemisorption is a required ele-ment for this to manifest. An explanation behind the chemi-cal mechanism has been described for the case of CO chemisorbed on Cu共001兲 and relates to a dynamic charge transfer between adsorbate and metal bonding orbitals.41The chemical mechanism in SEIRA is less well understood but is thought to relate in a similar manner.32
Considering the expected change in chemical environ-ment upon SAM formation and particularly its dependence on thiol chemisorption, the similarity in the extrinsic en-hancement factor 共3⫻兲 relative to metal-based observations suggests that a related chemical mechanism may exist on the semiconductor surface. It is hoped that our results will add to the data supporting such effects and to corresponding refine-ments in theoretical hypotheses.
VI. CONCLUSIONS
SAM phase FTIR measurements of various n-alkanethiols on SI-GaAs共001兲 were made. Component analysis of the CH2 stretching mode region demonstrated good correspondence between the peak position and ampli-tude, supporting a structurally coherent physical overlayer model in the absence of significant conformational defects. Linearization of the asymmetric peak amplitude with mo-lecular chain length yielded an absorption coefficient maxi-mum of 3.5⫻ 104 cm−1 and provided evidence of ordered self-assembly for n-values ⬎9. Enhancement of the absorp-tion coefficient was quantified to be 6⫻ relative to the poly-crystalline and liquid phases. About 2⫻ of this enhancement factor was accounted for by the crystalline phase transition and molecular orientation, with the remainder attributed to the influence of surface and intermolecular effects specific to the SAM phase. As a more direct measurement of the ab-sorption coefficient, our results are relevant to the accuracy of surface derived quantities and demonstrate the signifi-cance of the chemical environment on IR spectral intensity.
ACKNOWLEDGMENTS
Funding for this research was provided by the Natural Sciences and Engineering Council of Canada 共STPGP 350501–07, the Canada Research Chair in Quantum Semi-conductors Program and the National Research Council of Canada Graduate Student Scholarship Supplement Program. The authors also wish to acknowledge helpful discussions with D. L. Allara.
1O. S. Nakagawa, S. Ashok, C. W. Sheen, J. Märtensson, and D. L. Allara, Jpn. J. Appl. Phys., Part 130, 3759共1991兲.
2C. W. Sheen, J. X. Shi, J. Märtensson, A. N. Parikh, and D. L. Allara,J. Am. Chem. Soc.114, 1514共1992兲.
3K. Adlkofer and M. Tanaka,Langmuir17, 4267共2001兲. 4Y. Jun, X. Y. Zhu, and J. W. P. Hsu,Langmuir22, 3627共2006兲. 5S. Ye, G. Li, H. Noda, K. Uosaki, and M. Osawa,Surf. Sci.529, 163
共2003兲.
6Q. Zhang, H. Huang, H. He, H. Chen, H. Shao, and Z. Liu,Surf. Sci.440, 142共1999兲.
7C. L. McGuiness, A. Shaporenko, C. K. Mars, S. Uppili, M. Zharnikov, and D. L. Allara,J. Am. Chem. Soc.128, 5231共2006兲.
8C. L. McGuiness, A. Shaporenko, M. Zharnikov, A. V. Walker, and D. L. Allara,J. Phys. Chem. C111, 4226共2007兲.
9C. L. McGuiness, D. Blasini, J. P. Masejewski, S. Uppili, O. M. Cabarcos, D. Smilgies, and D. L. Allara,ACS Nano1, 30共2007兲.
10O. Voznyy and J. J. Dubowski,J. Phys. Chem. C112, 3726共2008兲. 11D. M. Wieliczka, X. Ding, and J. J. Dubowski,J. Vac. Sci. Technol. A24,
1756共2006兲.
12S. Lodha and D. B. Janes,J. Appl. Phys.
100, 024503共2006兲.
13G. Nesher, A. Vilan, H. Cohen, D. Cahen, F. Amy, C. Chan, J. Hwang, and A. Kahn,J. Phys. Chem. B110, 14363共2006兲.
14L. Mohaddes-Ardabili, L. J. Martínez-Miranda, J. Silverman, A. Christou, L. G. Salamanca-Riba, and M. Al-Sheikhly, Appl. Phys. Lett. 83, 192 共2003兲.
15X. Ding, K. H. Moumanis, J. J. Dubowski, E. H. Frost, and E. Escher, Appl. Phys. A: Mater. Sci. Process.83, 357共2006兲.
16X. Ding, K. Moumanis, J. J. Dubowski, L. Tay, and N. L. Rowell,J. Appl. Phys.99, 054701共2006兲.
17L. H. Dubois and R. G. Nuzzo, Annu. Rev. Phys. Chem. 43, 437共1992兲. 18R. G. Nuzzo, L. H. Dubois, and D. L. Allara,J. Am. Chem. Soc.112, 558
共1990兲.
19D. Li, B. I. Swanson, J. M. Robinson, and M. A. Hoffbauer,J. Am. Chem. Soc.115, 6975共1993兲.
20I. Zawisza, A. Lachenwitzer, V. Zamlynny, S. L. Horswell, J. D. Goddard, and J. Lipkowski,Biophys. J.85, 4055共2003兲.
21A. N. Parikh and D. L. Allara,J. Chem. Phys.96, 927共1992兲. 22D. L. Allara and R. G. Nuzzo,Langmuir1, 52共1985兲.
23S. Flink, F. C. J. M. van Veggel, and D. N. Reinhoudt,Adv. Mater. 共Wein-heim, Ger.兲12, 1315共2000兲.
24M. V. Lebedev, D. Ensling, R. Hunger, T. Mayer, and W. Jaegermann, Appl. Surf. Sci.229, 226共2004兲.
25C. Bryce and D. Berk,Ind. Eng. Chem. Res.35, 4464共1996兲.
26Sample preparation carried out in a nitrogen purged glovebox mitigated the negative effects of humidity and oxidation as described in Ref.7. This was particularly relevant in order to achieve good results for SAMs n ⬍ 15.
27Alkanethiols n15共solid/liquid兲 and n17 共solid兲 cannot be measured in the liquid phase at room temperature.
28K. D. Truong and P. A. Roundtree,J. Phys. Chem.
100, 19917共1996兲. 29J. Hautman and M. L. Klein,J. Chem. Phys.
93, 7483共1990兲.
30H. L. Casal, D. G. Cameron, and H. H. Mantsch,Can. J. Chem.61, 1736 共1983兲.
31D. L. Allara, personal communication共14 May 2008兲.
32M. Osawa, in Near-Field Optics and Surface Plasmon Polaritons, Topics in Applied Physics Vol. 81, edited by S. Kawata共Springer-Verlag, Berlin, 2001兲, p. 163.
33J. Hautman and M. L. Klein,J. Chem. Phys.91, 4994共1989兲. 34A. Ulman, J. E. Eilers, and N. Tillman,Langmuir5, 1147共1989兲. 094310-6 Marshall, Bensebaa, and Dubowski J. Appl. Phys. 105, 094310 共2009兲
35H. Torii,J. Comput. Chem.23, 997共2002兲.
36S. Howell, D. Kuila, B. Kasibhatla, C. P. Kubiak, D. Janes, and R. Reif-enberger,Langmuir18, 5120共2002兲.
37B. N. J. Persson and A. Liebsch,Surf. Sci.110, 356共1981兲.
38P. Dumas, R. G. Tobin, and P. L. Richards,Surf. Sci.171, 555共1986兲. 39D. Enders and A. Pucci,Appl. Phys. Lett.
88, 184104共2006兲. 40M. Osawa and M. Ikeda,J. Phys. Chem.95, 9914共1991兲. 41B. N. J. Persson and R. Ryberg,Phys. Rev. B24, 6954共1981兲.